US10Y Fake Break:Is a New Bond Yield Rally About to Shake MarketToday, I want to analyze the U.S. 10-Year Government Bond Yield ( TVC:US10 ), as it is one of the key financial market indices that can show us the broader market direction for various assets like Gold ( OANDA:XAUUSD ), Silver ( OANDA:XAGUSD ), U.S. stock indices (including the S&P 500 ( FOREXCOM:SPX500 )), and especially Bitcoin ( BINANCE:BTCUSDT ) in the crypto market. Stay with me.
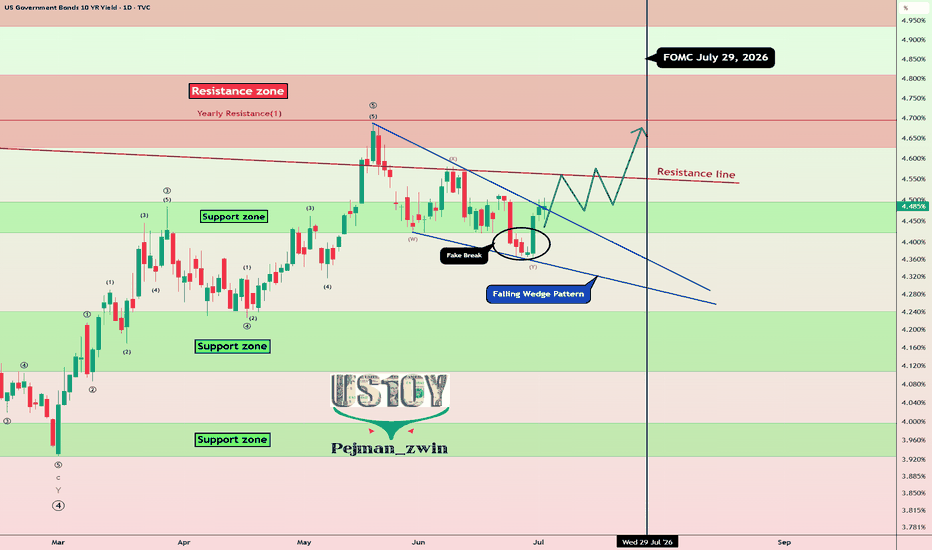
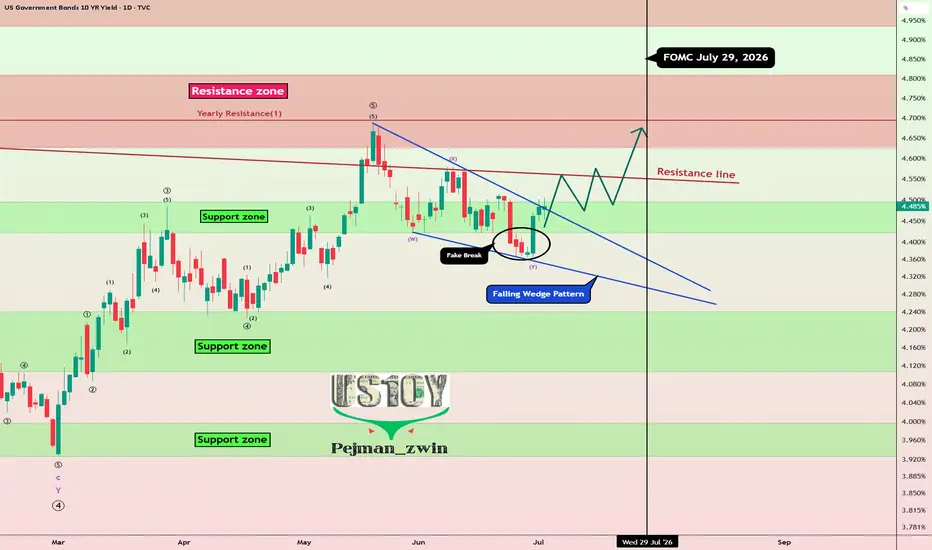
On the daily timeframe, the U.S. 10-Year Government Bond Yield is currently moving near a support zone (4.24%-4.10%) and has formed a fake break. Typically, after fake break patterns, the market tends to move in the opposite direction, with upward momentum (educational note).
From a classical technical analysis standpoint, the U.S. 10-Year Government Bond Yield seems to have formed a falling wedge pattern, which could signal a potential upward breakout.
From an Elliott Wave perspective, after breaking the upper line of the falling wedge pattern, we could anticipate the start of the next impulsive wave upward.
I expect the U.S. 10-Year Government Bond Yield to continue its upward trend in the coming days and at least reach the next resistance zone(4.64%-4.50%). This rise could lead to a decline in risk assets such as U.S. equities, gold, silver, and even the crypto market, including Bitcoin.
Target: Resistance zone(4.64%-4.50%)
Stop Loss(SL): 4.35%
Note: The U.S. 10-Year Government Bond Yield could potentially maintain its upward trend ahead of the FOMC meeting on July 29. After the release of new economic data and once we hear Warsh’s latest remarks, we may get a clearer signal about the next major move or a possible trend reversal.
------------
How Rising 10-Year Bond Yields Influence Major Assets
When 10-year government bond yields move higher, they tend to reshape investor behavior across markets:
Bitcoin & Cryptocurrencies
As yields climb, capital often rotates toward safer, income-generating assets like bonds. This shift can reduce demand for high-risk assets such as Bitcoin, potentially leading to price pressure.
Gold
Gold typically struggles in a rising yield environment. Since it doesn’t generate income, higher bond yields increase the opportunity cost of holding gold, which can weigh on its price.
U.S. Equities
Stocks, especially growth and tech sectors, may face headwinds. Higher yields usually mean higher borrowing costs, which can compress margins and slow down expansion for companies reliant on financing.
------------
What’s your view on US10Y? If US10Yr rises, could we see declines in gold, U.S. stock indices, and the cryptocurrency market?
💡 Please respect each other's opinions and express agreement or disagreement politely.
📌 US 10-Year Government Bond Yield Analyze (US10Y%), Daily time frame.
🛑 Always set a Stop Loss(SL) for every position you open.
✅ This is just my idea; I’d love to see your thoughts too!
🔥 If you find it helpful, please BOOST this post and share it with your friends.
Falling Wedge
SPCX should go higherI recently visited The Kennedy Space Center Visitor Complex and had a chat with an astronaut about the Perseverance and Curiosity rovers. At some point, he mentioned he'd recently talked to Elon about SpaceX and was told Elon wanted to land his rockets in the ocean to help generate coral reefs. Interesting! I also realized how frequently SpaceX was on display throughout the complex. I couldn't stop thinking any investment in SPCX will have a decent ROI in the future.
That said, the stock took a beating post-IPO as I expected. Buying at the open was foolish and I knew the big boys would pull it down for a better risk-reward opportunity. Now, it seems we may have reached the bottom and SPCX will start running north again.
On the technical front, I see several positive metrics. (remember finding confluence improves your odds of success):
- The price is very close to hitting the super trend line (green) which will act as support
- The price is trending inside a falling wedge (yellow) which should be broken to the upside soon
- Fib timezone lines are almost perfectly aligned with tops and bottoms and today we hit another line (dashed blue) which indicates the next candlestick may reverse the trend
- RSI is near 30. If you look at the 2H chart, RSI wants to move up badly
- Volume POC is at $156 which will act like a magnet and pull the price up
Note that it is possible the price visits $100 since it's a psychological level. Regardless, $100-115 is a good accumulation zone. At these levels, we're looking at a 100% return once the price visits the ATH.
The SPCX IPO and the overall macro environment were bad for other space stocks. I anticipate bullish flows will start trickling in starting next week.
See also:
ONDO Breakout After Major RWA News — Is Another 20% Rally Next?Ondo ( BINANCE:ONDOUSDT ) surged over 17–20% on July 15–16, 2026, primarily driven by a major institutional milestone: the launch of tokenized stock representations backed by DTCC’s Tokenization Service (the largest U.S. securities clearinghouse).
This development creates real “digital twins” of DTC-held securities (such as SPY and CRCL) on-chain, marking a significant step in bridging traditional finance infrastructure with blockchain. Combined with the ongoing strong RWA narrative and previous catalysts like the Ondo Perps launch and 24/7 Solana ( BINANCE:SOLUSDT ) trading, it triggered renewed buying interest and higher volume.
---------
Now, let’s dive into the technical analysis of ONDO on the 8-hour timeframe. Stay with me.
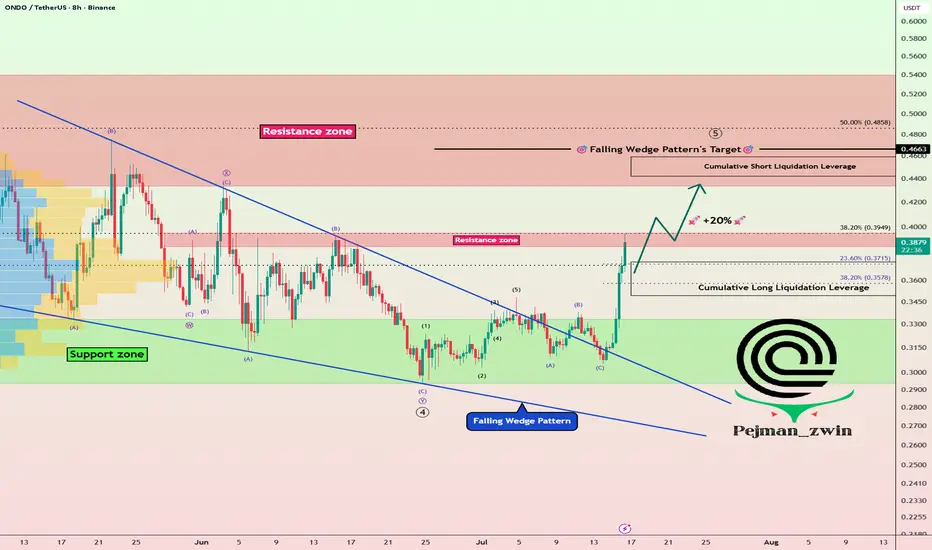
ONDO is currently attempting to break the resistance zone($0.395-$0.385) and appears to have successfully moved above the key trading level of $0.37. I expect the token to break this resistance zone and continue its bullish trend.
From a classical technical analysis perspective, ONDO has successfully broken the upper trendline of the Falling Wedge Pattern. This breakout has been supported by strong trading volume, and considering the recent fundamental news surrounding the project, we can expect this bullish momentum to continue toward the next resistance zone($0.540-$0.433).
From an Elliott Wave perspective, it appears that main wave 4 has been completed with the help of the Falling Wedge Pattern, and we can now expect the next impulsive wave to begin.
I expect ONDO to gain at least +20% from its current price and move toward the next resistance zone($0.540-$0.433) and the Cumulative Short Liquidation Leverage($0.459-$0.442).
Target: $0.430
Stop Loss(SL): $0.343(Worst)
What’s your view on ONDO? Do you think it can continue its bullish trend, or should we expect another correction first?
💡 Please respect each other's opinions and express agreement or disagreement politely.
📌 Ondo Analyze (ONDOUSDT), 8-hour time frame.
🛑 Always set a Stop Loss(SL) for every position you open.
✅ This is just my idea; I’d love to see your thoughts too!
🔥 If you find it helpful, please BOOST this post and share it with your friends.
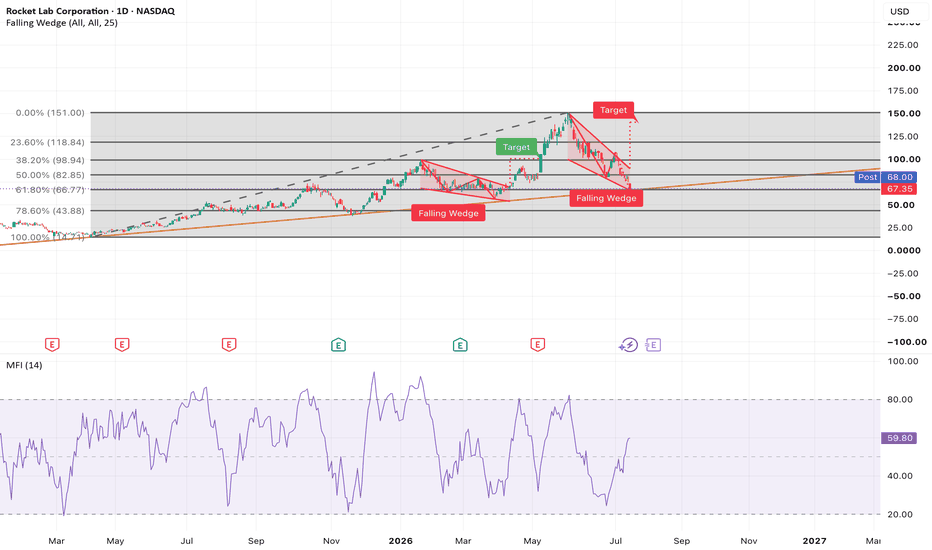
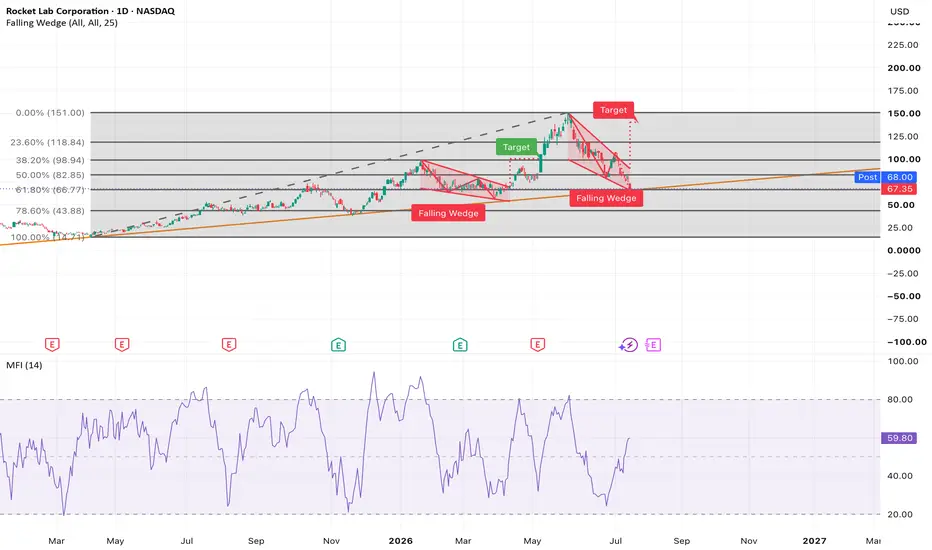
RKLB dip buying opportunity Many high beta stocks in the space and AI sectors are dumping right now. RKLB sits at an attractive price level after today's sell-off for long-term investing.
- 61.80% retracement of a move from April 2025
- Falling wedge pattern that's typically bullish once broken
- Ascending trendline that has been tested 3 times now
- MFI keeps rising despite bearish price movement
Additionally, earnings season is approaching which is likely to change the market sentiment soon.
WIPRO Bullish Setup | Breakout Watch WIPRO UPDATE | Channel Breakout Setup
Key Breakout Level: 181
A sustained breakout above 181 can confirm fresh bullish momentum.
Upside Targets:
183 (Initial Retest Zone)
187
190 (Channel Pattern Target)
Major Support Zone: 170 – 172
Market View: The bullish structure remains intact as long as the stock holds above the 170–172 support zone. A decisive breakout above 181 can accelerate the move towards the next resistance levels.
NVDA Breaking Out Falling Wedge - Needs to Hold 50 MA NVDA Breaking Out Falling Wedge - Needs to Hold the 50 SMA & clear this resistance but if buyers step in, or there's any catalyst NASDAQ:NVDA could really run - It needs to clear this level. It is currently testing key resistance after forming a nice double bottom / W off the 200-day SMA. EMA's are also curling upwards (Not pictured) - Watching Close as if NASDAQ:NVDA really runs it could pull the broader markets AMEX:SPY SPCFD:SPX NASDAQ:QQQ with it.
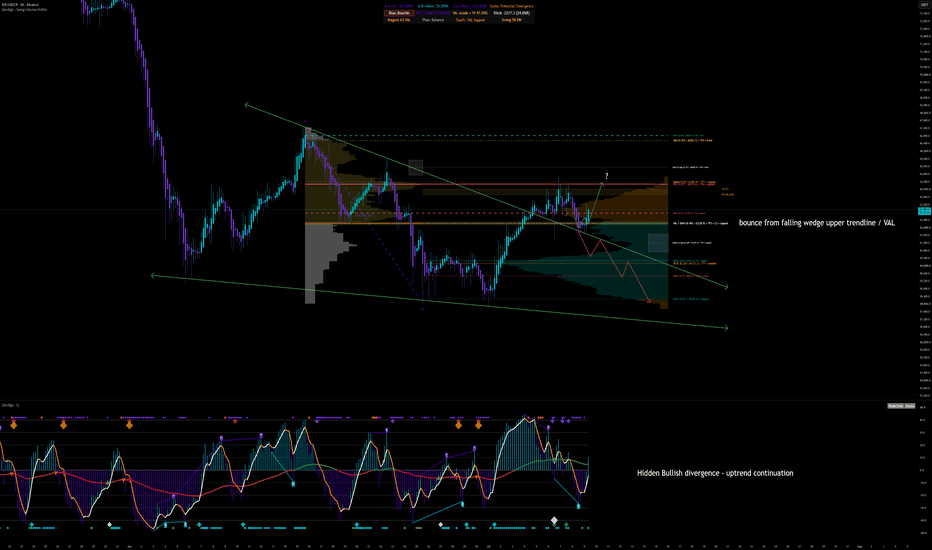
BTC: Falling Wedge Retest + Hidden Bullish DivergenceBTC: Falling Wedge Retest + Hidden Bullish Divergence
BTC is reacting from an important technical area.
Price broke above the upper trendline of the falling wedge, pulled back into that former resistance, and is now trying to turn it into support.
At the same time, Q is showing a hidden bullish divergence, which adds trend-continuation confluence to the bullish scenario.
This does not mean the move is fully confirmed yet. BTC is still inside the Value Area, and the next real test is the POC / VAMid zone above.
Core Thesis
BTC is attempting a bullish retest of the falling wedge breakout while trading inside value.
If buyers defend the retest zone and reclaim the internal value levels above, the market can rotate higher toward VAH.
If the retest fails, the move becomes a failed breakout and price can rotate back toward VAL and the lower developing profile.
Key Levels
Retest zone / upper wedge trendline: former resistance now acting as support
VAL ~62.2k: lower boundary of the current value area and key support
dPOC ~62.7k: internal magnet near current price
POC / VAMid ~64.3k-64.4k: first major upside checkpoint
Ditch ~65.1k: low-volume area that can act as a reaction zone
VAH ~66.5k: main bullish rotation target and higher confirmation level
Lower developing profile ~61.9k-60.2k: downside rotation zone if the retest fails
Bullish Scenario
The bullish scenario starts with BTC holding the falling wedge retest.
If price stays above the retest zone and continues accepting above the lower value area, the next logical target is the POC / VAMid around 64.3k-64.4k .
That is the first important test for buyers.
A clean reclaim and acceptance above POC would suggest that BTC is moving from a weak lower-value position back toward the upper part of the auction.
From there, the next checkpoint is the Ditch around 65.1k , followed by the main rotation target at VAH around 66.5k .
Acceptance above VAH would be the stronger confirmation that BTC is no longer only rotating inside value, but attempting upside expansion.
Bearish Scenario
The bearish scenario starts if BTC fails this retest.
If price loses the wedge trendline again and accepts back below the VAL area, the breakout loses strength.
In that case, the first downside magnet is the lower developing value area around 61.9k-61.3k .
If sellers keep control there, the next logical magnet becomes dPOC around 60.2k .
That would mean the market rejected the bullish retest and moved back into value-seeking behavior lower.
Momentum Context
Q adds important confluence to the bullish scenario.
The recent pullback created a hidden bullish divergence on Q, which is typically a trend-continuation signal rather than a simple reversal signal.
That supports the idea that BTC may be trying to continue the upside move after retesting the falling wedge breakout.
This does not remove the need for confirmation, but it makes the bullish case stronger as long as price holds the retest zone and reclaims the POC / VAMid area.
For me, the key confirmation remains price acceptance above POC / VAMid around 64.3k-64.4k , ideally with Q continuing to stabilize and turn higher.
Educational Note
A falling wedge breakout is not confirmed only by crossing the trendline.
The quality of the retest matters more.
If former resistance becomes support and price starts accepting back above value levels, the setup gains strength.
If price falls back below the breakout zone, the pattern becomes a failed breakout and the market usually rotates toward the next liquidity or volume magnet.
The hidden bullish divergence on Q is useful here because it supports continuation, but price still needs to confirm the idea through acceptance above key volume levels.
Final View
BTC is choosing the bullish path for now, and Q hidden bullish divergence adds trend-continuation confluence.
Hold wedge retest -> reclaim POC / VAMid -> rotate toward Ditch -> VAH.
Lose wedge retest -> lose VAL -> rotate lower toward developing value and dPOC.
No prediction. Just a conditional map around the falling wedge retest, Q momentum context, and the volume profile levels.
$TTD: Falling Wedge + Higher-Timeframe RSI Bullish DivergenceNASDAQ:TTD is showing a technical setup worth watching as price continues to compress inside a falling wedge structure.
The key signal here is not just the wedge itself, but the momentum behavior underneath price. RSI is showing bullish divergence across multiple higher timeframes:
Weekly RSI bullish divergence
2-week RSI bullish divergence
3-week RSI bullish divergence
This suggests downside momentum may be weakening while price continues to trade near the lower end of the structure.
From a technical perspective, falling wedges can become important reversal structures when price begins to tighten, volatility compresses, and momentum starts improving before price confirms the move.
For confirmation, I would want to see:
A clean breakout above wedge resistance
Improving volume on the breakout
RSI continuation higher
Price reclaiming prior resistance levels
Until then, this remains a watchlist setup, not a confirmed reversal.
Invalidation would be a sustained loss of wedge support with RSI failing to improve.
Overall, NASDAQ:TTD is setting up as a higher-timeframe bullish divergence watch. The chart still needs confirmation, but the structure and momentum are worth monitoring closely.
This is not financial advice. This is my personal technical analysis and trading plan for educational discussion.
$PENGUUSDT Falling WedgePENGUUSDT is trading on the 1D timeframe and is currently compressing inside a falling wedge pattern. The structure is defined by descending resistance and support trendlines, with price approaching the apex where a directional move may develop.
The current price is trading around 0.0066 USDT. The lower boundary of the wedge and the nearby 0.0049 USDT area act as key support, while the upper descending trendline represents the primary resistance zone.
A breakout above the wedge resistance would provide the initial confirmation that bullish momentum may be returning. If that breakout is confirmed, the chart projects a potential move toward 0.011655 USDT, which is approximately 78% above the current price zone.
If price fails to break the upper trendline and instead falls below the wedge support, the bullish setup would be invalidated and further downside could be considered. As always, watch for confirmation before interpreting the pattern.
This analysis is based solely on the visible chart structure and is intended for educational purposes.
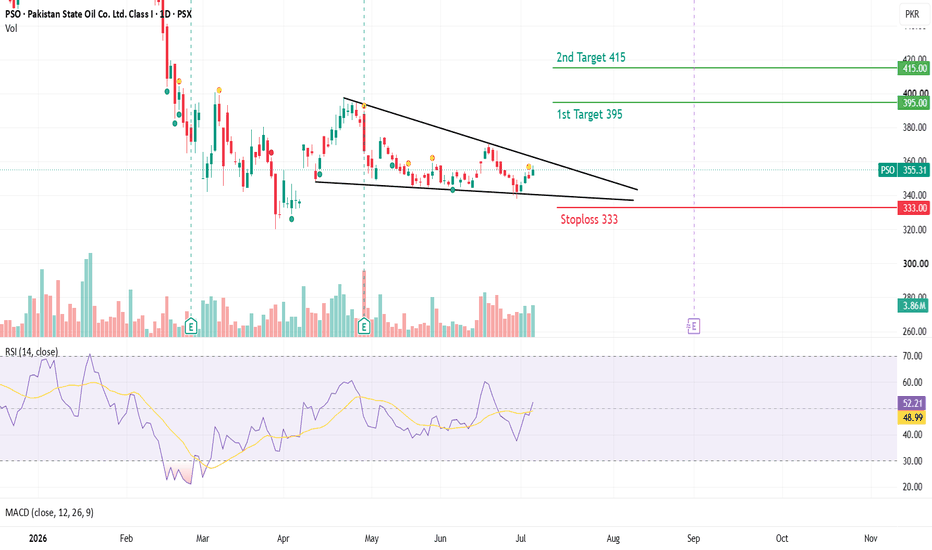
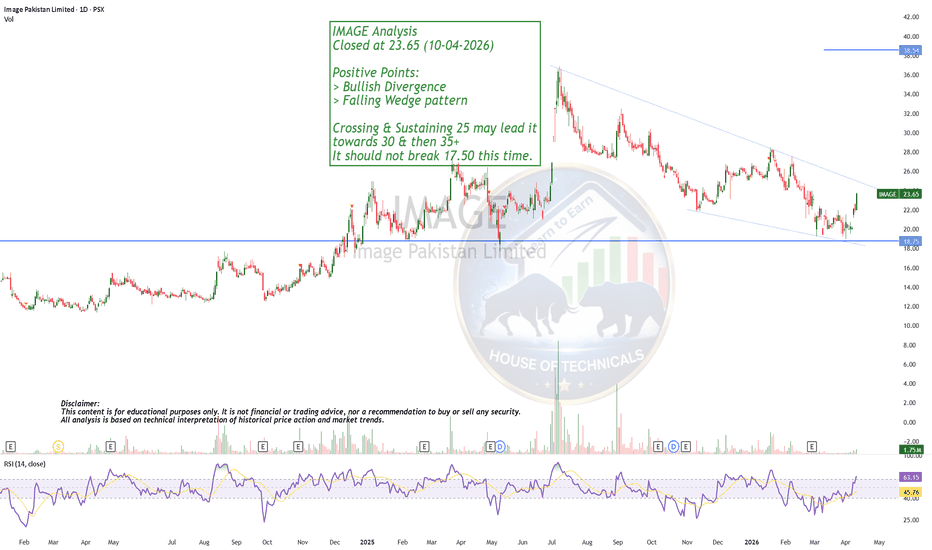
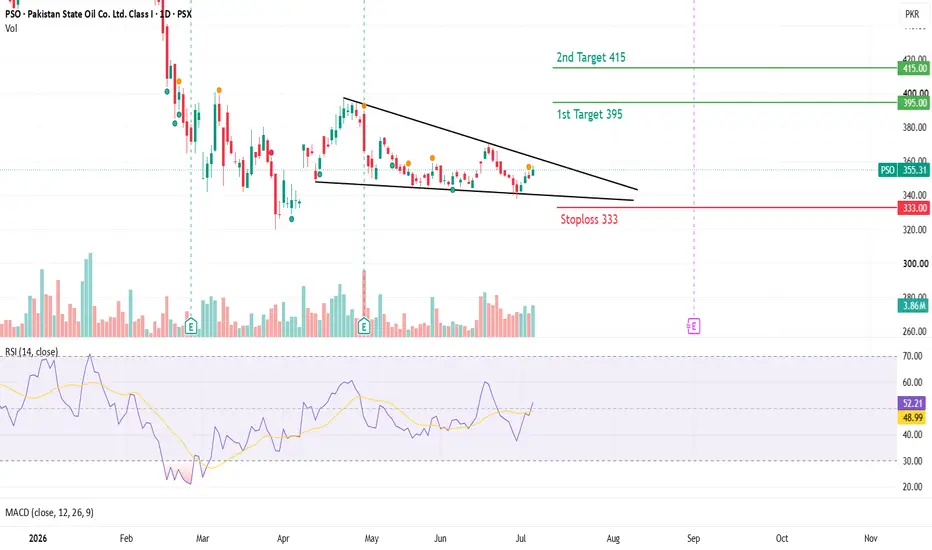
PSO on a wedgePSO (Pakistan State Oil) – Bullish Falling Wedge Breakout
Technical Setup:
PSO has broken out of a classic Daily Falling Wedge pattern. The breakout is confirmed by expanding volume, an RSI hook above 50, and a fresh bullish MACD crossover at the zero line.
Execution Parameters:
Strategy: Buy / Accumulate
Current Market Price: 355.31 PKR
Buy Range: 345.00 to 355.00 PKR
Stop Loss: 333.00 PKR (Daily Closing Basis)
Risk Per Share: 22.31 PKR (6.28% risk)
Targets:
Target 1: 395.00 PKR | Upside: 11.17% | R:R Ratio: 1 : 1.78
Target 2: 415.00 PKR | Upside: 16.80% | R:R Ratio: 1 : 2.68
Manage your risk carefully and follow position-sizing rules.
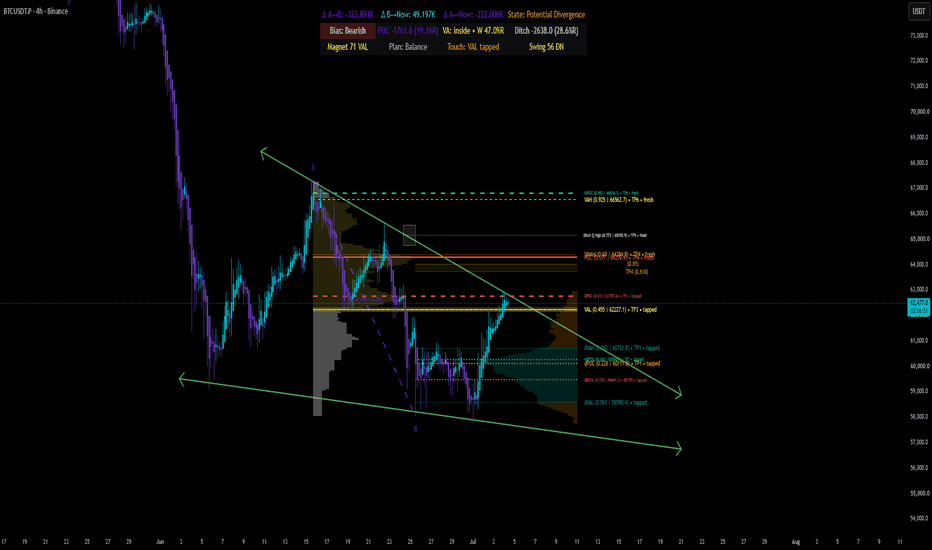
Back to the Value.BTC 4H: Back Inside Value, But Still Fighting Falling Wedge Resistance
BTC has managed to reclaim the value area after tapping the VAL zone around 62.2k.
That is constructive, but not enough by itself.
Price is now testing an important confluence:
Back inside VA
VAL reclaimed around 62.2k
Falling wedge resistance directly above price
Current price near the 62.4k area
This makes the next few 4H closes important.
The market is no longer in a simple breakdown structure, but it has not confirmed a clean breakout yet.
Scenario 1: Bullish Acceptance Back Inside Value
The bullish scenario requires BTC to hold above the VAL and start closing above the falling wedge resistance.
If buyers can confirm acceptance back inside the value area, the next upside magnet is the higher-volume zone around 64.2k-64.5k.
That area lines up with previous value/POC resistance and is likely the first important reaction zone.
If BTC accepts above that region, the next upside targets are around 65.1k and then the upper value area near 66.5k.
In simple terms:
Hold above 62.2k VAL
Break and close above falling wedge resistance
Target 64.2k-64.5k first
Above that, watch 65.1k and 66.5k
This would suggest that the move back into value is not just a short squeeze, but a real acceptance move.
Scenario 2: Rejection From Wedge Resistance
The bearish scenario is a rejection from the falling wedge resistance followed by a loss of the VAL.
If BTC fails to close above the wedge and starts closing back below 62.2k, the reclaim loses strength.
That would turn the move back into value into a failed acceptance.
In that case, price can rotate back toward the lower liquidity and volume zones.
The main downside areas I would watch are:
60.7k
60.0k
59.4k
58.6k
A clean loss of VAL would put sellers back in control and increase the probability of another sweep toward the lower part of the structure.
Key Level
For me, the key zone is 62.2k-62.5k.
As long as BTC holds above this area and keeps building acceptance inside VA, the bullish scenario remains alive.
If price loses this zone and rejects the wedge, the setup shifts back toward a bearish rotation.
Final Thought
BTC is at a decision point.
Reclaiming value is positive.
But the falling wedge resistance still needs to be broken.
The next move depends on whether BTC confirms acceptance above this resistance, or fails and rotates back below VAL.
This is not a prediction.
It is a trigger-based plan.
$TONUSDT Falling WedgeTONUSDT Perpetual Contract is currently trading on the 12H timeframe and is consolidating within a falling wedge, which is also positioned inside a larger descending structure visible on the chart.
The current price is trading around 1.57 USDT, where price continues to compress near the upper boundary of the smaller wedge. This area may become important as volatility contracts.
Key Levels
Support: ~1.50–1.55 USDT
Resistance: ~1.85 USDT (highlighted confirmation zone)
Higher descending resistance remains near the upper boundary of the larger wedge.
A confirmed breakout above approximately 1.85 USDT could indicate that buyers are gaining momentum. If this breakout is sustained, the chart projects a move toward approximately 2.50 USDT, representing an upside potential of roughly 35% from the confirmation level (or about 59% from the current price zone).
If price fails to hold the wedge support and breaks below the lower boundary, the bullish setup may become invalid, and further downside could remain possible. Watching for a confirmed breakout before considering the projected target is important.
This analysis is based solely on the chart structure shown and is intended for educational purposes rather than financial advice.
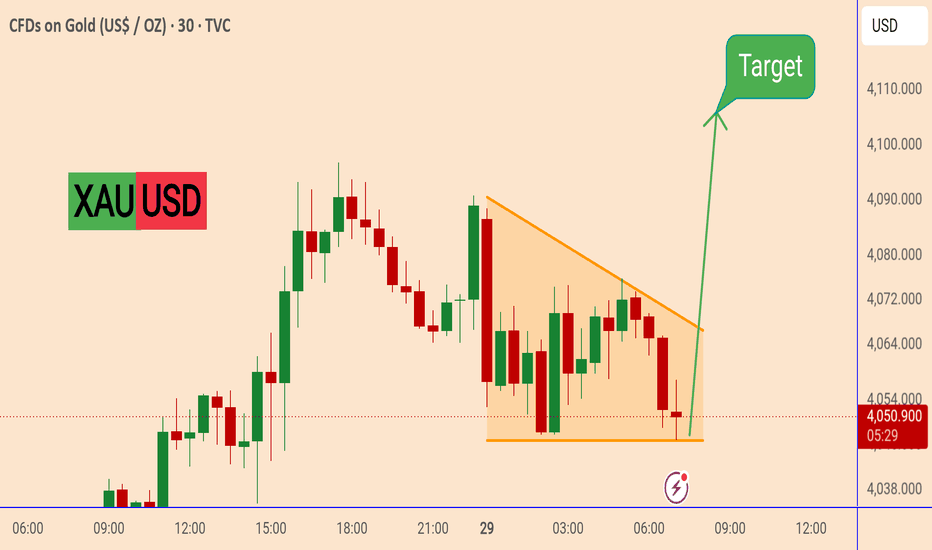
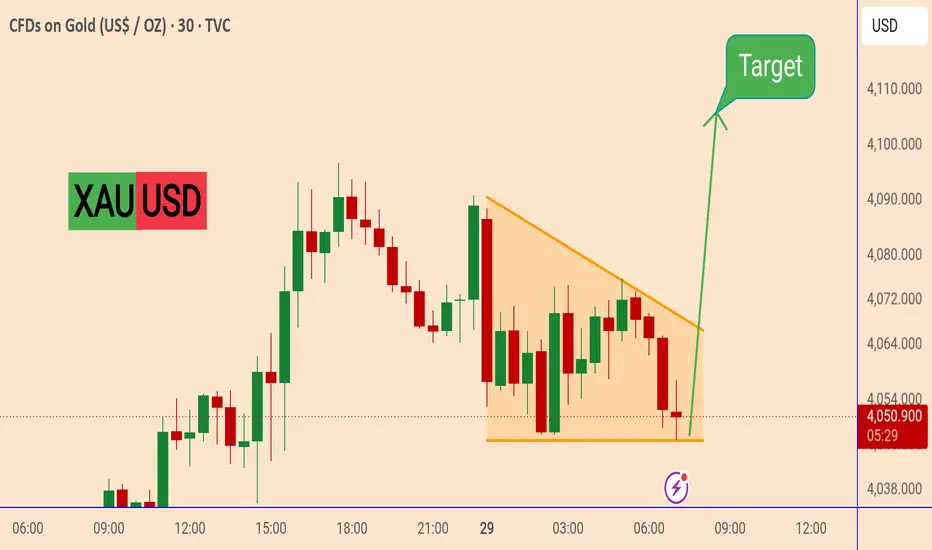
GOLD Technical Analysis
Each candle represents 30 minutes of price movement
Current Price: 4,053.62
. The Pattern: Descending Triangle
The shaded orange area highlights a market consolidation:
The Top Line: Sloping downwards, showing sellers are pushing the highs lower.
The Bottom Line: A flat, horizontal support floor around 4,046 where buyers keep stepping in.
. The Strategy (The Setup)
The green arrow illustrates a bullish trade idea:
The Breakout: Anticipating price to break above the descending orange trendline.
The Move:A rapid, sharp move upward once the breakout occurs.
The Target: The green arrow points to an upside target around 4,105.
⚠️ Note: For this trade to validate, price needs to cleanly break out of the top orange line. If it breaks below the bottom floor instead, the setup is canceled.
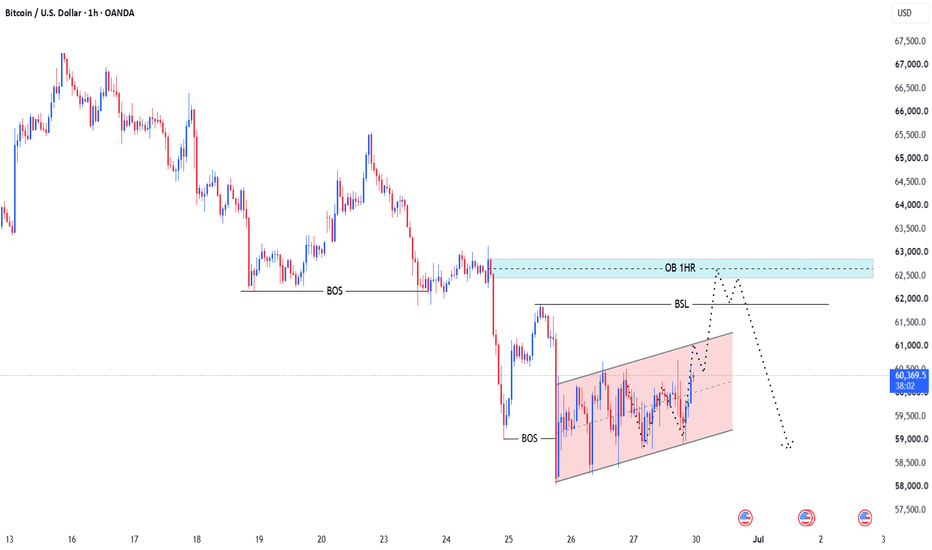
BTCUSD: Falling Wedge + Bearish OB at 62,600-62,700 – Liquidity Market Outlook:
Bitcoin is currently in a bearish trend, forming a Falling Wedge pattern.
The structure suggests one final move higher to grab Buy Side Liquidity above the wedge before continuing lower.
Key Selling Zone:
62,600 – 62,700 (Bearish Order Block)
Reasons: Overall bearish market structure intact
Falling Wedge pattern (often leads to continuation after liquidity sweep)
Strong Bearish OB acting as major supply area
High probability of rejection after grabbing liquidity above the wedge
Expected Scenario:
Price likely sweeps liquidity above the wedge → then reverses down from the 62,600-62,700 zone for the next leg lower.
Bias: Bearish (after liquidity grab)
This is not financial advice. Always manage your risk properly.
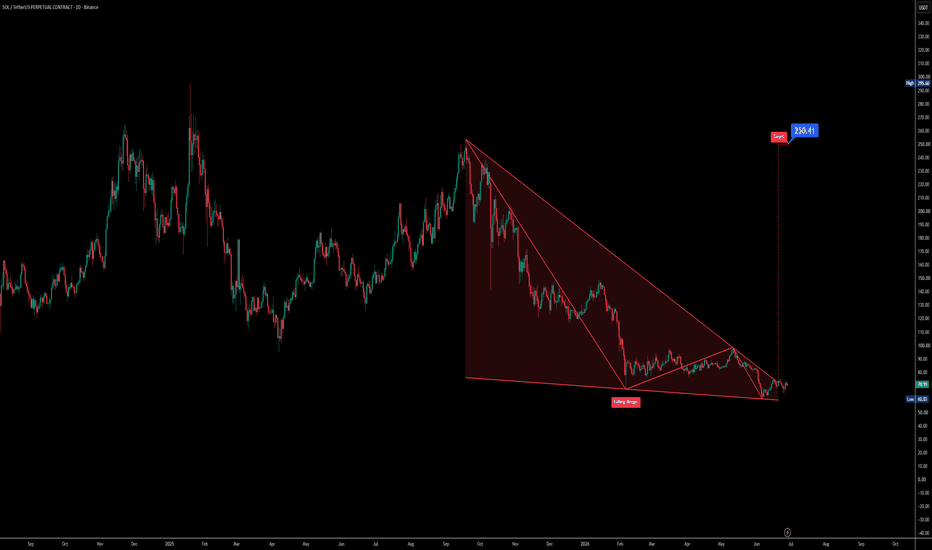
$SOLUSDT Falling WedgeSOLUSDT Perpetual Contract on the 1D timeframe is trading around the 71 USDT zone after developing a large Falling Wedge pattern visible on the chart.
The structure shows a prolonged series of lower highs and lower lows contained within converging trendlines. This type of pattern is commonly monitored for a potential bullish reversal if price breaks above the upper resistance trendline with confirmation.
Key support is located around 60 USDT, where the lower boundary of the wedge has provided multiple reactions. Immediate resistance is the descending trendline near the 80–90 USDT region, followed by the broader upper wedge resistance.
A bullish breakout could be considered only if price closes convincingly above the upper trendline. Until then, the pattern remains under observation and confirmation is still required.
The chart projects a measured target near 250.41 USDT, representing an approximate 250% move from the current price area if the breakout is confirmed and the measured move develops as illustrated.
If price fails to hold the 60 USDT support and breaks below the lower wedge boundary, the bullish pattern may become invalid, increasing the risk of additional downside. Watch for confirmation before interpreting the projected target.
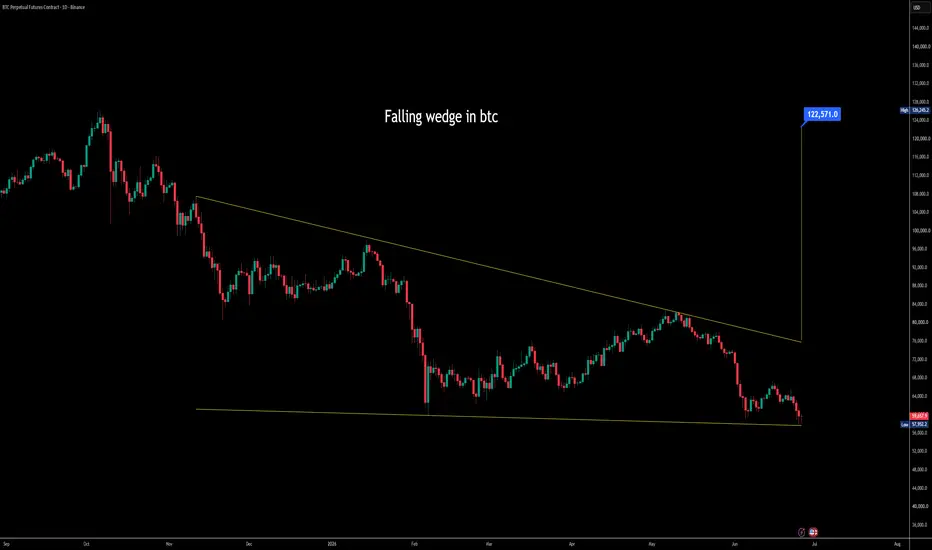
$BTC: Massive Falling Wedge Retest | Is a 100K+ Rally Loading?Bitcoin is currently retesting the lower boundary of a long-term Falling Wedge, a pattern that has historically been associated with bullish reversals after extended downtrends.
Chart Observations
• Price is trading near the wedge's major support around $58K–60K.
• The descending resistance line continues to cap bullish momentum.
• Multiple touches on both trendlines strengthen the validity of the pattern.
• A successful defense of support could mark the beginning of a significant trend reversal.
Bullish Scenario
A confirmed breakout above the wedge resistance could open the door to:
🎯 Target 1: ~$108,000
🎯 Target 2: ~$126,000
These targets are derived from the projected move of the falling wedge pattern.
Bearish Scenario
If Bitcoin fails to hold the current support zone, the bullish structure would weaken, and additional downside could follow before any meaningful recovery.
Trading Plan
✔ Wait for a confirmed breakout with strong volume.
✔ Avoid anticipating the breakout before confirmation.
✔ Manage risk with proper position sizing and stop-loss placement.
The current support zone is one of the most important levels on the chart. Whether BTC holds or breaks this area will likely determine the next major move.
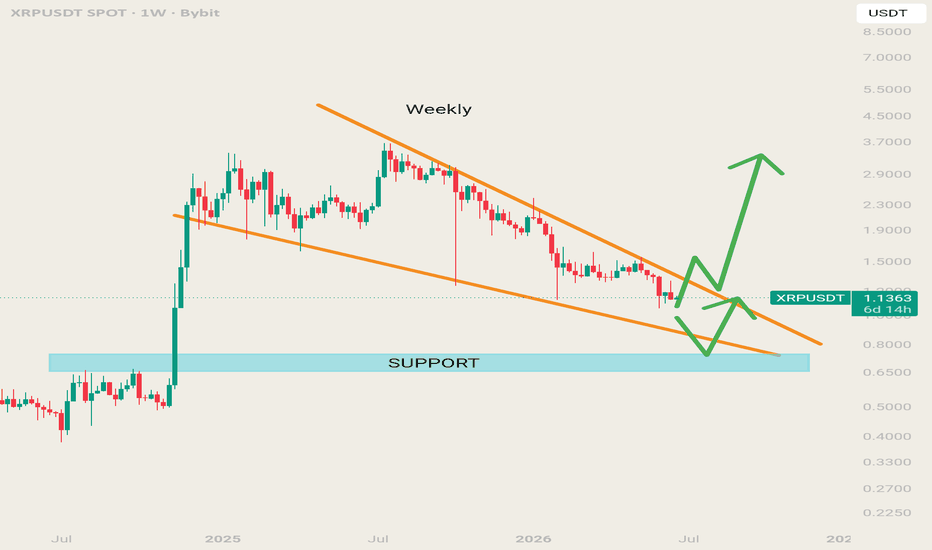
XRP outcome🚨 XRP APPROACHING A MAJOR BREAKOUT ZONE 🚨
XRP is compressing inside a long-term Weekly wedge while sitting above a key support area. As price approaches the apex, volatility is likely to increase and a major move could be getting closer.
Will buyers break above resistance and ignite the next bullish rally, or will sellers push XRP back toward support before the real move begins?
👀 All eyes on this level.
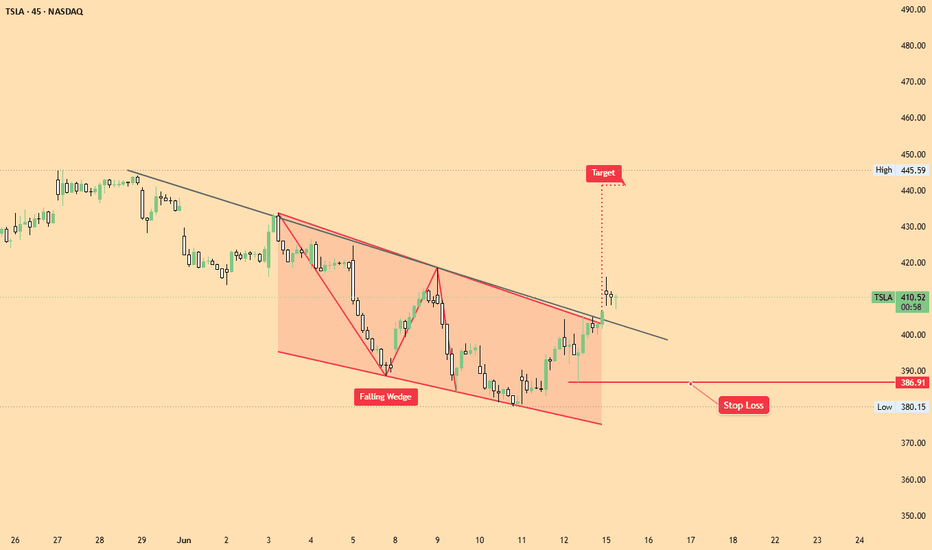
#TSLA TESLA - Good Break , Offering Good Risk to Reward
We have a classic bullish setup on TSLA with a textbook falling wedge breakout on the 45-minute chart. The price has been compressing between converging downward trendlines, which shows selling momentum was drying up. We just got a clean daily close above the upper resistance line, confirming the breakout. As a trader, this looks like a solid risk-to-reward play: the plan here is to set a stop loss just under the recent swing low at 386.91 to manage risk, and ride the upward momentum toward the target level near 445.59.
C3.ai — Falling Wedge Breakout SetupC3.ai is showing a long-term falling wedge structure on the weekly chart.
Since the major post-IPO decline, price has continued to compress inside a broad descending wedge, with lower highs and lower lows tightening into the current range. After repeated downside pressure, price is now attempting to reclaim from the lower portion of the structure and push back toward the upper wedge resistance.
The main area I’m watching is the descending resistance line. A clean weekly breakout above that level could shift the chart from bearish compression into a potential reversal setup.
What stands out:
Long-term falling wedge compression
Multiple reactions near the lower boundary
Price attempting to reclaim from the lower wedge zone
Weekly structure improving after a major basing move
Potential upside toward prior resistance if momentum confirms
Best entries are usually on pullbacks or retests, not after vertical candles
The setup still needs confirmation. Falling wedges can be powerful when they resolve, but failed breakouts are common. I want to see price hold the reclaim, avoid rejection at wedge resistance, and build strength above the descending trendline.
Key areas I’m watching:
Breakout confirmation: weekly close above falling wedge resistance
Invalidation: loss of the recent reclaim and lower support structure
Upside targets: prior resistance zones if momentum expands
This is not about chasing a headline or a theme. It is about watching a beaten-down chart with long-term compression, improving weekly structure, and a possible risk/reward shift if buyers continue stepping in.
Educational only. Not financial advice.
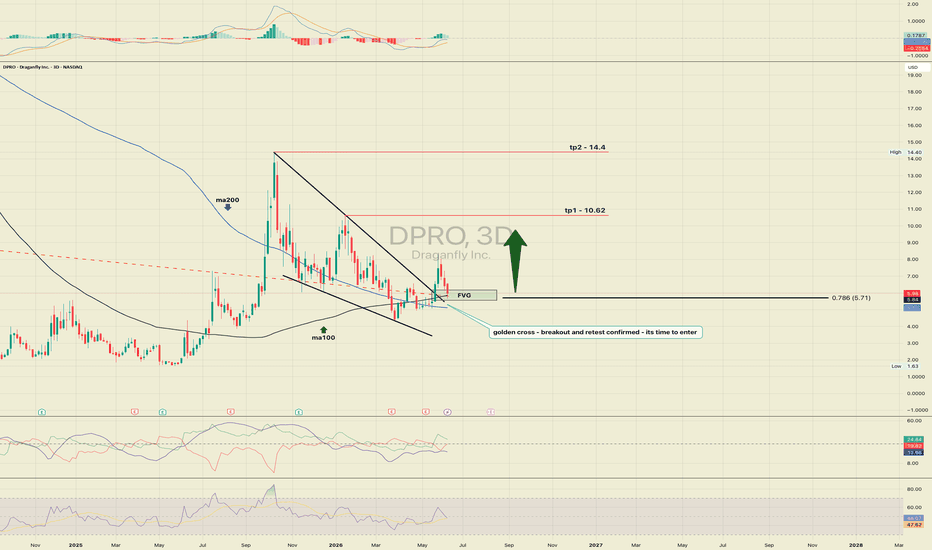
DPRO: When Canadian drones storm the Pentagon and EuropeDraganfly builds unmanned systems for militaries, border forces and first responders. Its platforms are involved in programs of the US, Canadian and Swedish armies, and the May contract with DEVCOM for a counter‑drone system locks the company into a priority defense direction. The company trades on Nasdaq, and everyone who understands that the global shift to mass‑produced reconnaissance drones gives a small manufacturer a chance to grow into a global military supplier is watching.
Fundamentals
The first quarter of 2026 brought record revenue of 2.31 million dollars, a 49 percent increase. Gross margin came in at 15 percent due to an unfavorable sales mix and one‑time inventory write‑offs. The net loss widened to 5.63 million dollars, with a loss per share of 0.18 dollars. The balance sheet holds 147 million dollars in cash after a February offering at 7 dollars per share.
Key events: on May 20, Draganfly and F4 Defense were selected by the DEVCOM Army Research Laboratory to develop a modular counter‑unmanned aircraft system. In March, the company and Palladyne AI completed the integration of SwarmOS, validating autonomous swarm capabilities. In Sweden, drones have been deployed for search‑and‑rescue operations using Smith Myers ARTEMIS mobile phone detection and geolocation. The company supplies Flex FPV drones for US Air Force Special Operations Command training and became the exclusive integrator and distributor of the Blitz EO/IR payload for the Americas.
Risks
The operating gap between revenue and loss requires either rapid scaling or further equity raises. Insiders have been selling shares with no purchases. Dilution remains a real threat.
Technicals
On the three‑day chart, price broke out of a descending wedge and completed a retest, forming the buy zone at the confluence of the 0.786 Fibonacci level, the fair value gap, and the 100‑day moving average. Yesterday‘s close was 5.98 dollars. Volume is many times above multi‑month averages. ADX and MACD give a buy signal, and the 100‑day and 200‑day moving averages have formed a golden cross.
First target is 10.62 dollars, second target is 14.40 dollars.
The market values Draganfly as a speculative bet on military rearmament and the shift to mass‑produced drones. Losses and dilution remain risks, but the growing defense portfolio and technical breakout create an asymmetric setup.
Strong bullish signals on high timeframes = a market convinced INTRODUCTION:
This is a microcap bio so risk should be managed by strictly limiting position size. I won't bother talking about any fundamentals. We all know what makes startup bios move.
THE TA:
The above 1M chart provides a clean structure and a view of the following base bullish observations:
1. Overall downtrend is still intact but showing signs of imminent breaking.
2. The structural low at circa $0.54 was followed by a break of local downward diagonal resistance and the opening of a multi-year local uptrend.
3. The multi-year uptrend has printed three local higher lows so far.
4. After the last local higher high from March '24, price action entered a period of distribution/consolidation within a falling wedge pattern.
5. The last two higher lows printed as support on past resistance (gold ellipses).
6. The falling wedge extension provides a forecast to the top of local uptrend for a third local higher high.
7. The falling wedge extension reaches the horizontal area of the legacy gap-down from December '21. This means price action may not stop at the ceiling of the local uptrend and instead continue upward to close the gap and top out in the horizontal channel of market resistance at circa $13.
Supplemental TA:
1. 4W stochastic RSI is crossing up 20. Look left to see what price action had done the last two times that happened.
2. Multiple DOJIs on high timeframes. On the 3M, one has already printed and another one or a hammer likely confirms it at the end of June (this month). On the 5M, a DOJI has already printed and it will confirm in 5 more months. On the 6M, a DOJI prints at the end of June (this month); it could end up being a hammer. Every monthly timeframe from 7M to 12M has a DOJI printing right now.
FINAL WORDS:
Positions should be kept small and closed depending on whether diagonal resistance at the third implied local higher low holds or not. If it shows signs of holding, exit there. If price action breaks through, exit no later than $13. Should the market resistance area violently break to the upside, don't push your luck above $31.
The idea is invalidated if the multi-year local uptrend in which price action is currently moving breaks down to become a confirmed bear flag inside the overall downtrend. This will be signaled by price action closing markedly below the horizontal area of support/resistance in which it is firmly rooted at present.
***
The above was written by hand.
The above is not investment advice.
I am not a professional analyst or trader.