XAU/USD 02 July 2026 Intraday AnalysisH4 Analysis:
-> Swing: Bullish.
-> Internal: Bearish.
Bias and analysis to remain the same as analysis dated 30 June 2026.
Price did not print bullish CHoCH to indicate bullish pullback phase initiation. Price instead printed a new low followed by a bullish CHoCH
Price is currently trading within and established internal range, however, I will continue to monitor price with respect to depth of pullback.
Intraday expectation:
Price to trade up to either premium of internal 50% EQ, o
Fractal
BTC Update: Selling Pressure Fades at Support🔍 Technical Analysis (H4 Timeframe)
Bullish Signs: On the daily chart, consecutive candlesticks with long lower shadows combined with a Bullish Divergence on the RSI signal that selling momentum is exhausting.
Rebound Potential: If buyers successfully defend the current support zone, we can expect a technical rebound to retest the 61K – 62K resistance area.
⚠️ Key Scenarios to Watch
The Bull Case: The 61K – 62K zone remains a crucial pivot. BTC needs a strong breakout and a daily close above th
XAU/USD 01 July 2026 Intraday AnalysisH4 Analysis:
-> Swing: Bullish.
-> Internal: Bearish.
Bias and analysis to remain the same as analysis dated 30 June 2026.
Price did not print bullish CHoCH to indicate bullish pullback phase initiation. Price instead printed a new low followed by a bullish CHoCH
Price is currently trading within and established internal range, however, I will continue to monitor price with respect to depth of pullback.
Intraday expectation:
Price to trade up to either premium of internal 50% EQ, o
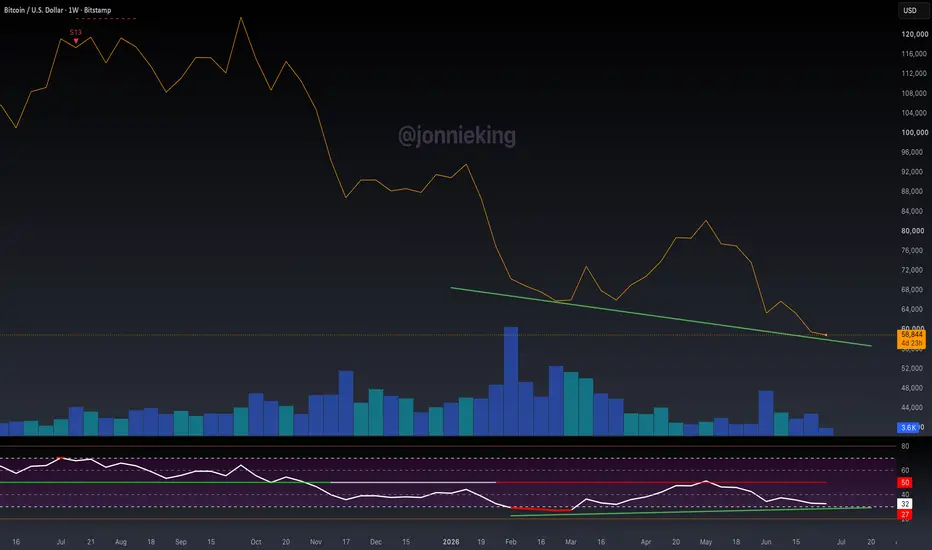
$BTC Very WEAK Bullish Divergence LESSON - Must ReadLately I’ve been seeing a ton of large accounts calling for a
CRYPTOCAP:BTC bottom because of the extremely weak bullish divergence on the Weekly chart.
This means absolutely nothing without confluence from PA, volume and other indicators-- all which are horrendous, such as volume which you can clearly see.
If PA keeps going lower, the bull div goes away, along with this silly bull-slop.
Example:
Low #1: BTC = $65,200 RSI = 27
Low #2 (today): BTC = $58,500 RSI = 32
That's a bullish RSI di
Gold’s Bizarre AdventureWhat in the world is PEPPERSTONE:XAUUSD Gold doing lately? If you’ve been watching the charts since mid-May, you might feel like you’re on a roller coaster where the safety bar is slightly loose. After our last correction ended, Gold has been in a relentless downward grind.
Let’s put on our technical goggles and break down why things are getting weird, why the Bulls are sweating, and where we might be heading next.
📉 The Technical Picture: Riding the ABC Down
Looking at the chart since the m
EQIX | June, 2026 | Continued stock growth- Timeframe: Weekly
- Trade type: Buy stop order
- Price: 1,107.15
- Take Profit: Open
- Stop Loss: 1,049.29 (-5.20 %)
Idea: Long on a breakout above last week's high — bullish momentum continuation.
Entry: Buy stop above last week’s high.
Stop-loss: Below the low of the same candle.
If the weekly candle closes below this level, the trade is invalidated.
Take Profit: Trailing stop following the lows of new weekly candles.
Feel free to like and share your thoughts in the comments! ❤️
XAU/USD 30 June 2026 Intraday AnalysisH4 Analysis:
-> Swing: Bullish.
-> Internal: Bearish.
Price did not print bullish CHoCH to indicate bullish pullback phase initiation. Price instead printed a new low followed by a bullish CHoCH
Price is currently trading within and established internal range, however, I will continue to monitor price with respect to depth of pullback.
Intraday expectation:
Price to trade up to either premium of internal 50% EQ, or H4 demand zone before targeting weak internal low, currently priced a
WHAT QUALCOMM TEACHES CRYPTO ABOUT LOST YEARSThis chart is not only about Qualcomm. It is about technology cycles, timing, psychology, majority opinion, and the brutal difference between being right and being early. Qualcomm went from around $2.50 in October 1998 to around $100 in October 2000. That was not a normal rally. That was a full technology repricing event. The market saw the future, priced the dream, and pushed the asset into a completely different valuation zone.
Then came the hard part. October 2000: $100. October 2020: $100.
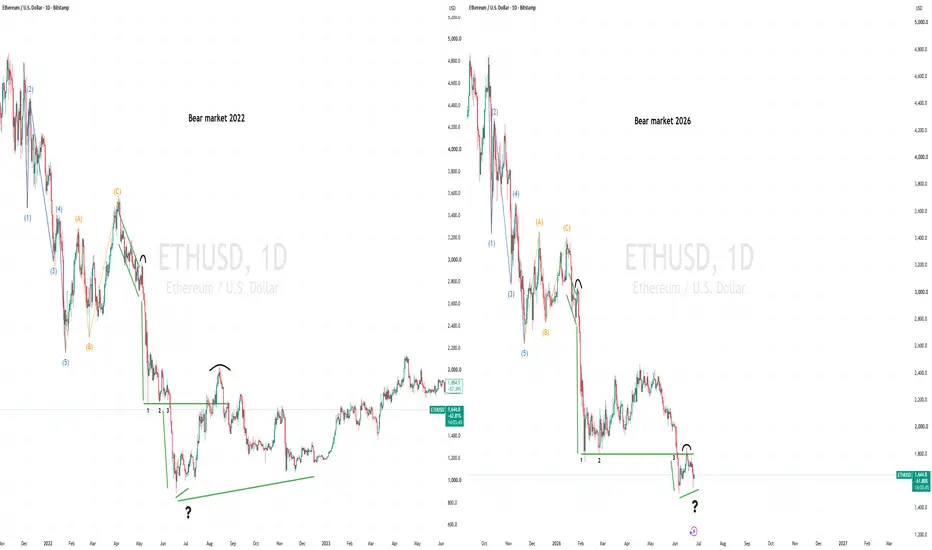
ETH IS BACK WHERE THE LAST REBIRTH BEGIN Everyone is calling Ethereum dead again. Same fear. Same exhaustion. Same structure test.
In 2020, ETH tested this rising base before the market finally understood the reset. Now 2026 is asking the same question.
If this line holds, this is not the end of ETH.
It is the place where disbelief starts turning back into structure.
ETH is weak in the short term, but the larger structure is not dead. Price is testing the rising support line again, RSI is near a historical reset zone, and sentiment is
XAU/USD 29 June 2026 Intraday AnalysisH4 Analysis:
-> Swing: Bullish.
-> Internal: Bearish.
Bias and analysis to remain the same as analysis dated 25 June 2026.
Price has printed according to my analysis dated 15 June 2026 with price subsequently printing a bearish iBOS.
Price is currently trading within an internal high and fractal low. CHoCH positioning is denoted with a blue dotted horizontal line.
Intraday expectation:
Price to print bullish CHoCH to indicate bullish pullback phase initiation.
Note:
Gold remains
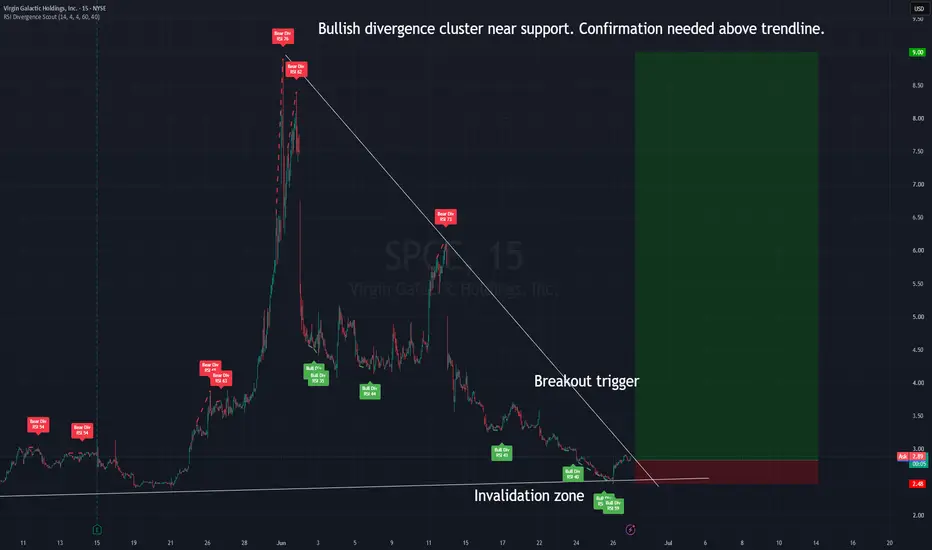
SPCE: Bullish Divergence Near Support — Conditional Long SetupSPCE is showing a possible reversal setup after a long decline from the previous momentum spike.
This is not a confirmed trend reversal yet. The chart is still under a descending structure, so I would treat this as a conditional long setup rather than a blind buy.
What I see on the chart
1. Bullish divergence cluster
Several bullish RSI divergence signals appeared near the lower part of the move.
This means price continued to push lower, but RSI started to show less downside momentum. That
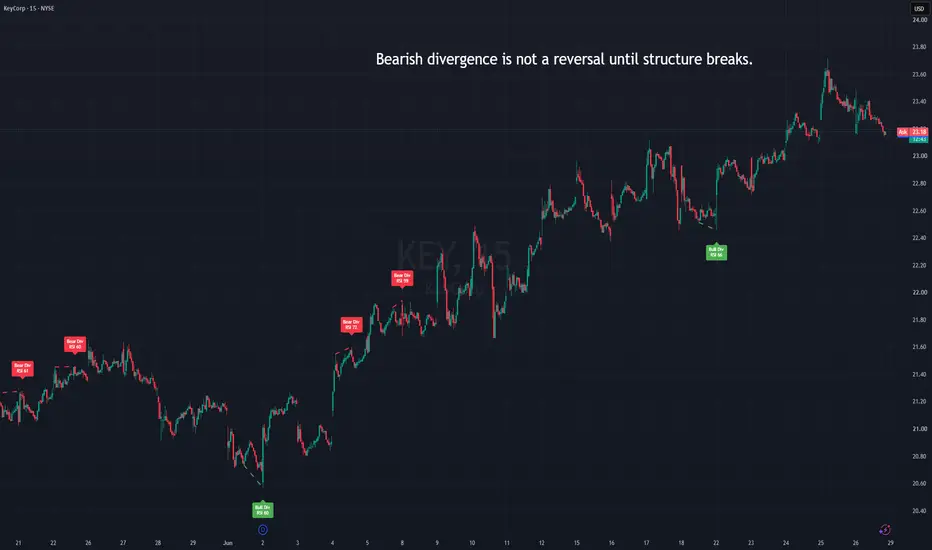
Why RSI Divergence Fails in Strong TrendsRSI divergence is useful, but it is often misunderstood.
Many traders see bearish divergence and immediately expect a reversal. The problem is that divergence does not mean price must reverse. It only means that momentum is no longer confirming the latest price move.
In a strong trend, this can happen several times before price actually changes direction.
What bearish RSI divergence shows
Bearish RSI divergence appears when:
– price makes a higher high
– RSI makes a lower high
This means u
"Cheat Sheet" for Technical Indicators to Succeed in TradingTrading in financial markets can be challenging in the light of multiple trading markets, instruments, assets, and orders that can be executed to make some gains. Also, after analysing the above, success is not guaranteed in the financial market. Most traders try to mitigate the risks and maximise the chances of hitting the jackpot using technical indicators and analysis to look at the market trends differently.
Technical indicators help paint a bigger picture of what is happening in the market
XAU/USD 26 June 2026 Intraday Analysis H4 Analysis:
-> Swing: Bullish.
-> Internal: Bearish.
Bias and analysis to remain the same as yesterday's analysis dated 25 June 2026.
Price has printed according to my analysis dated 15 June 2026 with price subsequently printing a bearish iBOS.
Price is currently trading within an internal high and fractal low. CHoCH positioning is denoted with a blue dotted horizontal line.
Intraday expectation:
Price to print bullish CHoCH to indicate bullish pullback phase initiation.
Note:
DUOL | June, 2026 | The time to go long has come- Timeframe: Weekly
- Trade type: Buy stop order
- Price: 120.30
- Take Profit: Open
- Stop Loss: 104.61 (-13.00 %)
Idea: Long on a breakout above last week's high — bullish momentum continuation.
Entry: Buy stop above last week’s high.
Stop-loss: Below the low of the same candle.
If the weekly candle closes below this level, the trade is invalidated.
Take Profit: Trailing stop following the lows of new weekly candles.
Feel free to like and share your thoughts in the comments! ❤️
XAU/USD 25 June 2026 Intraday AnalysisH4 Analysis:
-> Swing: Bullish.
-> Internal: Bearish.
Price has printed according to my analysis dated 15 June 2026 with price subsequently printing a bearish iBOS.
Price is currently trading within an internal high and fractal low. CHoCH positioning is denoted with a blue dotted horizontal line.
Intraday expectation:
Price to print bullish CHoCH to indicate bullish pullback phase initiation.
Note:
Gold remains volatile as tensions between the US, Israel, and Iran keep safe‑haven
XAU/USD 24 June 2026 Intraday Analysis H4 Analysis:
-> Swing: Bullish.
-> Internal: Bearish.
Analysis and bias to remain the same as analysis dated 15 June 2026.
Price has now printed a bullish CHoCH as per analysis dated 11 June 2026.
Price is now trading within an established internal range.
Intraday expectation:
Price to continue bullish, react at either discount of internal 50% EQ, or H4 demand zone before targeting weak internal low, priced at 4,023.870.
Note:
Gold remains volatile as tensions between the US, Israe
NTES | June, 2026 | Continued stock growth- Timeframe: Weekly
- Trade type: Buy stop order
- Price: 126.00
- Take Profit: Open
- Stop Loss: 118.80 (-5.70 %)
Idea: Long on a breakout above last week's high — bullish momentum continuation.
Entry: Buy stop above last week’s high.
Stop-loss: Below the low of the same candle.
If the weekly candle closes below this level, the trade is invalidated.
Take Profit: Trailing stop following the lows of new weekly candles.
Feel free to like and share your thoughts in the comments! ❤️