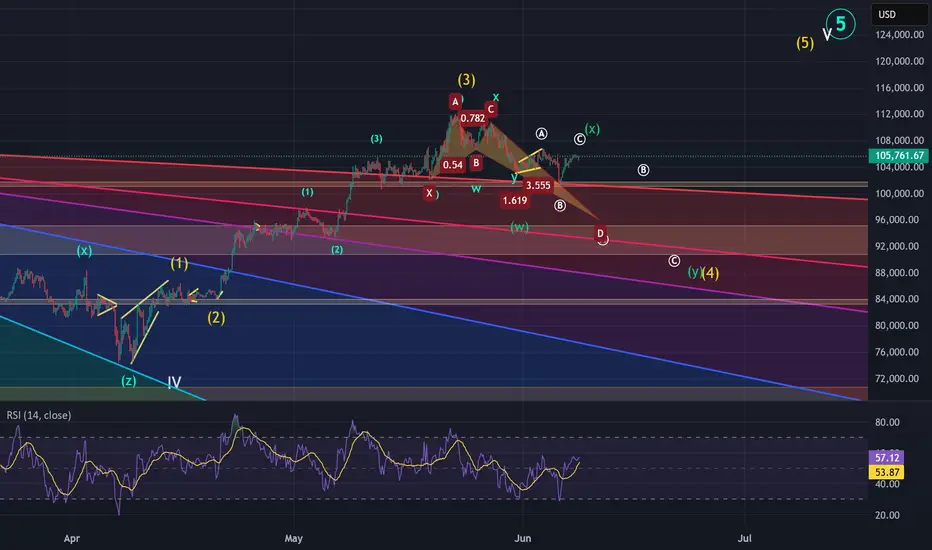
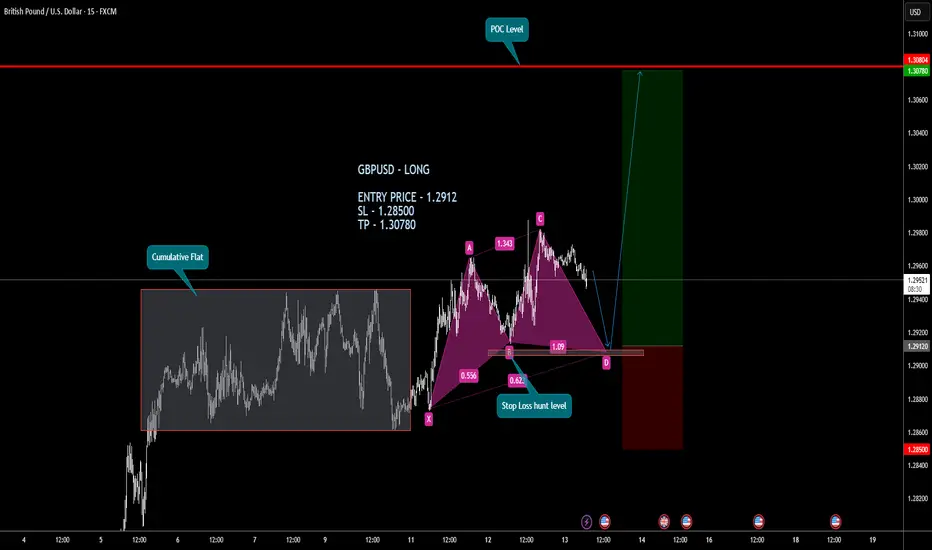
Long
Short
Long
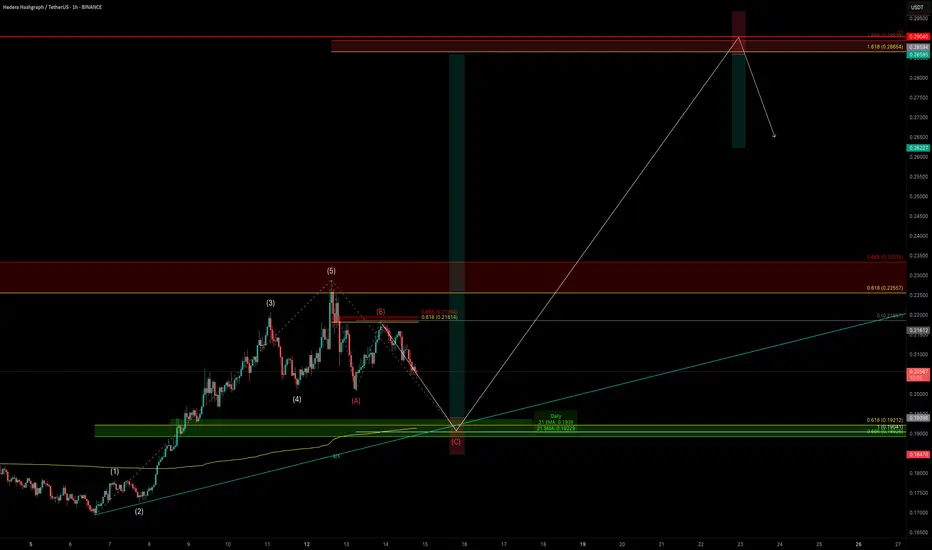
HBAR Masterclass: Fib Precision + ConfluenceHBAR has been a dream to chart lately — beautifully technical, clean reactions, and a strong respect for structure. When a chart follows fibs this precisely, charting becomes fun — like solving a puzzle that pays. You stop forcing trades and start enjoying the process.
Let’s break down where the next high-probability trade setup lies — and why.
Elliott Wave Context
HBAR recently completed a 5-wave impulse structure and is now unfolding a ABC correction:
✅ Wave A: Broke below Wave 4's low
✅ Wave B: Rejected cleanly at the 0.618 retracement of Wave A
🔄 Wave C: Currently unfolding, with price structure hinting at a Head & Shoulders forming to the downside
Interestingly, HBAR has been bouncing between golden ratios like a Fibonacci pinball machine. — reinforcing how well this asset respects technical structure.
🟢 Long Opportunity: The Golden Pocket Zone
By pulling Fibonacci retracement from the entire 5-wave leg (from $0.16941 to $0.22885), we uncover the golden pocket:
0.618 Fib → $0.19212
0.666 Fib → $0.18926
But what really strengthens this zone is the confluence:
📍 21-Day EMA → $0.19361
📍 21-Day SMA → $0.19229
📍 Anchored VWAP from the $0.15396 low → ~$0.19135
📍 4/1 Gann Fan support (if reached between May 15–17)
Together, they form a tight support band between:
🎯 $0.195 – $0.18926
📐 How We Projected the 1.618 Target
Here’s where the magic of planning comes in.
If Wave C finishes within this golden pocket, we can anticipate the next move by applying a trend-based Fibonacci extension. This gives us a realistic projection for the next impulsive move:
📈 1.618 extension lands at → $0.28654
This level also aligns with the yearly level and previous key high — forming an ideal final target
📘 Educational Insight: Why Golden Pockets Matter
In trading, the “golden pocket” — the 0.618-0.666 Fibonacci retracement zone — is often where high-probability reversals take place. It’s a zone where buyers (or sellers) return with conviction after a correction. When this area also aligns with EMAs, anchored VWAPs, Gann levels etc. and previous structure, it becomes more than just a level — it becomes a decision zone.
This is where confluence transforms a trade idea into a trade setup.
🟢 Long Trade Setup:
Entry: Laddered between $0.195 – $0.18926
Stop-Loss: Below $0.185
Take-Profit: $0.28654
R:R: ~10:1
Potential Gain: ~+50%
🔴 Short Setup (If Rejected at Extension):
If price hits $0.28654 and shows exhaustion or bearish reversal patterns (SFP, engulfing candle, volume spike), a short could be considered:
Entry: ~$0.286
Stop-Loss: $0.2967 (better above $0.3)
Target: $0.2622
R:R: ~2:1
HBAR is giving us a textbook case of structure, rhythm, and precision. Whether it’s the golden pocket, the 1.618 extension, or the alignment of multiple tools — this is how clean setups are built.
Set your alerts. Trust the plan. Let the chart come to you.
In trading, silence is a skill — knowing when not to act is as powerful as knowing when to strike.
____________________________________
If you found this helpful, leave a like and comment below! Got requests for the next technical analysis? Let me know.
Long
Long
Short
92% Win Rate Strategy Using Gann’s Planetary LongitudeHave you ever wondered how some traders seem to anticipate market reversals with uncanny precision, almost as if they can see into the future?
Well, what if I told you that the secret doesn’t lie in guesswork or traditional retail indicators, but in the heavens themselves?
Let me walk you through one of the most powerful forecasting tools in Gann's arsenal—the Planetary Longitude Method and how I used it to identify the exact price level from which the market reversed.
The Power of Planetary Time Cycles in Trading
This technique isn’t based on patterns, trendlines, or lagging indicators. It’s rooted in precise planetary time cycles, the same natural laws that govern the movement of celestial bodies.
Gann believed the markets were not chaotic but deeply connected to universal rhythm and planetary motion. According to his planetary longitude method, each planet holds a specific degree of longitude at any given time. These degrees can be directly mapped onto price charts, turning astronomical data into actionable trade setups.
When price meets planetary longitude, something extraordinary happens. These degrees act as invisible support and resistance levels—ones that retail traders never see. They are silent yet powerful markers of change, and because they are rooted in cosmic cycles, they give you a strategic edge in timing your trades.
Why These Degrees Matter
As a trader, what you’re truly looking for is reaction zones, areas where price is likely to pause, reverse, or accelerate. When planetary time and market price converge at a particular degree, it creates what Gann called a "vibrational point", a moment of energetic alignment. These are high-probability zones where you can anticipate market turning points with accuracy.
By tracking the longitudes of key planets, such as the Sun, Moon, Mars, Jupiter, or Saturn—you can identify these critical junctures. Each planet brings its own cycle, its own tempo. For deeper, longer-term reversals, I often rely on the slower-moving planets like Pluto, while for short-term setups, I look at the faster ones like the Moon or Mars.
How I Forecasted the US100 Reversal from 19,384.6
Now, let’s get practical.
In this recent example, I was closely watching the US100 index, where I anticipated a potential reversal around the level of 19,384.6. Was this just another support/resistance zone? Absolutely not.
Here’s how I arrived at this precise level using Gann’s Planetary Longitude Technique:
First, I took the price level of 19,384.6 and converted it into degrees. To do this, I simply subtracted 360 repeatedly from the price until I arrived at a number less than 360. This process is based on the 360° circle of the zodiac—once the price cycles through the full circle multiple times, what's left is the vibrational degree associated with that price. In this case, the price level of 19,384.6 converted to approximately 304.6°.
Then, I checked the planetary position of Pluto which was 303.55° in longitude.
This created a near-perfect alignment between Pluto’s time cycle and the vibrational price degree. When planetary time meets price, it forms a cosmic convergence zone—a point of natural balance where the market is highly likely to react. So, I wasn’t just guessing—I was waiting for that moment of planetary resonance.
And as the chart clearly shows, the market reacted sharply the moment it touched 19,384.6, confirming the sensitivity of this degree. It wasn’t random. It was a harmonic response, echoing the laws of cosmic vibration that Gann so strongly emphasized.
This is a real-time example of how combining planetary time with price geometry can give you a decisive trading edge, especially in forecasting major turning points.
Why This Method Works
The market respects these planetary degrees not because of mysticism, but because it moves in cycles—natural cycles that repeat. The alignment of price with planetary longitude often marks pivot points in the market.
And this method doesn’t just help with identifying reversals. It also enhances your entry and exit timing, allowing you to trade with confidence, knowing you're aligned with the larger cosmic structure that influences all things—including financial markets.
Final Thoughts
This is just one example of how planetary geometry, when applied correctly, can lead to powerful trade setups. While Pluto offers long-term signals, don’t underestimate the value of the Moon, Mars, or Jupiter for shorter timeframes. The market dances to their rhythm too.
And once you learn to listen to that rhythm, you'll never look at price the same way again.
Short
Short
Short
Short
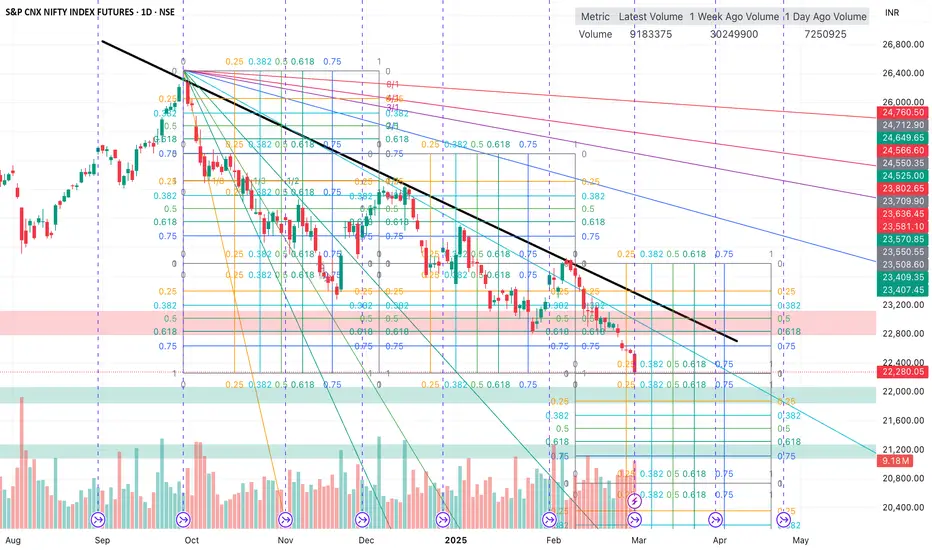
Nifty Future Analysis
1. Price Action & Trend Analysis
The NIFTY Futures has been in a strong downtrend since October 2024, with lower highs and lower lows.
A black downward trendline is clearly acting as a dynamic resistance, rejecting price multiple times.
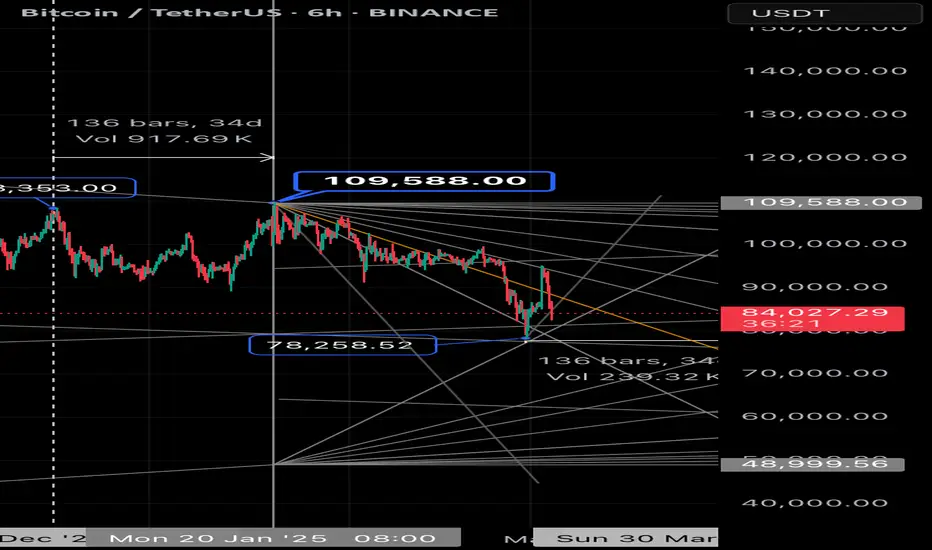
2. Gann Fan Analysis:
The Gann fan lines are visible, providing different angles of support and resistance.
The key Gann angles to watch:
1/1 Line (Steep Downtrend Line): The price is trending below this, indicating a strong bearish trend.
2/1 and 3/1 Lines: These are acting as resistance levels, confirming the selling pressure.
If price moves above the 1/1 Gann line, a potential reversal could be seen, but as of now, it remains below the bearish zone.
3. Volume & Market Sentiment
Latest Volume: 9.18M, which is relatively lower compared to 1 week ago (30.2M) but higher than the previous day (7.25M).
This suggests decreasing participation in the downtrend, which could indicate potential consolidation before the next move.
4. Key Support & Resistance Levels
Support Zones:
22,200-22,400: Current support based on Fibonacci & previous price action.
21,600-21,800: Next strong demand zone if selling continues.
20,800-21,000: Long-term support (historical demand zone).
Resistance Zones:
23,407-23,500: First resistance (Fib 0.382 & Gann fan level).
23,800-24,000: Major resistance (Fib 0.618, Gann fan rejection area).
24,500-24,760: Strongest resistance (Fib 0.75 + supply zone).
5. Conclusion & Trading Strategy
Bearish Bias: The market remains in a strong downtrend.
Possible Short Setup: If price breaks below 22,200, the next target would be 21,600.
Bullish Reversal Above 23,500: A move above this level could shift momentum toward 23,800-24,000.
Unlocking Market Secrets with Sacred GeometryIn this post we’ll dive into sacred geometry and how it is used in trading. Geometry isn’t just shapes—it’s the foundation of nature, architecture, and even trading.
From Pythagoras to Gann, great minds have studied these patterns to unlock hidden market signals. Let’s break down these powerful concepts and see how we can apply them to our own strategies!
First, take a look at this picture…
What you’re looking at here is a life-size oil portrait painting that’s displayed in the Manly P. Hall Institute of Metaphysics in Los Angeles, up on Mulholland Drive. This painting was done in 1929 by an artist named Augustus Knapp, and it’s a fascinating representation of one of the greatest minds in history named Pythagoras.
Now, here’s something interesting. There are no actual portraits of Pythagoras from his time. No real images of him exist just written descriptions passed down through the ages. So, this painting is a compilation of those descriptions, a vision of what they believed Pythagoras might have looked like based on historical accounts. But beyond the visual, what really matters is what this man achieved.
Pythagoras lived in 653 BC over 2,500 years ago and his contributions to mathematics, science, and even philosophy were so far ahead of his time that people today still struggle to comprehend how he knew what he did.
If you look closely at the painting, you’ll see a globe to the left-hand side. This is where things get really fascinating. Pythagoras not only knew that the Earth was round long before it became commonly accepted he also knew that the distance between the Earth and the Moon was approximately 250,000 miles. Let that sink in. Over 2,500 years ago, without modern telescopes, satellites, or space exploration, he was able to determine this astonishingly accurate measurement. How did he do it? That remains a mystery.
But his genius didn’t stop there. Pythagoras was the first person in recorded history to use the square root of numbers, laying the foundation for many of the mathematical principles we still use today. His contributions to geometry are legendary, with the Pythagorean Theorem being one of the most fundamental concepts in mathematics. He was able to see numbers not just as mere figures but as an intrinsic part of the universe, something deeply connected to music, nature, and even human existence.
Albert Einstein himself once said that there was God, there was man, and in between, there was Pythagoras. That’s how brilliant he was. Einstein, one of the greatest minds of the modern era, placed him in a category beyond ordinary human intellect. Many scholars and historians consider Pythagoras one of the four or five most intelligent people to have ever walked the Earth.
Now, I want you to pay close attention to something else in this painting. If you look at Pythagoras’ right hand, you’ll notice he’s holding a pyramid above his head. This is extremely significant. The pyramid was not just a symbol of ancient Egyptian architecture; it represented knowledge, sacred geometry, and the hidden mysteries of the universe. Pythagoras believed that the structure of the universe was based on mathematical harmony, and the pyramid was a reflection of this divine order. The way he holds it above his head symbolizes his deep understanding of higher knowledge, knowledge that very few people of his time and even in our time could comprehend.
TradingView
Pythagoras didn’t just study numbers, he studied their meaning, their vibrations, their connection to music, and how they formed the very fabric of reality. His school, which was more of a secret society, was devoted to exploring these truths, and his students followed strict codes of discipline, silence, and dedication to learning. Some say his teachings went beyond what we call science today, delving into the realms of metaphysics and spirituality.
So, when we talk about Pythagoras, we’re not just talking about a mathematician, we’re talking about a man who saw the universe in a way that very few have. He understood numbers not just as tools for calculation but as the building blocks of existence itself. This painting is not just a historical representation; it is a doorway into understanding one of the most profound thinkers in human history.
Alright, let's dive into something incredibly interesting, especially if you have an appreciation for Italian geniuses. We're talking about Leonardo da Vinci's division ratio and proportions of the human body this is pretty fascinating stuff.
If you look closely at da Vinci's sketches, you’ll notice that the ratios and proportions of the human body, like the measurements of bones, joints, and limbs, are not random. There’s an underlying order that we can see across the body. He was the first to really study and break down how the human body relates in terms of proportions, especially with the numbers that make up these proportions. For example, he measured everything from your radius to your phalanges, to the femur and the tibia. These are all linked in a very specific way. From the head to the pubic crest, these measurements fall into the 0.618 ratio, which is one of the most famous numbers in nature.
Now, let's take a look at why this is so significant. This isn’t just a random number—it’s actually tied to something we call the Golden Ratio or Phi, which is 0.618. It’s a ratio that appears in all kinds of natural patterns, from the spirals of seashells to the growth patterns of plants. Da Vinci was keen on observing these relationships, and he recorded them in his Codex, a collection of his writings and drawings.
Let me tell you a Fun fact, Bill Gates bought this Codex in 1982 for $20 million, and today, it’s housed in the Smithsonian Institute, traveling the world half the year and staying in Washington for the rest. Da Vinci was ahead of his time, so much so that when he wrote about this ratio, he didn’t just write it down plainly. In fact, he wrote everything in a mirror image, so you had to read it by holding the paper up to a mirror. Why? Well, a lot of his work was coded, not necessarily because he didn’t want people to understand it, but because he didn’t want to give away his discoveries easily. He was mysterious like that!
Now, let’s zoom out and look at something even more mind-blowing. If you go back to ancient times—way before da Vinci’s time—you’ll see that the Egyptians were using this same ratio. Take the pyramids for instance. The dimensions of the human body, from the head to the feet, also follow this pattern of 3, 5, 8, 13, 21... all culminating in the golden ratio of 0.618. The Egyptians were just as obsessed with these measurements and proportions, and you’ll find this same 0.618 showing up in their designs and architecture, too. It’s something that connects us to the very ancient foundations of human culture and knowledge.
What’s even crazier is that this ratio holds up in medical science. If your body proportions are off by more than 5% from the standard, it actually gets classified under conditions like dwarfism or other abnormalities. So, this ratio is so accurate that it defines what the "ideal" proportions of the human body should be. When you study these numbers and ratios, you realize just how mathematically perfect the human body is designed—at least in theory!
Now let’s take this to a different dimension, The DNA. The very structure of DNA follows this same fibonacci spiral, the same pattern of proportions that we see in the human body. The DNA helix is a perfect example of the golden ratio at play in biology. So when you look at the genetic code, you’re actually looking at the same patterns that show up in the pyramids, the human body, and even the very spiral shape that defines life at its most fundamental level.
And speaking of DNA, there’s an interesting tidbit related to Italy. This is a bit of trivia: There has never been a murder conviction in Italy because of the uniformity of DNA in Italians. Everyone shares such a similar genetic code that it’s almost impossible to distinguish one person from another in certain cases. Fascinating, right?
Alright, now that we’ve explored these mind-blowing connections between da Vinci’s proportions, the golden ratio, and DNA, let’s bring it back to the market and how we can use these ratios to help us with trading.
Here’s what you need to know, The same ratios that define proportions in nature can be applied to price movements in the market. For example, in the AUDUSD pair, you can use these numbers to identify key levels where price may reverse. Let’s break this down a bit further. If you look at the market's movements on a Weekly chart, you might not notice anything special at first. But when you start applying the 618 retracement, 786 retracement, or 161.8% extension, suddenly these numbers start lining up with the price action.
As we’ve seen, the same sacred geometry and mathematical principles that govern nature, architecture, and even DNA also play a crucial role in the financial markets. From Pythagoras to da Vinci, these hidden patterns have guided some of the greatest minds in history—and now, they can guide us in trading.
The market, like the universe, moves in harmony with these timeless patterns.
Keep studying, keep observing, and most importantly—keep refining your strategy. The more you align with these natural cycles, the better your trading decisions will become. See you in the next post, where we’ll continue uncovering the secrets of market geometry!
Long
Long
Short
Short
Long