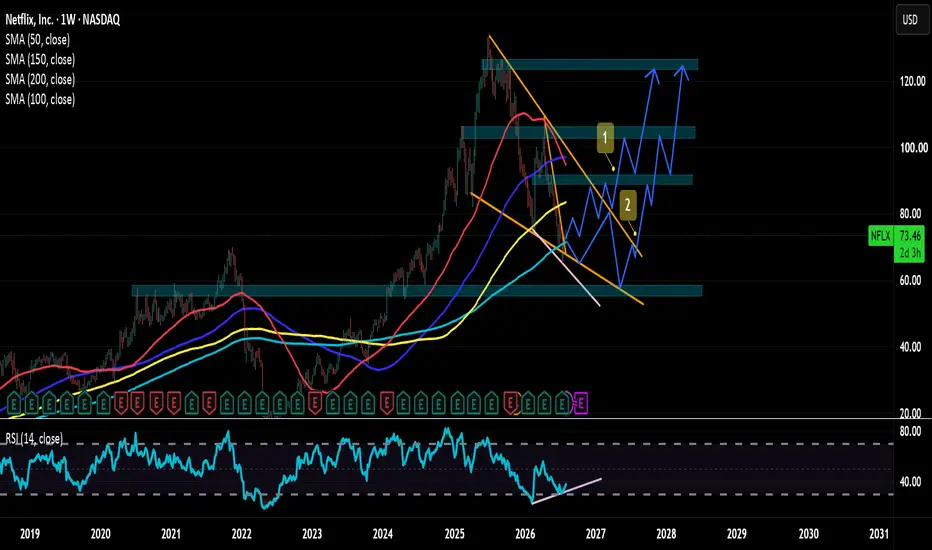
NFLX: 40% Discount + RSI Divergence = Massive Reversal SetupNFLX Weekly Reversal: Path to $123 📈
Netflix (NFLX): Bottom Is In!
NFLX: 200 SMA Bounce & Fundamental Discount.
📌 Market Context & Technical Breakdown
After a prolonged corrective phase, Netflix (NFLX) is showing strong technical and fundamental signs that its long-term bearish trend is near completion. The price action on the weekly chart is aligning with multiple confluence factors pointing toward a major bullish setup:
1. Rebound from 200 SMA & Wedge Bottom
Key Moving Average Support: The
Investing
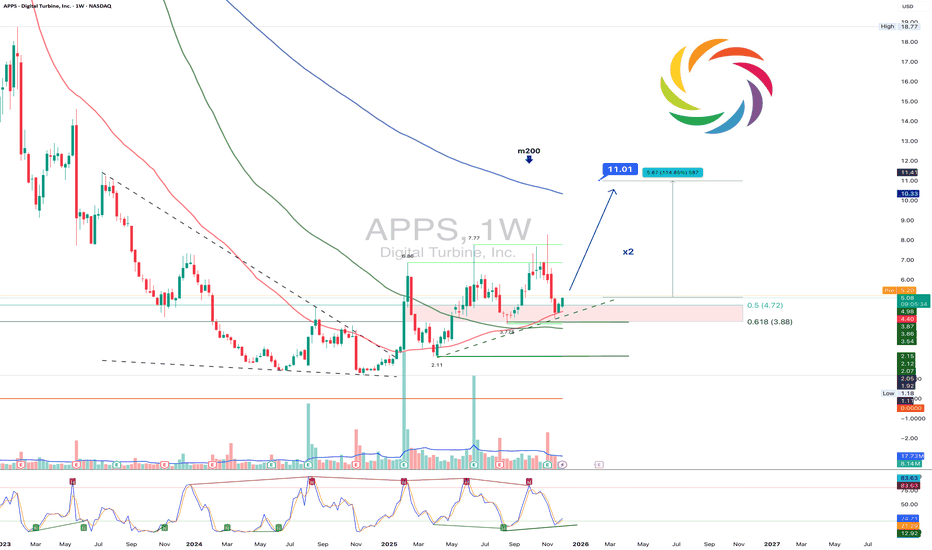
APPS 1W: warms up the stage again or is this only a teaserAPPS is trading at 5.08 and holding above the demand zone between 3.88 and 4.72. These levels correspond with Fibonacci 0.5 and 0.618 and continue to attract buyers. A golden cross between ma50 and ma100 has formed and the ma200 above creates a clean technical structure for a potential breakout. The chart suggests a move toward 7.77 while a confirmed break above it may open the way toward 11.01.
The fundamental picture has strengthened. Revenue grew 18 percent in the latest quarter and adjuste
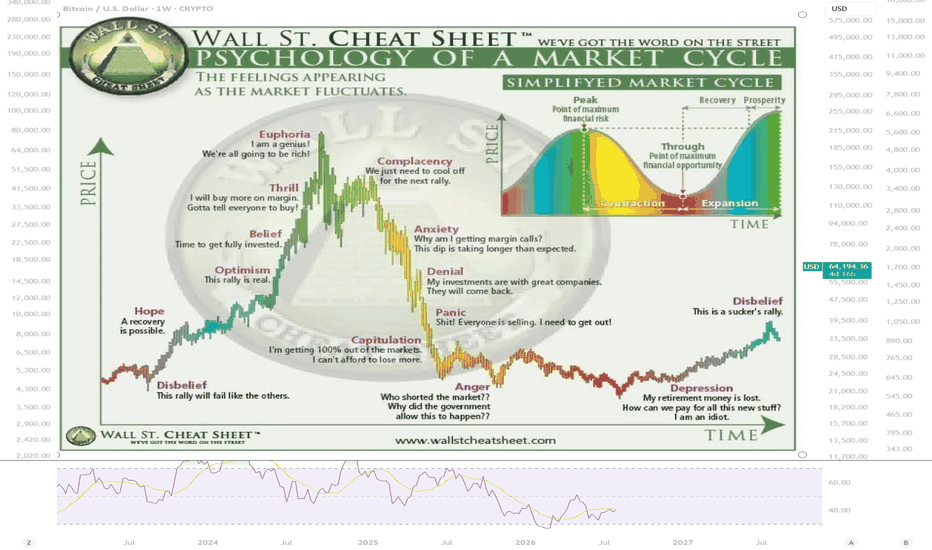
The Psychology Behind Every Market CycleMost people think markets are driven by news. They're not. News changes every day. Market psychology doesn't.
For more than a century, every major financial bubble has followed almost the exact same emotional pattern. Different assets. Different headlines. The same human behavior.
Understanding this cycle is one of the biggest advantages any investor can have.
Stage 1 — Optimism 🚀
A new trend begins. Prices start rising, but most people don't believe it yet. Investors tell themselves:"Mayb
Why Markets Leave FootprintsEvery move in the market leaves behind evidence.
Most traders see only the final destination the candle that broke out, the trend that accelerated, or the reversal that caught everyone by surprise. But experienced traders know that these moves rarely appear out of nowhere. Long before price reaches its destination, the market begins leaving subtle clues for those willing to look closely.
These clues are what I like to call the market's "footprints"
A footprint isn't a single indicator or a ma
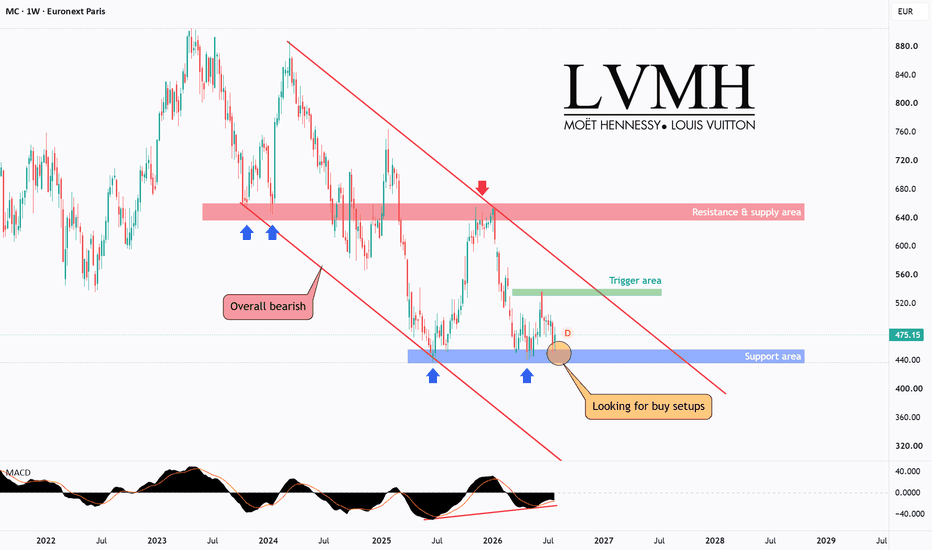
MC - Support in Focus Within the Broader Downtrend!MC (LVMH Moët Hennessy Louis Vuitton SE) is the world's largest luxury goods company, with a portfolio of globally recognized brands across fashion, jewelry, cosmetics, wines, and spirits. The stock is widely followed as a benchmark for the global luxury sector.
From a technical perspective, MC remains overall bearish, continuing to trade inside the red descending channel. Price is now testing a major support area that has produced multiple bullish reactions in recent months, making it an impo
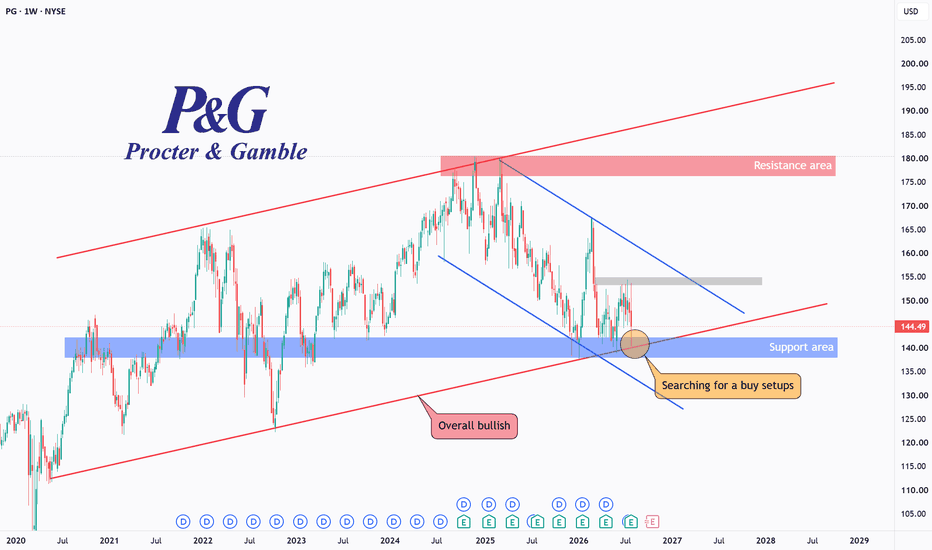
PG - Long-Term Uptrend Faces an Important Test!PG (Procter & Gamble Co.) is one of the world's largest consumer goods companies, with a portfolio of well-known brands across household, personal care, and health products. The company is widely recognized for its stable business model and long history of consistent dividend payments.
From a technical perspective, PG remains overall bullish, continuing to trade inside the red ascending channel that has guided the long-term trend. Price is currently in a corrective phase and is testing the low
S&P 500 Daily Chart Analysis For Week of July 31, 2026Technical Analysis and Outlook:
During this week's trading session, the S&P 500 Index moved lower as it aimed for the completed Inner Index Dip at 7,295. Subsequently, a robust rebound occurred, allowing the index to reach our Mean Support level of 7,510.
This development indicates that the current Active Retracement is susceptible to correction, with a likely target of the Mean Support level at 7,413.
On the upside, there exists the potential for a "dump-and-pump" scenario, which may result
EUR/USD Daily Chart Analysis For Week of July 31, 2026Technical Analysis and Outlook:
In last week’s Eurodollar trading session, the currency continued its upward movement from the Mean Support level of 1.137 and the Key Support level of 1.135. It is currently positioned just below the Mean Resistance at 1.156.
The momentum behind this upward trend suggests that it will continue in its current rebound direction, with the main objective of targeting the Mean Resistance at 1.156 and the Key Resistance at 1.161.
In the event of a downward price act
Bitcoin(BTC/USD) Daily Chart Analysis For Week of July 31, 2026Technical Analysis and Outlook:
This week's trading session for Bitcoin showed continuous price fluctuations, resulting in a downside breakdown and reaching the Mean Support level of $62,300.
This price action suggests a possible further decline toward the Mean Support levels of $61,500 and $60,100, with a chance of retesting the Key Support level at $58,600 and completing the Inner Coin Dip marked at $58,500.
On the upside, Bitcoin is foreseen to rebound toward the Mean Resistance level of $
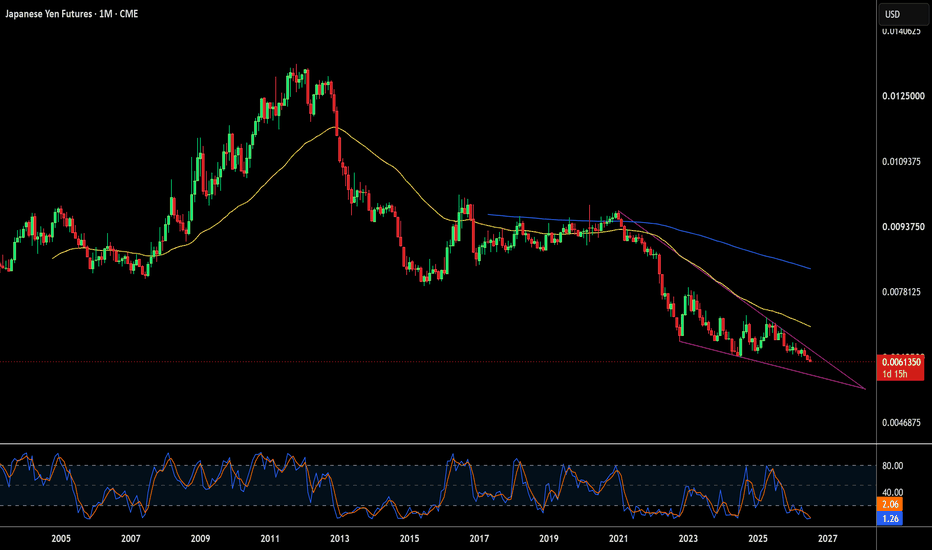
Will the Yen Reversal Crash Global Markets?The Macroeconomic Earthquake
The global economy faces an unprecedented macroeconomic shock. The Bank of Japan (BOJ) is drastically shifting its monetary policy. Japan holds over 200% debt-to-GDP. For three decades, the country maintained zero interest rates, fueling the massive yen carry trade. Investors borrowed cheap yen to buy high-yielding global assets. Now, inflation has finally hit the Japanese economy. The BOJ must raise interest rates to defend its currency. Meanwhile, the U.S. Federal
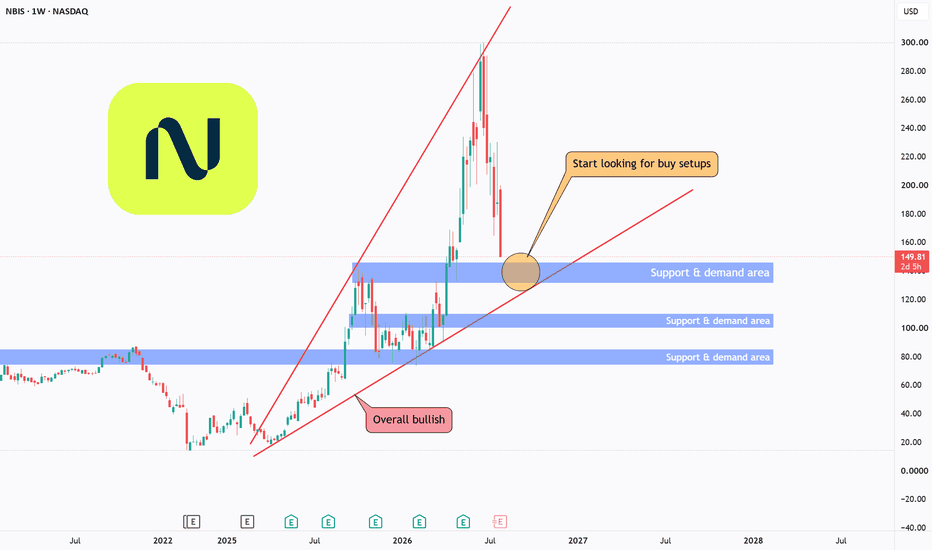
NBIS - Key Support Could Revive the Uptrend!NBIS (Nebius Group N.V.) is a technology company focused on AI infrastructure, cloud computing, and digital services. As demand for artificial intelligence continues to grow, the company has attracted increasing attention from investors seeking exposure to the AI sector.
From a technical perspective, NBIS remains overall bullish, continuing to trade inside a long-term ascending broadening wedge. Despite the recent sharp pullback, the broader market structure remains intact, with price continui
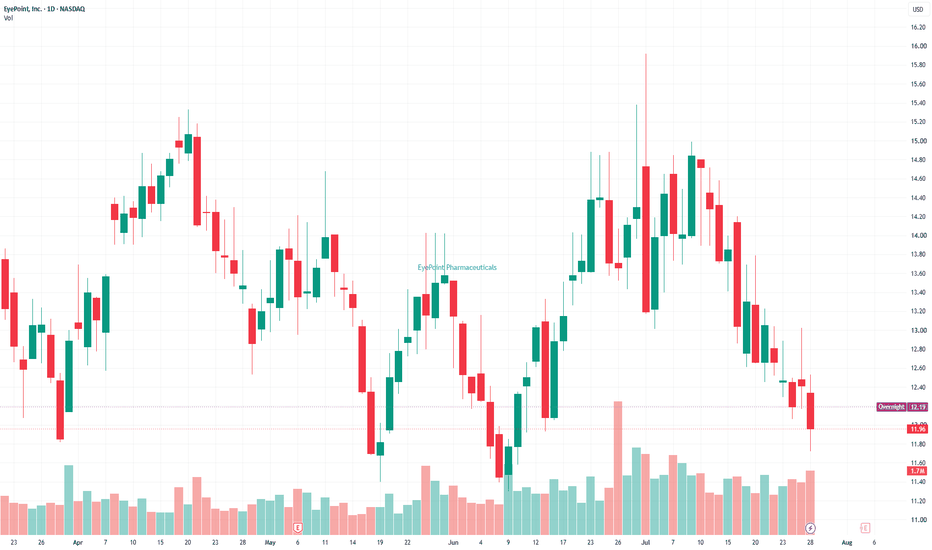
EyePoint Pharmaceuticals: LUGANO Readout Could Unlock 59% UpsideTicker: #EYPT
Price as of 29.07.2026: $11.96
Price target: $19.00
Stop-loss: $10.90
Rating: Buy
Risk: High
Time horizon: Two months
Investment thesis
The Phase III LUGANO readout, expected in mid-2026, will be a defining event for DURAVYU’s regulatory outlook in wet age-related macular degeneration, or wAMD.
Based on encouraging results from earlier trials, we expect the LUGANO data to support DURAVYU’s path towards regulatory approval. DURAVYU is the primary driver of EyePoint Pharmaceut
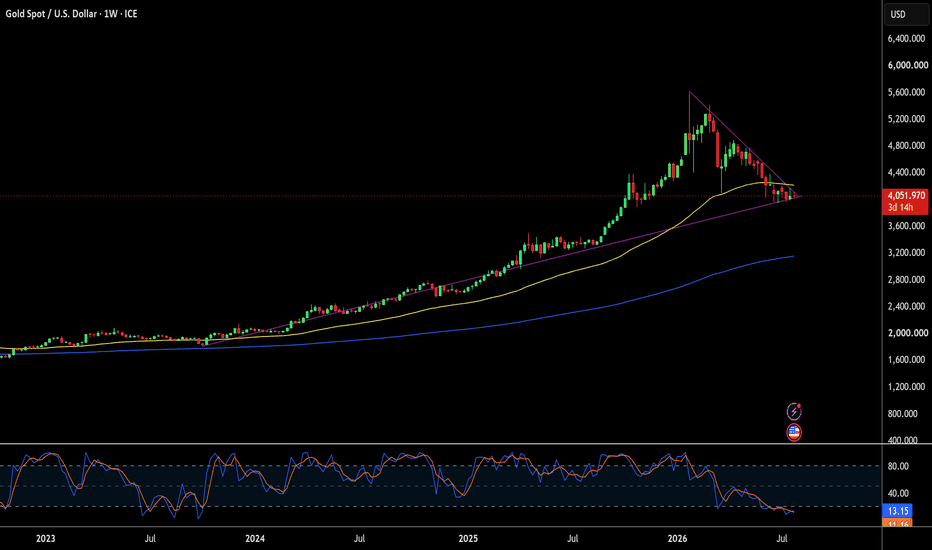
Is Gold's $5,200 Target Still Realistic in 2026?Macroeconomic Volatility and Price Consolidation
Gold spot prices consolidate near $4,080 per ounce following a sharp pullback from earlier highs. Wall Street giant UBS maintains a bullish target of $5,200 per ounce by mid-2027. Near-term risks lean downward as the Federal Reserve holds rates steady with a hawkish bias, and markets now price meaningful odds of a hike rather than a cut later this year. Rising US Treasury yields create short-term friction for non-yielding assets like precious me
Are Soybean Futures the Ultimate Climate Hedge?Weather Volatility and Market Swings
Soybean futures markets are experiencing severe price volatility in mid-2026. Sizzling Midwest heatwaves routinely stoke fear across Chicago Board of Trade trading desks. November soybean contracts recently hit two-year highs near $12.50 per bushel. However, shifting rain forecasts quickly trigger sharp sell-offs across agricultural markets. Speculative funds aggressively manage net long positions in response to weekly crop reports. Crucially, crude oil pric
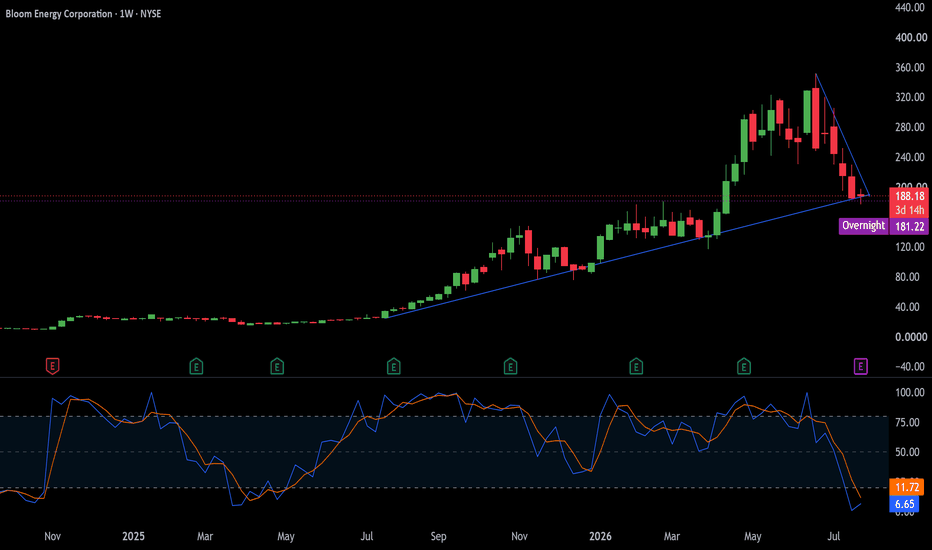
Is Bloom Energy the Ultimate AI Power Play?Q2 Earnings Anticipation
Investors eagerly await Bloom Energy's Q2 earnings report on Tuesday, July 28, 2026. The market anticipates clarity following a volatile quarter. Record Q1 revenue raised the full-year growth outlook to 80 percent. However, shares recently swung wildly. A massive $1.7 billion AI power deal triggered abrupt profit-taking. A short-seller dispute also tested investor confidence. Amid the financial noise, true value lies in the science. Bloom’s proprietary technology and ro
A Steady Food Company with Room for Long-Term Growth AheadAbout Redoubling
Redoubling is my own research project, which is designed to answer the following question: How long will it take me to double my capital? Each article will focus on a different company that I've added to my model portfolio. I'll use the close price of the last daily candle on the day the article is published as the trade price. I'll make all my decisions based on fundamental analysis. Furthermore, I'm not going to use leverage in my calculations, but I'll reduce my capital b
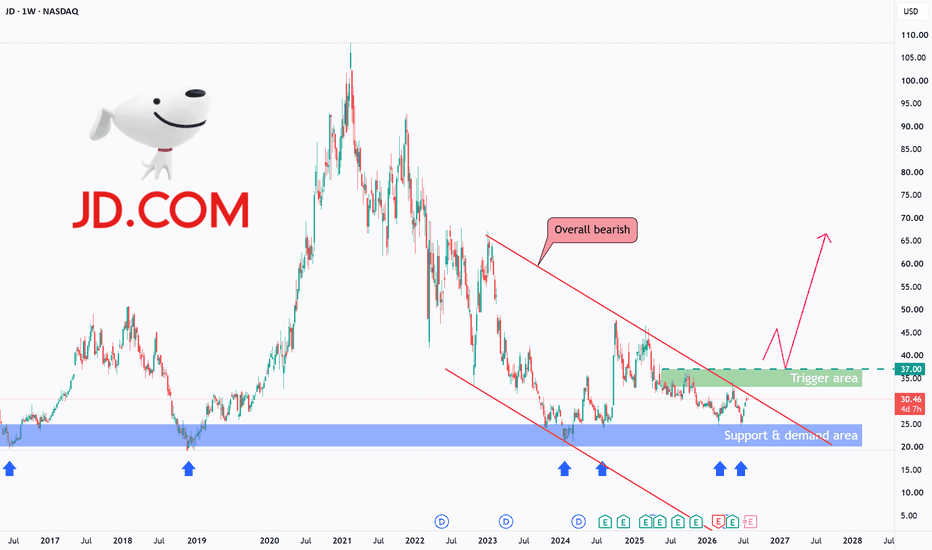
JD - Trend Reversal or Bearish Continuation?JD (JD.com, Inc.) is one of China's largest e-commerce companies, offering a wide range of products through its online retail platform. The company is widely followed by investors looking for exposure to China's consumer and technology sectors.
From a technical perspective, JD remains overall bearish, continuing to trade inside the red descending channel. At the same time, price is holding near a major support and demand area, creating an increasingly important technical region as the distance
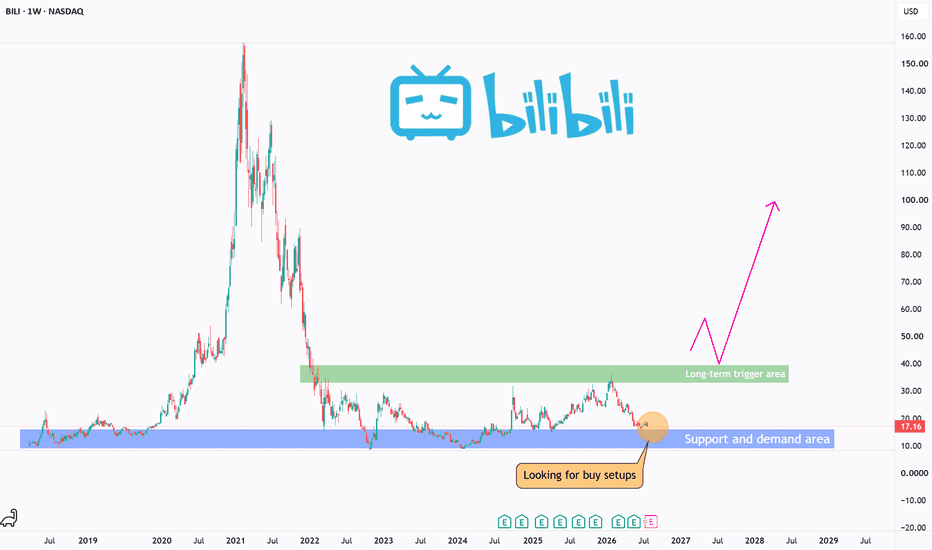
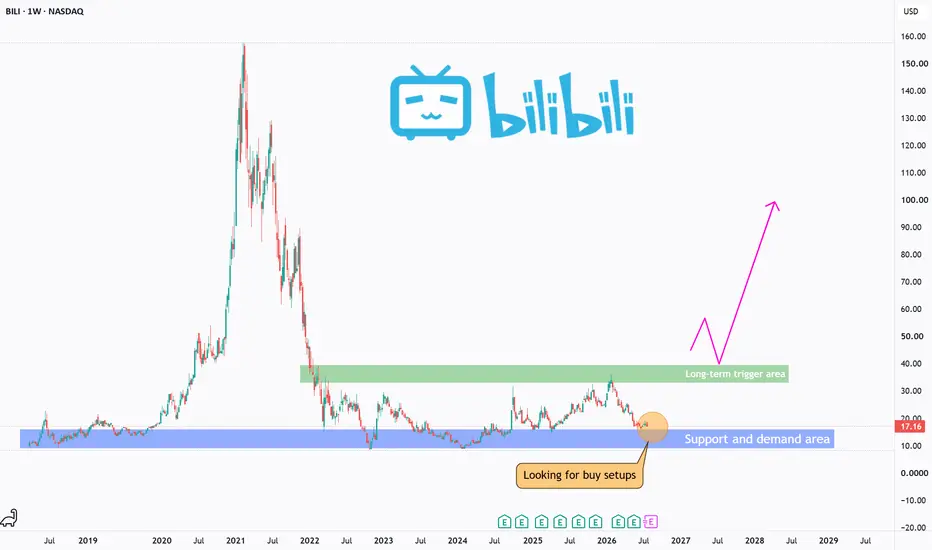
BILI - Can This Long-Term Base Fuel the Next Rally?BILI is one of China's leading online entertainment platforms, offering video streaming, gaming, animation, and community-driven content. The company has become a well-known growth stock, particularly among investors seeking exposure to China's digital media sector.
From a technical perspective, BILI experienced a powerful bullish rally between 2020 and 2021, reaching a new all-time high before entering a prolonged bearish phase that erased a large portion of those gains.
Since 2022, price ha
SOX Time@Mode #1: The Speedlines Cross Friday at 12,424.Everyone called the top in semiconductors last month. On my own timeframes, only one of them agreed.
The daily turned down. The weekly and the monthly are both still bullish. That is the whole disagreement, and the chart picks a side this week.
Look at the two panes. On the monthly, the advance off the April 2025 low is intact and the structure has not broken. On the daily, the selloff printed a drawdown north of 20% off the June high, and then the low bounced off the uptrend speedline rather
S&P 500 Daily Chart Analysis For Week of July 24, 2026Technical Analysis and Outlook:
This week, the S&P 500 Index exhibited erratic movements in its trading activity. It initially rebounded strongly from the Mean Support level of 7,440, but then it quickly dropped, settling at a new Mean Support level of 7,376.
This suggests that the current Active Retracement is primarily influencing the market this upcoming week, indicating a likely retest of the 7,376 support and a revisit to the completed Inner Index Dip at 7,295.
On the upside, there's a
EUR/USD Daily Chart Analysis For Week of July 24, 2026Technical Analysis and Outlook:
In last week's Eurodollar trading session, the currency continued its downward movement from the completed In-Force Retracement, marked at the Mean Resistance level of 1.147, and is currently resting at the Mean Support level of 1.137.
The momentum behind this downward trend suggests that it will continue the In-Force Retracement trend, with the main objective to retest the completed Inner Currency Dip at 1.133, via Key Support at 1.135.
On the upward trajector
Bitcoin(BTC/USD) Daily Chart Analysis For Week of July 24, 2026Technical Analysis and Outlook:
In the Bitcoin trading session of the previous week, the cryptocurrency sustained its upward trajectory, reaching a Key Resistance level of $66,700 before rappelling to the Mean Support level of $63,900.
This movement establishes a potential decline toward the Mean Support levels of $62,300 and $60,500, with the possibility of retesting the completed Inner Coin Dip marked at $58,500.
Conversely, on the upside, it is anticipated that Bitcoin will rebound toward
The Yield–Dollar–Yen Chain: A Macro Correlation Framework & Forw
From my experience in trading, I have found that a handful of simple inter-market correlations can consistently surface directional trade ideas that would otherwise go unnoticed on a single chart. The key concept is straightforward: markets do not trade in isolation. Each asset class exerts gravitational pull on another, and understanding those linkages is, in my view, one of the more under utilised edges available to retail traders.
That said, an important caveat: correlation strength is not
CL1! Analysis Confirmation - weeks of predictions + new rangesThe Fibonacci grid did its job.
The 61.8% level at $74.38 was the first pause on the way down.
The 78.6% zone near $65.78 was the real floor.
Price found it, turned, and has rallied 37% in three weeks.
But here's the thing: this is almost entirely a geopolitical trade.
Every dollar of this rally represents fear about supply disruption, not genuine demand growth.
The IEA was still projecting a 3.7 million bpd global surplus heading into July.
The fundamentals below the geopolitical lay