Nasdaq Head and Shoulders with EVENING STAR IT'S OVER📋 NQ TRADE PLAN — TUE MAY 12, 2026
Current: 29,290 (London KZ, post-overnight bear thrust)
24h Range: 29,227 ↔ 29,479 (252pt — wide)
Bias going in: BEARISH structural, bull bounces tradeable
🗺️ KEY LEVELS
Zone Price Type
Strong resistance 29,500 Round number
Resistance 29,479-80 Yesterday RTH BSL (4× rejected)
Resistance 29,455 ETH bounce high
Pivot 29,400-410 OB / failed RTH pivot
Major flip 29,377 Yesterday RTH SSL → now resistance
Mid 29,300 Round / current chop center
Local low 29,271-79 Pre-market range low
Major support 29,227 Overnight ETH SSL low
Target 29,200 Round / next liquidity
Stretch 29,150 Bear extension target
🎯 PRIMARY SETUPS (NY AM KZ 08:30-11:00 CT)
🔴 SHORT (Higher prob) — at 29,377-29,400
Entry: retest of broken SSL 29,377-29,400 (resistance flip)
SL: > 29,415 (above OB)
T1: 29,300 (+77pt)
T2: 29,260 (+117pt) = 1:3.4 R/R ✅ mandate met
T3: 29,227 SSL (+150pt)
Trigger: sweep + bearish reaction (rejection wick, lower-tf BoS)
🟢 LONG (Lower prob) — at 29,227-29,250
Entry: sweep + reclaim of 29,227 ETH SSL
SL: < 29,210 (below SSL by 17pt)
T1: 29,300 (+50pt)
T2: 29,377 (+127pt) = 1:3+ R/R ✅ mandate met
T3: 29,400-410
Trigger: V-recovery wick + bull spring on vol > 4k (HPT-13 pattern)
⏰ KILLZONE GAME PLAN
Time (CT) Window Plan
02:00-05:00 London KZ Already active — bear bias, watch < 29,265 break
07:00-08:30 Pre-NY Setup zone — wait, don't trade
08:30-09:30 NY AM open PRIME — wait first 15min for direction, then engage
09:30-11:00 NY AM core Primary setups, full size
11:00-13:30 Lunch Stand down, chop
13:30-15:00 NY PM KZ Secondary, smaller size
🚫 INVALIDATION / SKIP RULES
No trade if vol < 1.5k on 5m bar at trigger
No chase if price > 15pt extended from level
Skip if NY AM opens > 29,400 (range breakdown invalid → re-evaluate)
Skip if NY AM gap-down opens < 29,227 (SSL already swept overnight, no edge left)
Hard stop: -50pt session loss → walk away
📊 SCENARIOS
A. Bear continuation (60%): Open mid-range 29,290-29,330 → fade to 29,260 → break SSL 29,227 → flush to 29,150
B. Mean reversion (30%): SSL 29,227 swept clean → V-recovery → target 29,377 retest
C. Chop range (10%): Stuck 29,260-29,377 all day, no edge
🎲 EXECUTION CHECKLIST
✅ Wait for NY AM open (08:30 CT)
✅ Check first 15min direction
✅ Confirm killzone alignment
✅ Wait price to setup level (no chase)
✅ Confirm vol > 1.5k on trigger bar
✅ Confirm 1:3 R/R minimum
✅ Set T1 partial @ 50% → trail BE → runner T2/T3
Bottom line: lean SHORT off 29,377-29,400 retest into 29,227 SSL. If that's already swept overnight, flip to LONG bounce off SSL reclaim. Stand aside if NY AM opens outside 29,260-29,400 range.
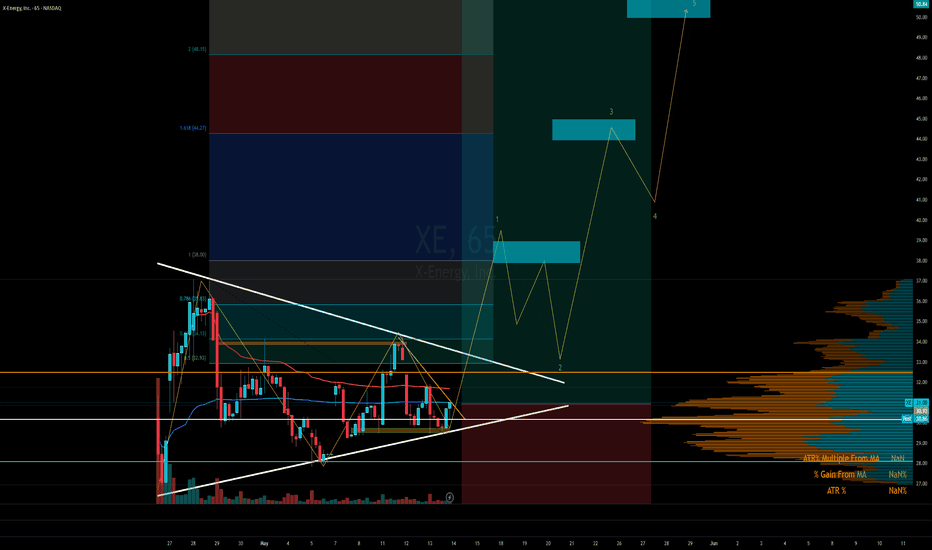
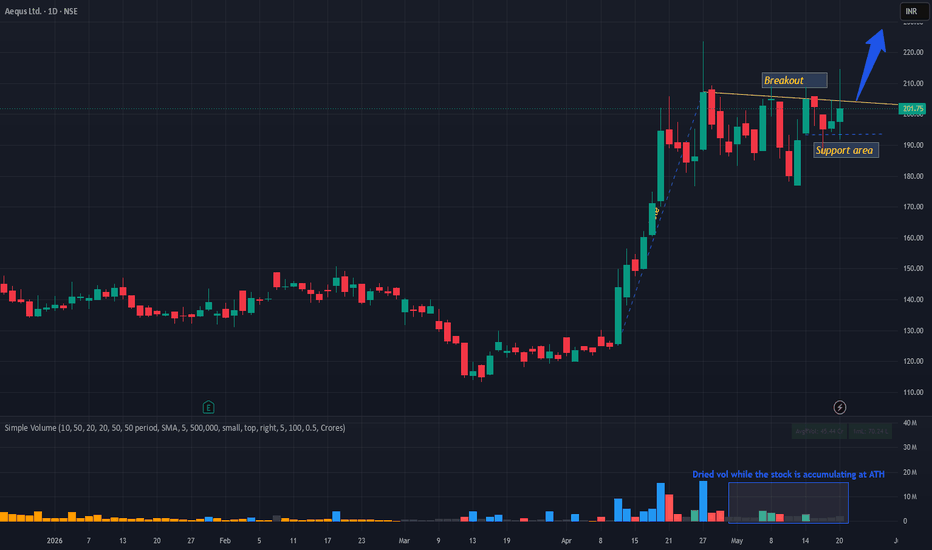
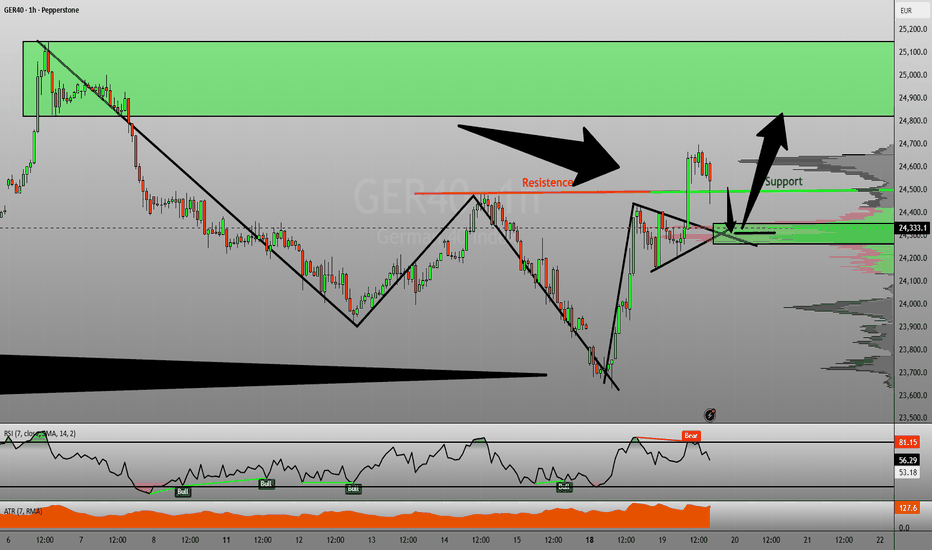
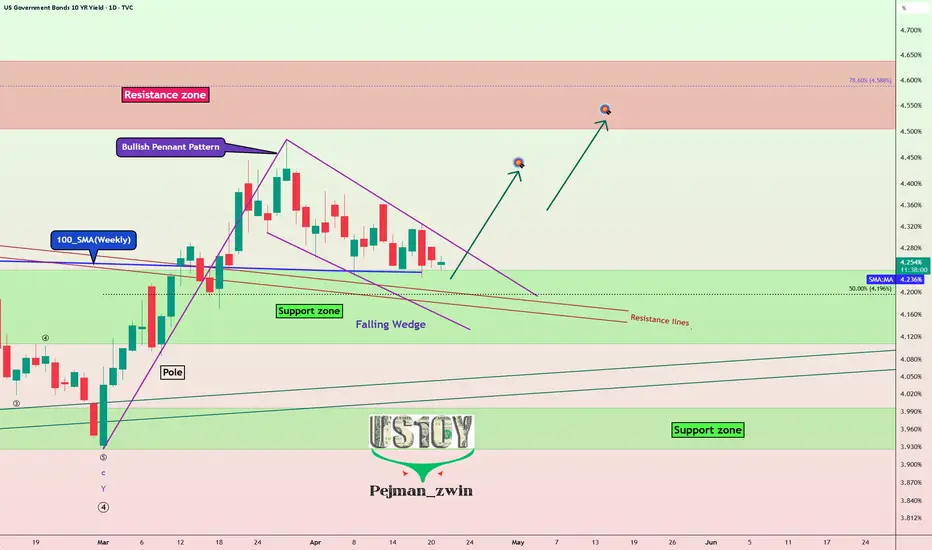
Pennant
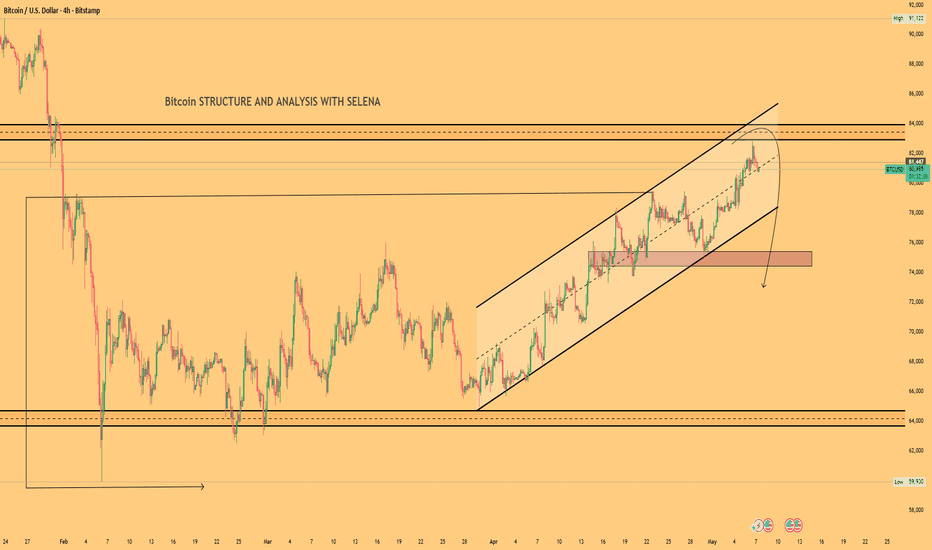
Selena | BTCUSD 4H – Liquidity Rejection Near Major ResistanceBITSTAMP:BTCUSD
✅ Bullish Case 🚀
If BTC holds the 74k–75k demand area after retracement, bullish continuation remains highly probable.
Strong buyer reactions from that region could drive price toward:
🎯 84k resistance
🎯 88k liquidity region
🎯 New external highs above current structure
❌ Bearish Case 📉
Failure to defend the highlighted demand zone could trigger deeper corrective movement.
Sustained weakness below demand may expose:
🎯 72k support
🎯 68k imbalance region
🎯 Previous accumulation ranges
Current Levels to Watch
🔴 Major Resistance: 83k – 84k
🟢 Demand Zone: 74k – 75k
⚪ Long-Term Support: 64k structure base
Educational Insight
This setup reflects a classic smart money reaction from premium pricing. Markets often push into external liquidity zones to attract breakout buyers before retracing into demand and continuing the broader trend. The current structure demonstrates liquidity engineering, premium-discount concepts, and institutional reaction zones clearly.
⚠️ Disclaimer: This analysis is for educational purposes only. It is not financial advice. Please conduct your own research before trading.
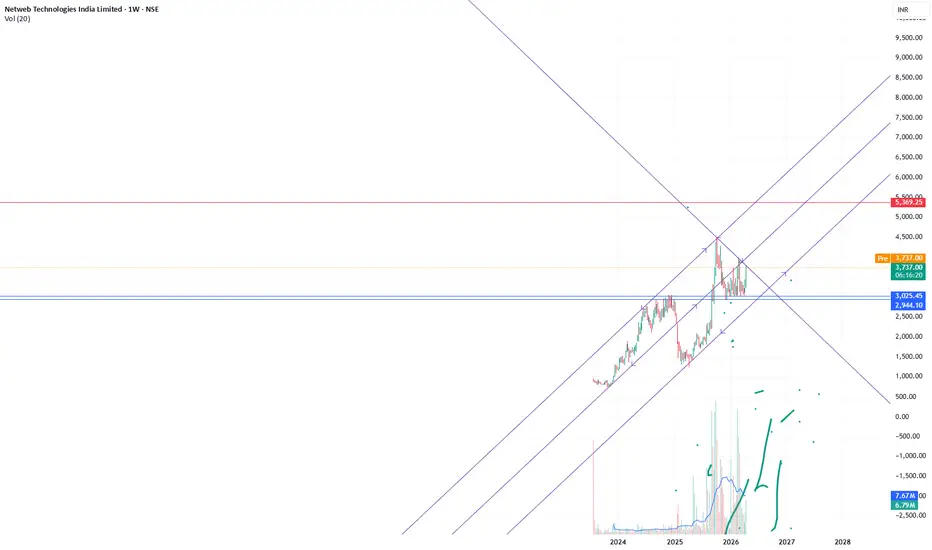
NETWEB | Pennant Formation Inside Rising Broad Channel | 5300+ PNETWEB is currently consolidating in a pennant formation after a strong up move, and the structure is developing within a broader rising channel, which keeps the overall trend constructive.
Chart View:
Price continues to respect the broader upward channel
After the recent rally, the stock has moved into a tight pennant consolidation
This kind of setup often acts as a continuation pattern, provided the breakout comes with strength and volume
Trade Thesis:
A decisive breakout above the pennant resistance can trigger the next leg of the up move.
If price sustains above the breakout zone, the stock can potentially head towards the 5300+ zone in the coming sessions.
Strategy:
Entry: Only on a confirmed breakout above the pennant / upper trendline
Confirmation: Prefer a strong candle close with improving volume
Target Zones:
Immediate target: previous swing high / channel resistance
Positional target: 5300+
Stop Loss: Below the pennant low / recent swing support
Invalidation: Any breakdown below key support or failure to sustain after breakout may delay the move
What to Watch:
Volume expansion on breakout
Sustaining above resistance, not just intraday spike
Price behavior near channel resistance
Bias remains bullish as long as the stock holds the structure.
Breakout confirmation is the key.
Not a buy/sell recommendation. Manage risk properly.
EUR/JPY Bulls Circle as BOJ Decision Loomsith the price coiling within a structure resembling a bull pennant, and with signs momentum may be starting to turn, traders should be alert to the risk of a bullish breakout and retest of the April highs in EUR/JPY. After a strong rebound from the swing low set in late March, the pair has spent much of the past fortnight consolidating in a compression pattern characterised by a series of higher lows and lower highs on the H4 chart.
After grinding higher late last week, the price now finds itself testing the downtrend running from the high set on April 17. Should we see a clean break of this level, it may be enough to encourage fresh longs, putting 187 and 187.30 on the immediate radar given both have acted as support and resistance over recent weeks. A push above the latter would likely see bulls hone in on 187.95. It screens as an appropriate trade target for those looking to act upon a possible bullish breakout. A stop beneath pennant support would provide protection against reversal.
While still neutral for the moment, the message from the oscillators suggests momentum may be starting to shift back in favour of the bulls. RSI (14) had been trending lower over recent weeks but has since broken higher to sit at 50. MACD has also crossed the signal line from below but remains marginally in negative territory, suggesting at the very least the downside strength evident over the past fortnight is fading. Should this trend persist, it would favour long setups over shorts.
Good luck!
DS
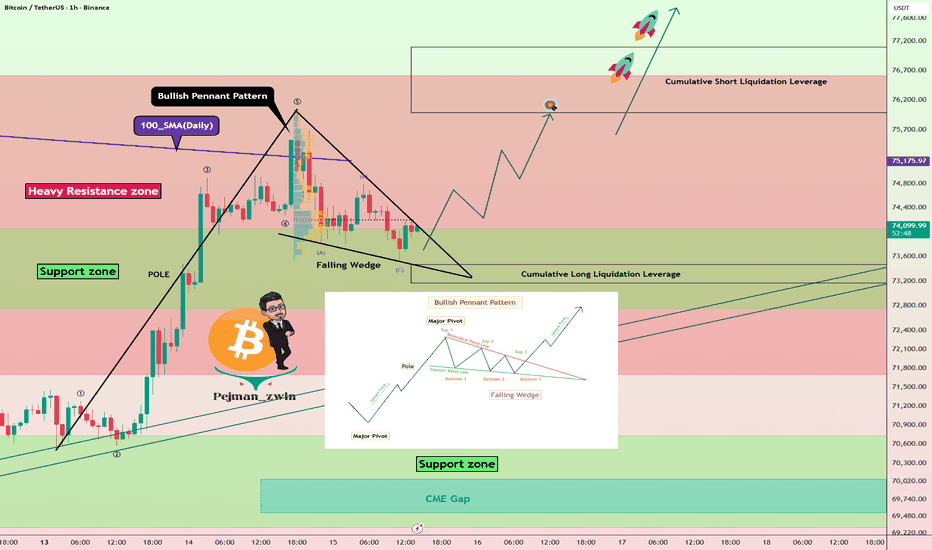
Bitcoin Roadmap: Bulls Aren’t Done YetOver the past two days, Bitcoi n( BINANCE:BTCUSDT ) began to rise and gained over +7% in price, surprising many traders—though, as I expected in a previous idea , I had analyzed this and hit all targets.
Currently, Bitcoin is still moving within the heavy resistance zone($76,600-$71,700) and near the support zone($74,000-$72,760) and Cumulative Long Liquidation Leverage($73,470-$73,170).
From a classical technical analysis perspective, Bitcoin may continue its upward trend and break the heavy resistance zone with the help of a Bullish Pennant Pattern .
From an Elliott Wave perspective, given the rise over the past two days, the recent few hours of downward movement could be seen as a corrective wave, and we might soon expect another impulsive wave upward.
I expect Bitcoin could rise at least to the Cumulative Short Liquidation Leverage($77,100-$75,980), and if Bitcoin’s bullish momentum is strong, we could see a break of the heavy resistance zone, potentially aiming for targets even as high as $80,000 or to the MOON in the coming days.
First Target: Cumulative Short Liquidation Leverage($77,100-$75,980)
Second Target: $80,000 or to the MOON
Stop Loss(SL): $72,600(Worst)
Points may shift as the market evolves
Cumulative Long Liquidation Leverage: $70,400-$69,290
CME gap: $84,560-$79,660
CME gap: $70,055-$69,535
CME Gap: $67,570-$67,170
Note: Given that Iran and U.S. negotiations are set for a second round in Islamabad, Pakistan in two days, the anticipation is that a potential agreement could be reached, which could act as a trigger for another upward move in Bitcoin.
What’s your view on Bitcoin? Could it surpass $80,000, or should we expect another correction?
💡 Please respect each other's opinions and express agreement or disagreement politely.
📌Bitcoin Analysis (BTCUSDT), 1-hour time frame.
🛑 Always set a Stop Loss(SL) for every position you open.
✅ This is just my idea; I’d love to see your thoughts too!
🔥 If you find it helpful, please BOOST this post and share it with your friends.
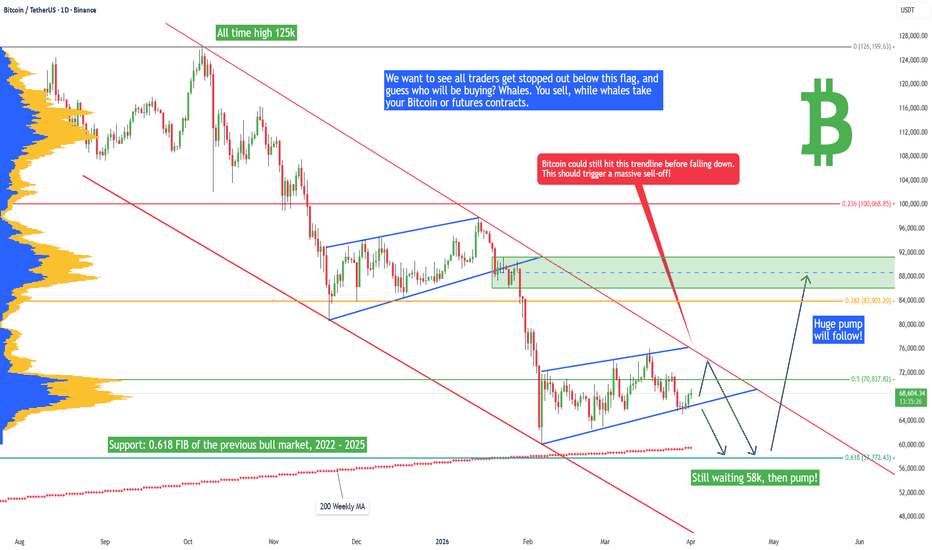
Bitcoin - 58k soon, then rally 88k! (Best opportunity, must see)Bitcoin has been pretty boring in past weeks, but this should change very soon. I am still expecting a last drop to 58k, but then a huge pump to 88k! Why? First of all, I think Bitcoin has been consolidating in this bearish flag for many weeks, and bearish flags are in general negative patterns for the price. There is a much higher probability of going down. So many traders have their stop-loss places below the bear flag, so what we want to see is a liquidity sweep! We want to see all traders get stopped out below this flag, and guess who will be buying? Whales. You sell, while whales take your Bitcoin or futures contracts. Also, many futures traders will open a short position because they will think that we are going to go down to 50k or lower.
Why is 58k a strong support? We have 2 extremely strong confluence here - 200 weekly MA and the 0.618 FIB of the previous bull market (2022 - 2025). In February 2026, Bitcoin front-ran these 2 levels, which is weird. This to me looks like a false start of an uptrend - we still didn't see the capitulation phase.
But right now Bitcoin is going sideways. We can still touch the downward-sloping trendline from the all-time high level before dropping lower.
Let me know your thoughts! Trading is not hard if you have a good coach! I am very transparent with my trades. Thank you, and I wish you successful trades!
EURUSD | What if this level breaks?
Price is trading into higher timeframe supply after taking liquidity above recent highs.
At first glance, this looks like a normal reaction.
But zooming out tells a different story.
The 2022 low wasn’t random.
It was created during macro pressure.
That level still sits below. Untouched.
If this level fails,
price may revisit what was created under stress.
Prediction Markets Tighten Rules As Insider Trading Ban BeginsPrediction markets just entered a critical phase. Platforms now face rising scrutiny from regulators and lawmakers. At the same time, user trust depends on fairness and transparency. This balance creates pressure on every major platform.
The recent prediction markets crackdown shows how fast the landscape changes. Kalshi and Polymarket introduced strict rules on the same day. Meanwhile, lawmakers pushed a bill that could shut these platforms down. This timing reflects urgency across the industry.
Traders now question how these platforms will operate moving forward. Both companies aim to protect their ecosystems. They also want to avoid legal battles that could disrupt growth. This shift marks a major turning point for crypto betting platforms.
Why The Prediction Markets Crackdown Arrived Suddenly
Regulators have watched prediction markets for months. They worry about market manipulation and unfair advantages. Lawmakers believe insiders could exploit sensitive information.
The new prediction markets crackdown responds directly to these concerns. Congress introduced a bill targeting these platforms. This move forced companies to act quickly.
Kalshi and Polymarket chose to tighten insider trading rules immediately. They aim to show regulators that they can self-regulate. This strategy could help them survive future legal challenges.
Kalshi Introduces Strict Controls To Prevent Conflicts Of Interest
Kalshi took a strong stance with its new policies. The platform now bans politicians from betting on their own campaigns. It also blocks athletes from betting on their own sports. These insider trading rules aim to remove direct conflicts of interest. Kalshi understands that trust drives user participation. Without trust, prediction markets cannot function effectively.
The platform also introduced whistleblower tools. These tools allow users to report suspicious trades. This step encourages community involvement in maintaining fairness. Kalshi’s approach shows how platforms adapt during a prediction markets crackdown. It focuses on transparency and accountability. This strategy may help build long-term credibility.
Polymarket Expands Its Rules To Cover Illegal Information Use
Polymarket followed a similar path but added broader restrictions. It now bans trades based on stolen information. It also blocks trades using illegal tips. The platform targets individuals who can influence outcomes directly. This includes insiders with access to confidential data. These insider trading rules reduce the risk of manipulation.
Polymarket wants to protect its reputation among crypto betting platforms. It understands that regulatory pressure will continue to rise. By acting early, it positions itself as a responsible player. This move also signals a shift in how platforms operate. They now prioritize compliance alongside innovation.
How Insider Trading Rules Could Reshape Market Participation
The new insider trading rules will change how users engage with these platforms. Traders must rely on public information instead of privileged access. This shift levels the playing field. However, stricter rules could reduce short-term trading activity. Some users may leave due to reduced advantages. Yet, long-term trust may attract more participants.
The prediction markets crackdown could improve overall market quality. Fair systems encourage broader adoption. This outcome benefits both platforms and users. Crypto betting platforms now face a new reality. They must balance innovation with strict compliance. Those who succeed will likely dominate the market.
Final Thoughts On Prediction markets
Prediction markets now face intense scrutiny from both regulators and users. Platforms respond with stronger insider trading rules and better monitoring tools. This shift signals a maturing industry.
The prediction markets crackdown highlights the importance of trust. Without fairness, these markets cannot survive. Kalshi and Polymarket understand this reality and act accordingly.
The coming months will reveal how effective these changes are. If platforms maintain transparency, they could secure long-term growth. If not, regulatory pressure may increase further.
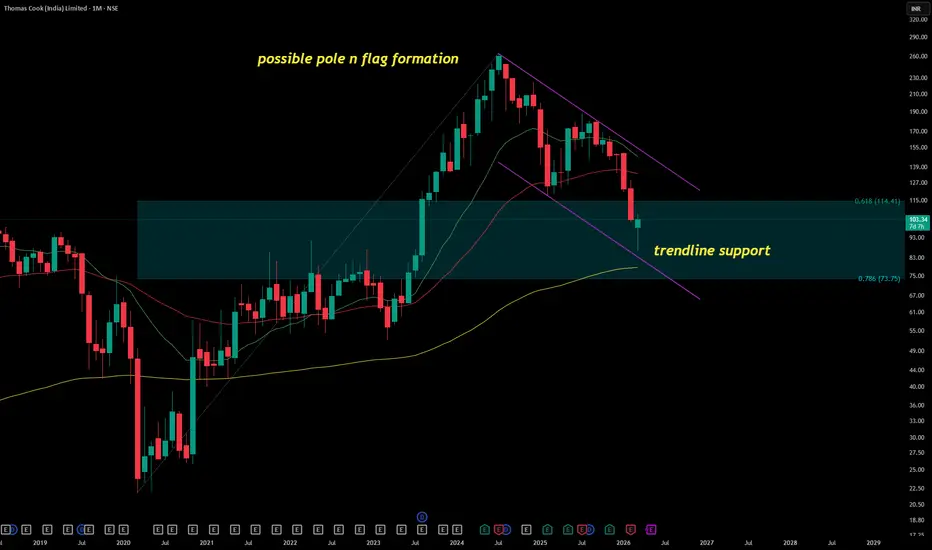
THOMAS COOKThomas Cook (India) Ltd. (NSE: THOMASCOOK) is a mid‑cap travel services company offering foreign exchange, holiday packages, corporate travel, and visa services. It is part of the Fairfax Financial Holdings Group (Fairbridge Capital Mauritius Ltd.), which is the promoter. As of Dec 2025, promoters hold 63.83%, with balanced institutional and retail participation.
FY22–FY26 Snapshot
Revenue Growth: CAGR ~11–12% over FY22–FY26, driven by recovery in travel demand post‑COVID. → Good
Net Profit: FY26 PAT ~₹210 Cr, reflecting strong turnaround. → Good
Operating Margin: Maintained ~8–9%, moderate efficiency. → Neutral
Equity Capital: Stable, no major dilution. → Good
Dividend Policy: Yield ~1.2% (FY26), conservative payouts. → Neutral
Asset Building: Expansion of forex and travel services network. → Good
Sales: FY26 revenue crossed ₹6,200 Cr. → Good
Expense: High operating costs in travel services. → Neutral
EPS: ~₹6.4 in FY26, reflecting consistent profitability. → Good
Institutional Interest & Ownership Trends
Largest Promoter: Fairbridge Capital Mauritius Ltd. (Fairfax Group) – 63.83%
Largest FII: Foreign institutional investors – 7.28%
Largest DII: Domestic institutions – 6.83%
Retail & Others: ~16.54%
Strategic Moves & Innovations
Expansion into digital travel booking and forex platforms.
Focus on corporate travel management and MICE (Meetings, Incentives, Conferences, Exhibitions).
Investment in technology‑driven customer experience.
Strengthening partnerships with airlines and hotels globally.
Cash Flow & Balance Sheet Strength
Operating cash flows supported by travel demand recovery.
Debt levels moderate, manageable with steady profits.
Profit growth supports reinvestment in digital platforms.
Risk Factors
Dependence on global travel demand cycles.
Margin sensitivity to forex volatility and travel costs.
Competition from online travel agencies (MakeMyTrip, Yatra).
Exposure to geopolitical and pandemic risks.
Investor Takeaway
Thomas Cook (India) Ltd., backed by Fairfax Group via Fairbridge Capital Mauritius, is a leading travel services provider with strong promoter holding and balanced institutional interest. With most snapshot parameters rated Good, the company shows consistent EPS growth, robust asset building, and strong sales momentum. Investors should monitor travel demand cycles and forex volatility, but overall the outlook remains positive for long‑term holders.
GOLD sell we are building nice Price action.
This is high probability trade here, wait for brake out of trend line to go short.
This ascending channel brake out and form a kind of flag and we brake out of flag with smaller flag that is going to be our entry!
Trade your strategy in short direction.
BE safe!
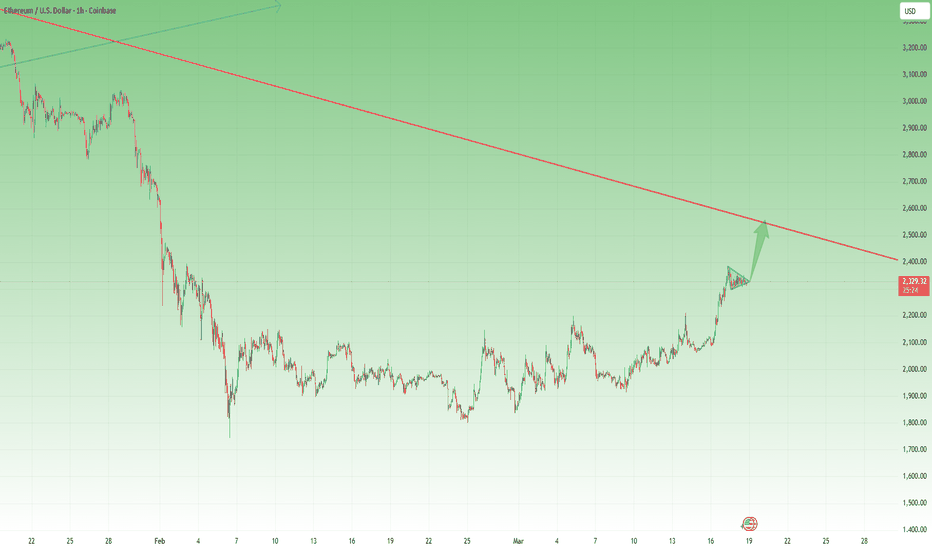
Eth- Another push to 2500?In my previous Ethereum analysis, I mentioned that the 1800 zone had a high probability of acting as a temporary low, with good chances for an upside reversal.
So far, the market has behaved in line with that expectation.
ETHUSD reacted well from that area and moved higher, and since my entry, the position is currently up around 15%, confirming that buyers were indeed willing to step in at those levels.
A Reversal… But Not the Bottom
That being said, it is important to separate a tradable reversal from a long-term bottom.
In my view, this move does not represent the end of the broader bear market. Rather, it appears to be a corrective phase within a larger structure, which is something we often see after extended declines.
And this naturally leads to the key question:
Does Ethereum still have room for another push higher?
Reading the Current Structure
Looking at the recent price action, the structure remains constructive in the short term.
Ethereum has been holding its gains relatively well, without giving back much of the move. This kind of behavior often suggests that the market is not rushing to exit positions, but rather building pressure for continuation.
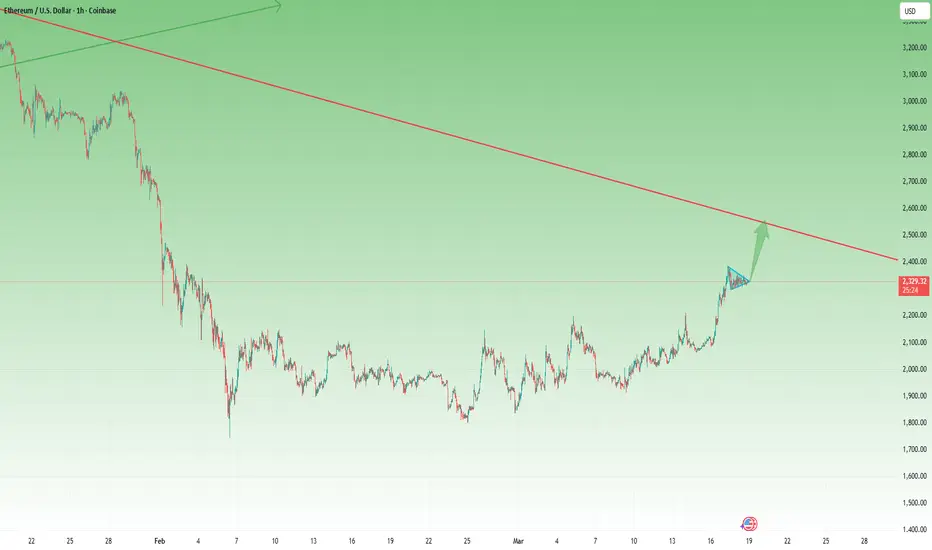
More importantly, the recent consolidation near the local highs appears to be forming a pennant-type structure, which is typically considered a continuation pattern.
This suggests that the market may simply be pausing before attempting another move higher.
What Could Come Next
If this structure continues to develop and eventually resolves to the upside, Ethereum could see another leg higher, extending the current corrective move.
From a technical perspective, the 2500 zone becomes the next logical area of interest. A move toward that level would represent a more complete upside correction, following the initial rebound from 1800.
The Bigger Context
However, it is important to remain grounded in the broader context.
Even if Ethereum pushes higher from here, this should still be viewed as a correction within a larger bearish environment, rather than the start of a new long-term bullish cycle.
This distinction is essential for managing expectations and risk.
Conclusion
Ethereum has delivered a solid bounce from the 1800 zone, validating the idea of a short-term reversal and providing a strong move for those positioned early.
At the same time:
- The broader market structure still suggests a corrective phase
- The current consolidation resembles a continuation pattern (pennant)
- There is still potential for another push higher toward 2500
For now, the structure allows for further upside — but within the context of a market that may not yet have formed its final bottom. 🚀
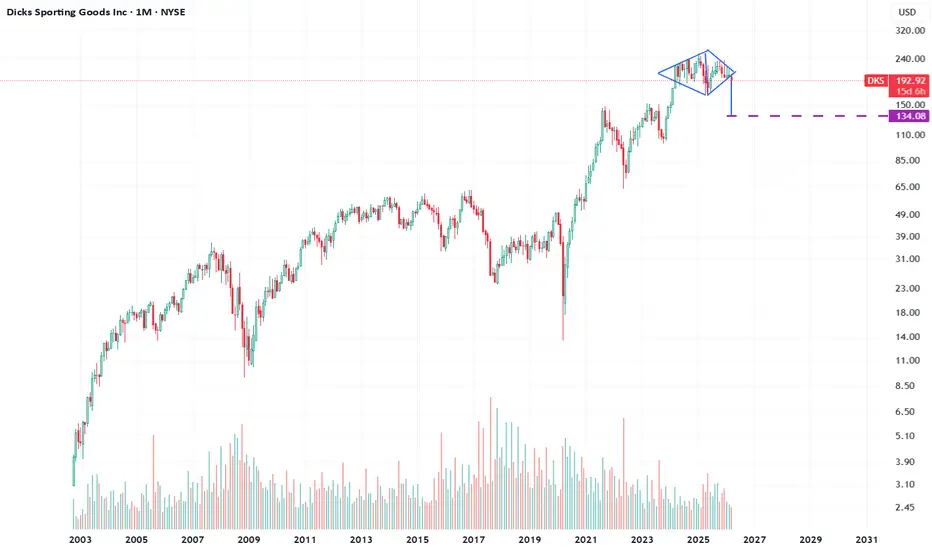
DKS - rare diamond pattern formed at potential top of bull trendBearish - Diamond top ? if price turns round and shoots out the top then bull continuation if wrong. But I think the tops in for US equites at some point this year so why not now?
Pattern is not perfect but it looks there to me
Here are the main reasons Dick’s Sporting Goods (DKS) could move lower, ranked most important first:
Lower-than-expected earnings outlook – Even after strong recent results, the company projected future earnings below analyst expectations, which can trigger selling.
Weak consumer spending on discretionary goods – Sporting goods are discretionary purchases, so when consumers tighten budgets, demand can fall.
Integration risks from the Foot Locker acquisition – The $2.4B purchase adds debt and operational risk, and the acquired business may weigh on earnings until it is turned around.
Profit declines despite sales growth – The company has reported lower net income year-over-year, which can worry investors about margins and future profitability.
Retail sector volatility – Retail stocks tend to drop when investors fear economic slowdown or weaker consumer demand.
High expectations priced into the stock – When a stock has performed well previously, even good results can cause declines if investors expected stronger growth.
✅ Simple takeaway:
DKS is most likely to fall if consumer spending weakens and investors worry that earnings growth will slow, especially while the company works through the Foot Locker acquisition and margin pressures.
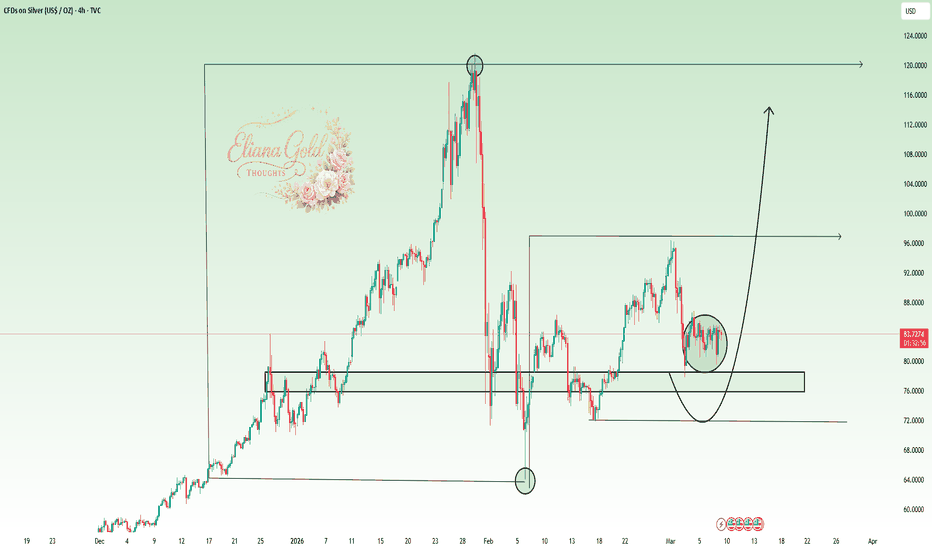
Eliana | XAGUSD · 4H – Accumulation Before Bullish ExpansionFX:XAGUSD
The market is currently consolidating around the mid-range between 80 and 88. This structure often indicates accumulation where liquidity builds before the next directional move. The recent reaction from the demand zone around 76–78 suggests buyers are gradually regaining control. If price holds above this support structure, the market could initiate a new bullish expansion phase targeting the upper liquidity zones.
Key Scenarios
✅ Bullish Case 🚀
Hold above 76 – 78 demand zone
🎯 Target 1: 96
🎯 Target 2: 110
🎯 Target 3: 120
❌ Bearish Case 📉
Break below 76 support
🎯 Downside Target 1: 72
🎯 Downside Target 2: 65
Current Levels to Watch
Resistance 🔴: 88 – 96
Major Resistance 🔴: 118 – 120
Support 🟢: 76 – 78
Major Support 🟢: 72
⚠️ Disclaimer: This analysis is for educational purposes only. It is not financial advice.
AUD/USD: Pullbacks to 0.7160 may attract dip buyersAUD/USD has seen a bullish breakout, with the price now trading above Tuesday’s high and the 0.7160 peak set in February 2023.
Should the price retest and bounce from 0.7160, unlike yesterday, it would make for an attractive entry point for longs for those looking for a resumption of the bullish trend, allowing for a stop to be placed underneath to protect against reversal.
The June 2022 high of 0.7282 screens as an appropriate initial target.
Alongside support from rate differentials and tailwinds from still-elevated energy prices, the momentum picture is also swinging back in favour of the bulls. RSI (14) has broken its sequence of lower highs while remaining above 50, while MACD is on the cusp of delivering a bullish crossover, strengthening the signal.
In this market regime, it feels like only a major deterioration in risk appetite may be enough to derail the Aussie’s ascendency. On that front, a soft US CPI print later today would likely help the Aussie's cause, while a hot number may create headwinds for risk appetite alongside ongoing geopolitical uncertainty.
Good luck!
DS
Selena | BTCUSD · 1H – Liquidity Test Near Channel ResistanceBITSTAMP:BTCUSD BINANCE:BTCUSD
After forming higher lows along the channel support, BTC pushed aggressively into the upper boundary where buy-side liquidity rests above previous highs. Price is currently testing this area of resistance. Such zones often trigger short-term rejections before the market either consolidates or continues toward higher liquidity levels.
Key Scenarios
✅ Bullish Case 🚀
• Hold above 70,000 structure
• Break above 74,000 resistance
• 🎯 Target 1: 75,500
• 🎯 Target 2: 77,000
• 🎯 Target 3: 79,000
❌ Bearish Case 📉
• Rejection below 73,500
• 🎯 Target 1: 71,000
• 🎯 Target 2: 69,500
• 🎯 Target 3: 68,000
Current Levels to Watch
Resistance 🔴: 73,800 – 74,200
Major Resistance 🔴: 74,500 – 75,000
Support 🟢: 70,000 – 70,500
⚠️ Disclaimer: This analysis is for educational purposes only. Not financial advice
Bull pennant on monthly btcusd log chartIf the monthly 50ma (in orange) can find a way to maintain solid support, then bitcoin should breakout upward from the current bullpennant right around where I arbitrarily placed the dotted purple line. This would give the bull pennant a breakout target of around 460k. Of course, Being a logarithmic chart pattern on a 1 month timeframe, this target could take several years to reach. *not financial advice*
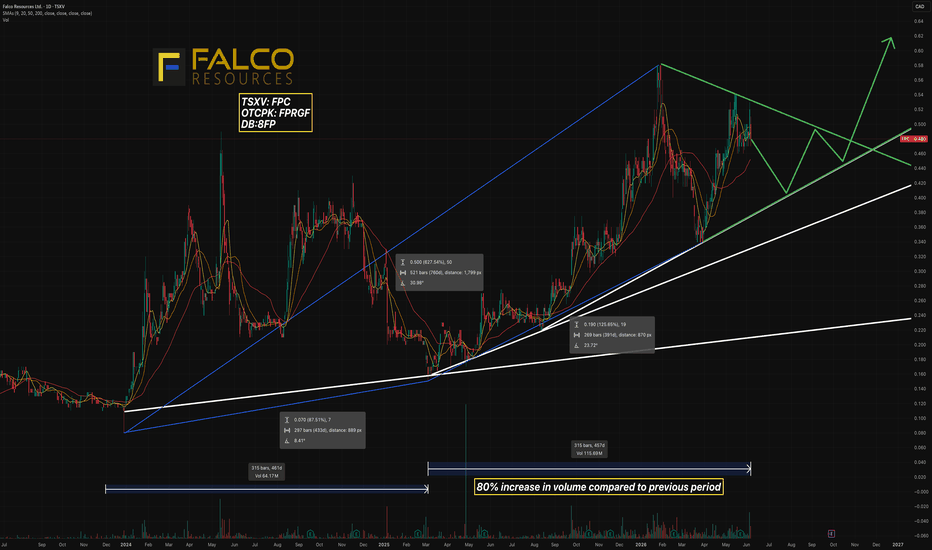
Bullish PennantEnd of April - middle of May is when we should break out of this bullish pennant. If the market as a whole has the volume at that time it should be easy for us to break out hitting new ATH. But if the market decides to go down around this time, it would seem that
BLUAI has found its bottom with a strong support at $0.004845.
Some people are saying the bear market can end starting Q2 while others are saying Q3/Q4 with next year 2027 being the bull year into 2028. What do you think?
Bullish pennant pattern appearing.CPHL Analysis
Closed at 84.16 (27-02-2026)
Bullish pennant pattern appearing.
Staying above 81 on weekly basis is OK.
else, next support lies around 74 - 76 & then around 64 - 65.
Immediate resistance is around 87 - 88
Breakout above 110 with good volumes may lead it towards 175 - 180.
Breaking 52 may start downtrend.