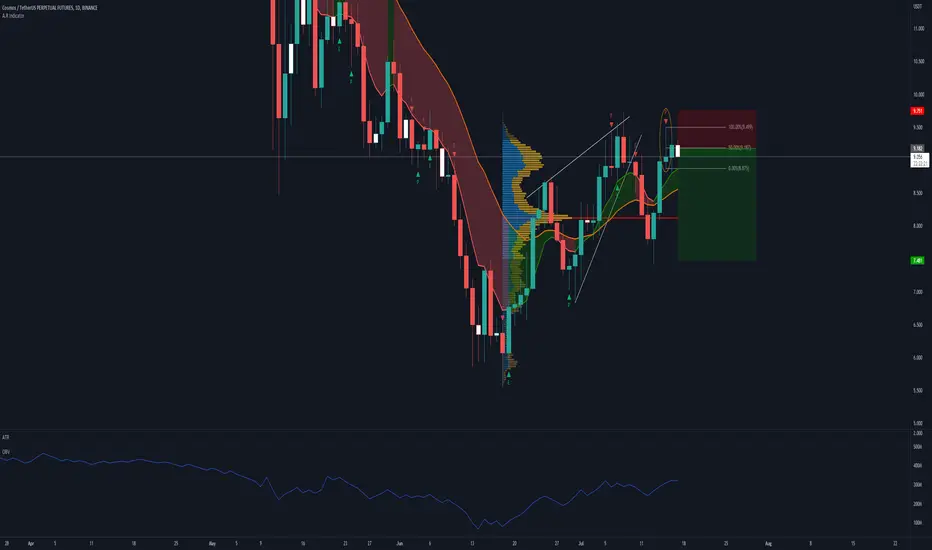
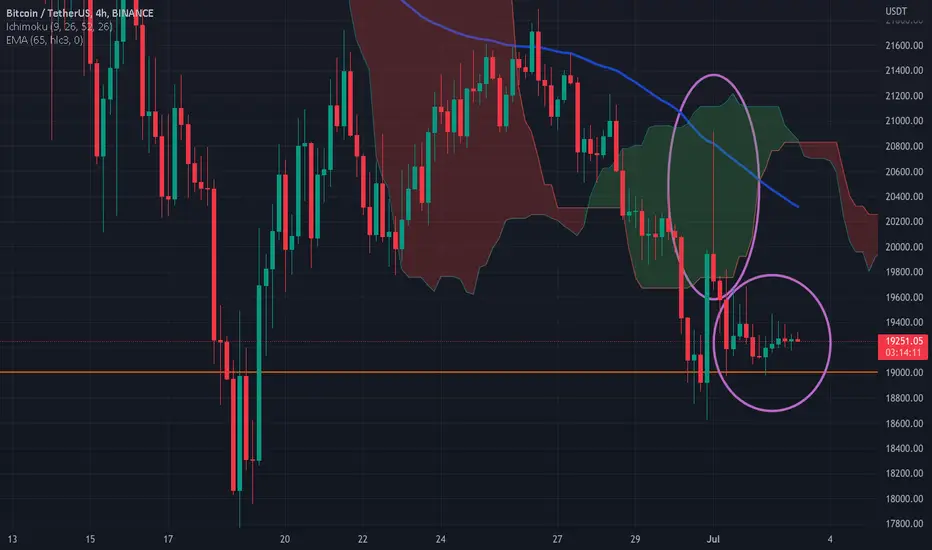
Pinbar candle on demand zone?ETH 4h chartSo previous idea on ETH went perfect! (Check it if you haven’t seen it yet)
Following the analysis,we notice a pinbar candle on 4H ETH chart on demand zone which could lead to higher prices.but since the ascending wedge I told you about it the previous idea broke down,every upside is considered a pullback and an opportunity to sell or short.good luck all!
Pin Bar
Strong Trading Strategy, Do not trust all the pin barsThe pin bar pattern is one of the best signals on any market for predicting the next move. But should you trust all pin bars? In my humble opinion, NO, and I’m explaining this idea below and the approach I take to distinguish valid pin bars from invalid ones.
I suppose you already know what is a pin bar, so I’ll not explain its basic details here. If you don’t know please, do a search and read its basics first.
I have 3 filters for my pin bars. Find them below and boost the idea if you liked
NZDUSD SHORT SWINGIts about time. Potential Move to 0.60000 to complete cycle of Quarter Levels. Have posted this severally and was waiting for a confirmation. Current reversal level has seen price break the Monthly High Price and pull back. This could be a Fake move to induce Long position since the Monthly Bar just closed was a PIN BAR. A high chance that retail traders will trade the PIN BAR long a.k.a Price Action.
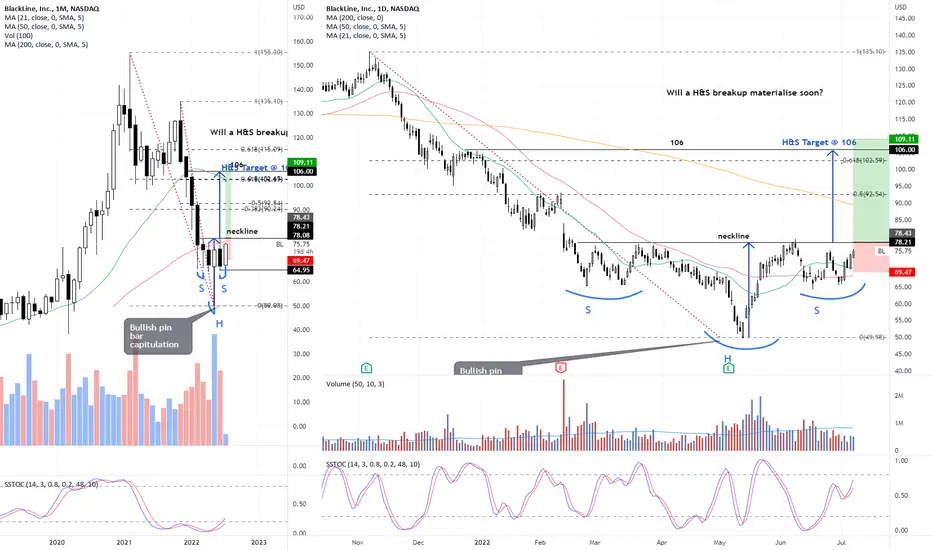
BL - potential bullish H&S PatternIt is likey the low of 49.66 hit on 12 May is "the" low for now as we see a bullish pin bar has formed on the monthly chart on relatively high volume.
Now appears to be forming the right shoulder of a Head and Shoulders pattern with neckline around 78. A breakup of this neckline (preferably on relatively good volume) will likely mean the stock has turned the corner with a possible H&S target for around 106.
Disclaimer: Just my 2 cents and not a trade advice. Kindly do your own due diligence an
DXY - Weekly bearish divergence! + Elliott Wave + PIN BAR!- As per my Elliott Wave technical analysis - it looks like the massive impulse wave can be completed and we are now headed to a retracement.
- On the weekly chart we have a shooting star - bearish candle with a long wick ( PIN BAR )!
- If we take a look at the RSI indicator on this chart, we can see a bullish divergence , which is a pretty strong bearish signal.
- We don't really know how deep the retracement will be, but we can go back down to the acceleration point + 0.618 FIB.
- MACD his
SPY SHORT - SUPPLY, LIQUIDITY, PITCHFORKWe are at a supply orderblock which caused a break of structure below. Upon reaching the orderblock, we saw a pinbar + inside bar combination pattern. Not only that, we are reacting to the upper parallel line of the pitchfork. We can target the imbalance and equal lows liquidity below.
SPX - short term bounce possible but bigger trend still downSPX appears to be finding support around 3800 with last Friday closed way off its intraday low, forming a pin bar of sorts. This is an intermediate support (which is the 38.2% fib retracement of the major AB (covid crash recovery swing) swing up.
A short rebound from oversold position will not be unexpected. However there are a number of near term resistances on the way up :
1. downtrend channel (see daily chart)
2. previous support turned resistance around 4100-4200
The risk remains that a
Bulls Have Power & Charge Like SPWR Power!Bulls Have Power & Charge Like SPWR Power!
Bullish pin bar at support on SPWR!
Safe Entry 16.60
Why? 16.60 is .15 cents above the head of the pin bar : )
Contract
17 C or 18 C and set my expiration date out 2 weeks from entry date.
Stop loss
14.93
Expectation move
Approx 20.86.
*Reasoning- Resistance range (on weekly chart) is between 21.23 and 22.36.
BNB-A Good chance for reversal?Hello everyone
In the past couple of days we have seen a new face of the crypto market. Daily chart of BNBUSDT shows,a bear trend taking place and for today's bar so far we have a pinbar. Now you may think "It's a good time to buy", NO.After a bear trend this steep, with this much volatility and fear? Anyway,pinbar is a good signal but a really bad context.In lower time frames,we have the micro channels forming.If you are a trader and not an investor, you know what to do.
For now. we have
Bearish Continuation Trade EURCAD 4HBearish trend continuation confluence trade on the EURCAD 4H.
1. Overall bearish trend
2. 3x trendline touches
3. Retracement to the 50% level from the most recent swing (not closed above)
4. At previous structure swap zone
5. Entry on bearish pin bar (aggressive)
Entry: 1.35429
Stop loss: 1.36152
Take profit: 1.34001
Risk/Reward: 1/1.98
ERRORS ON PIN-BARSThere are a large number of technical analysis figures, there are many different patterns, but as you know, they do not work 100% of the time.
No matter what you trade, you should always pay attention to the market context and the pin bar is no exception.
Pin bar is a very profitable pattern, provided that you trade it correctly.
Beginners often make mistakes trying to trade every pin bar that is formed in the market.
Today we will try to analyze the most common mistakes of beginners when tradin
DOT- Going back up may not be an option!!hello everyone
Yesterday's bar been closed with a lot of selling pressure and a shadow the same size of the bar on top, which is not a good sign for the market.if this price behavior continues we may have a bear flag formation right here (can be seen better on lower time frames).
For DOTUSDT ,we have the resistance level of 17$ and support level of 16$ and the weekly trend line which held the price so far.
I believe we may see the market a pinbar pattern here but it may have the same be
DYDX-accumulation,double bottom ,wedge and higher lows.Hello everyone
Good title,right?
On daily chart on DYDXUSDT, we have good amount of structure and context for a reversal.
I know many people may say" that's a bear flag right there ", yes with a pinbar rejection and a weekly wedge and higher lows. That's why the price is more likely to touch the 4.55$ or the bottom trend line again ( because of the shadows of the last 5 bars & the hanging man of today)and we will have a rejection there and might see the price reaches 6$ by the end of t
BNB- possible double bottom setupHello everyone
After a red bar with a long shadow on weekly on BNBUSDT, now we have started the new week with another red one.On daily chart, we can see a long shadow that touched the weekly trend line and came back, which is a good thing and with the today's candle we can expect a double bottom, which can turn into a High 2 on a trading range and a good buy setup.
On the daily chart we also have the 400$ resistance which is more likely to break again tomorrow and 390$ support level and the
SHIB- that's a very straight flag Hello everyone
On the daily chart of SHIBUSDT, we can see a very straight(odd) bull flag pattern ,we also have a wedge pattern on weekly chart that shows a lot,and on daily we can see long shadows on the last 3 candles and the middle one is a Doji. With the indication of the things I just explained, we can have a rise close to the trend line and with the hope of having the market making higher highs we might be able to reach 0.000028$ within the end of the month.
P.S. : I analyze coins