BTC Analyses-1, [July 06, 2026Welcome to my page! I share daily technical analyses of Bitcoin and other charts here.
BINANCE:BTCUSDT
💡Market Analysis:
Bitcoin is currently consolidating between the defined key resistance and support areas. We are waiting for a clear breakout with a candle showing >50% body outside these bounds to confirm the next directional trend.
Key Support & Resistance:
Key Resistance: 63,346
Key Support Area: 60,840 - 61,286
🎯 Trade Entry & Exit Plan:
Entry : Breakout/Pullback of trendline or key zones with >50% candle body.
Stop Loss : Behind the last wave or the last breakout candle.
Take Profit : Minimum R:R 2, with further targets at major horizontal levels.
⚠️Risk Management:
Maximum 1% risk per trade.
❤️Please share your thoughts and comments on this analysis!
Pivot Points
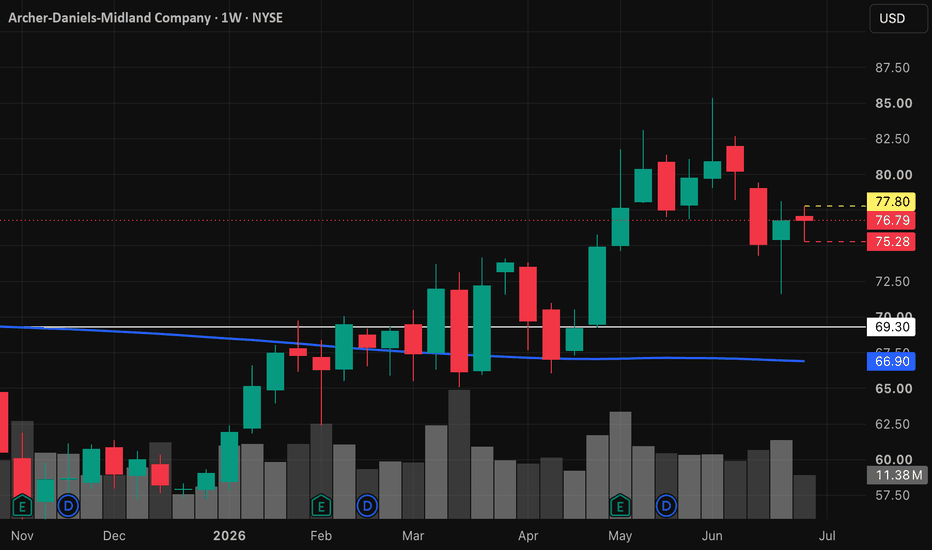
ADM | Continued stock growth- Timeframe: Weekly
- Trade type: Buy stop order
- Price: 77.80
- Take Profit: Open
- Stop Loss: 75.28 (-3.20 %)
Idea: Long on a breakout above last week's high - bullish momentum continuation.
Entry: Buy stop above last week’s high.
Stop-loss: Below the low of the same candle.
If the weekly candle closes below this level, the trade is invalidated.
Take Profit: Trailing stop following the lows of new weekly candles.
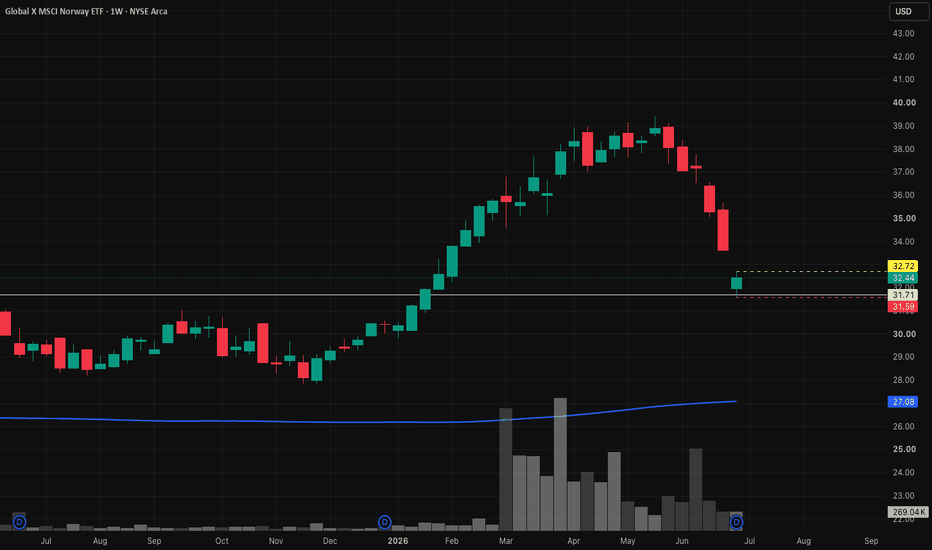
NORW | Continued growth ETF- Timeframe: Weekly
- Trade type: Buy stop order
- Price: 32.72
- Take Profit: Open
- Stop Loss: 31.59 (-3.40 %)
Idea: Long on a breakout above last week's high - bullish momentum continuation.
Entry: Buy stop above last week’s high.
Stop-loss: Below the low of the same candle.
If the weekly candle closes below this level, the trade is invalidated.
Take Profit: Trailing stop following the lows of new weekly candles.
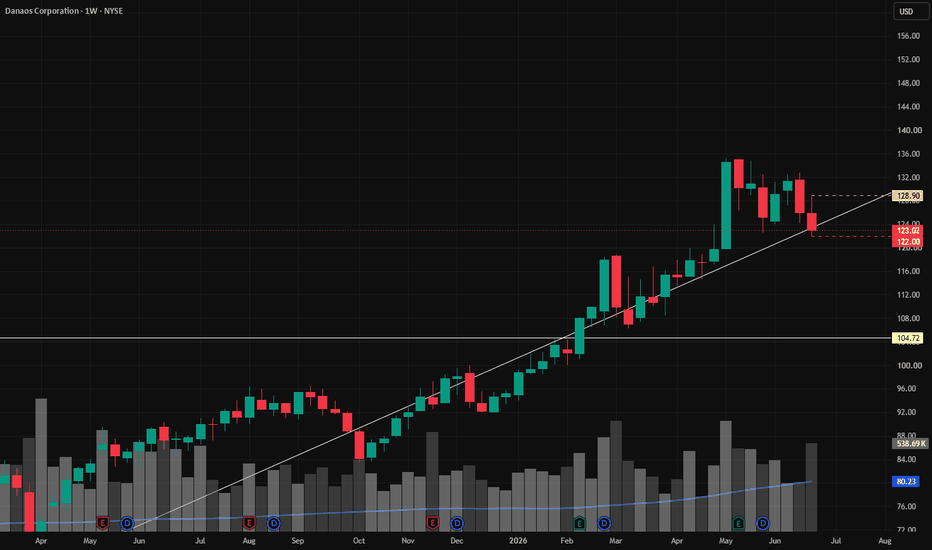
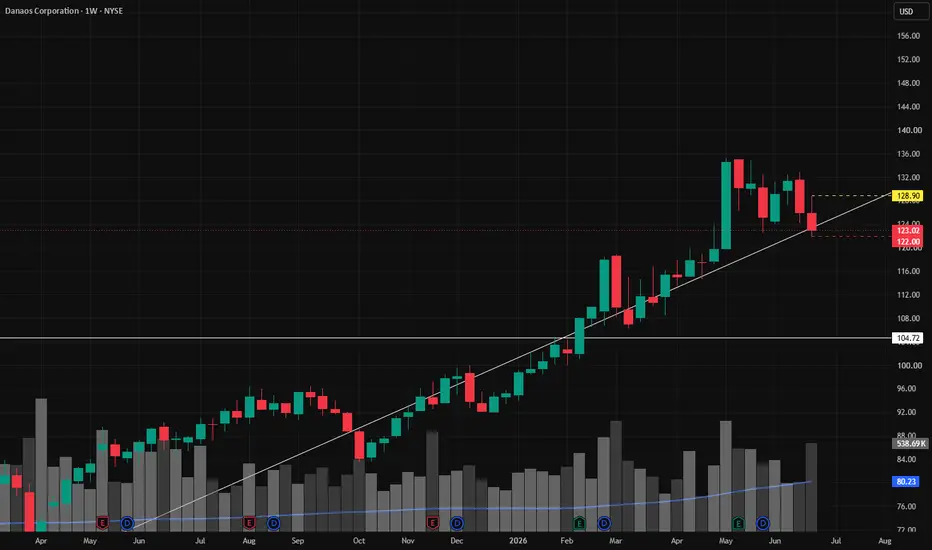
DAC | Continued stock growth- Timeframe: Weekly
- Trade type: Buy stop order
- Price: 128.90
- Take Profit: Open
- Stop Loss: 122.02 (-5.40 %)
Idea: Long on a breakout above last week's high - bullish momentum continuation.
Entry: Buy stop above last week’s high.
Stop-loss: Below the low of the same candle.
If the weekly candle closes below this level, the trade is invalidated.
Take Profit: Trailing stop following the lows of new weekly candles.
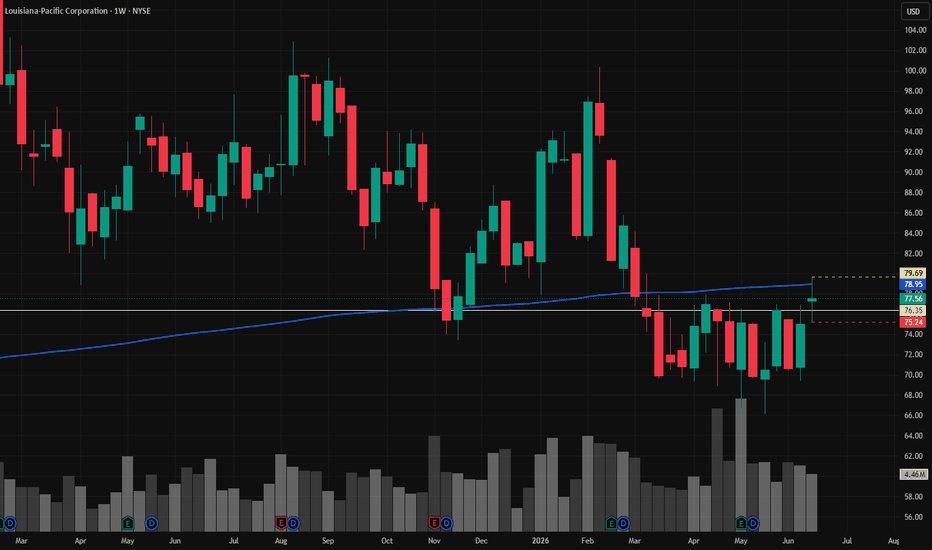
LPX | June, 2026 | The time to go long has come- Timeframe: Weekly
- Trade type: Buy stop order
- Price: 76.69
- Take Profit: Open
- Stop Loss: 75.24 (-5.60 %)
Idea: Long on a breakout above last week's high - bullish momentum continuation.
Entry: Buy stop above last week’s high.
Stop-loss: Below the low of the same candle.
If the weekly candle closes below this level, the trade is invalidated.
Take Profit: Trailing stop following the lows of new weekly candles.
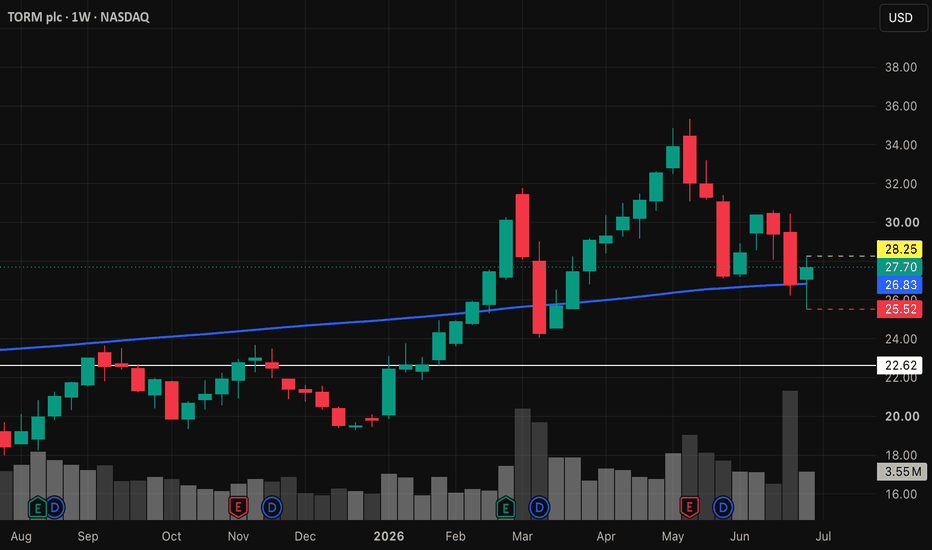
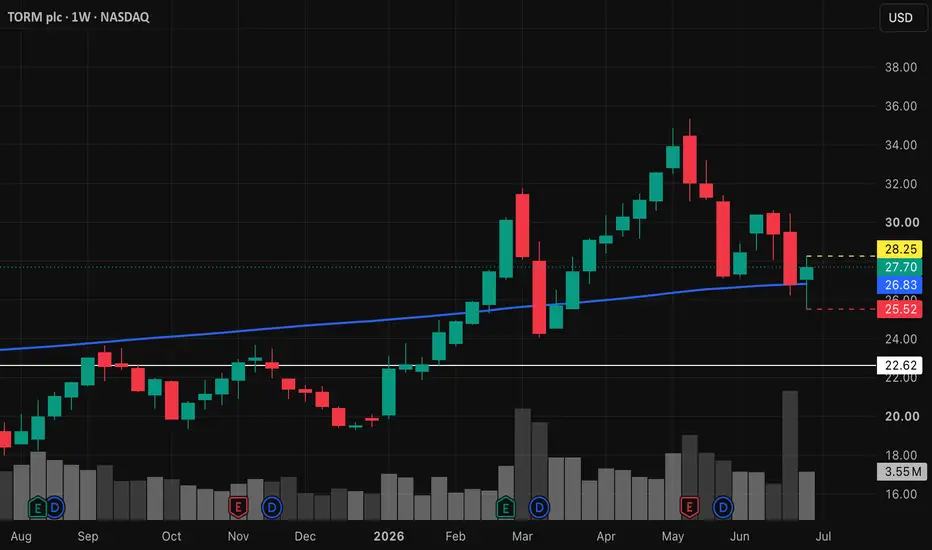
TRMD | Continued stock growth- Timeframe: Weekly
- Trade type: Buy stop order
- Price: 28.25
- Take Profit: Open
- Stop Loss: 25.52 (-9.70 %)
Idea: Long on a breakout above last week's high - bullish momentum continuation.
Entry: Buy stop above last week’s high.
Stop-loss: Below the low of the same candle.
If the weekly candle closes below this level, the trade is invalidated.
Take Profit: Trailing stop following the lows of new weekly candles.
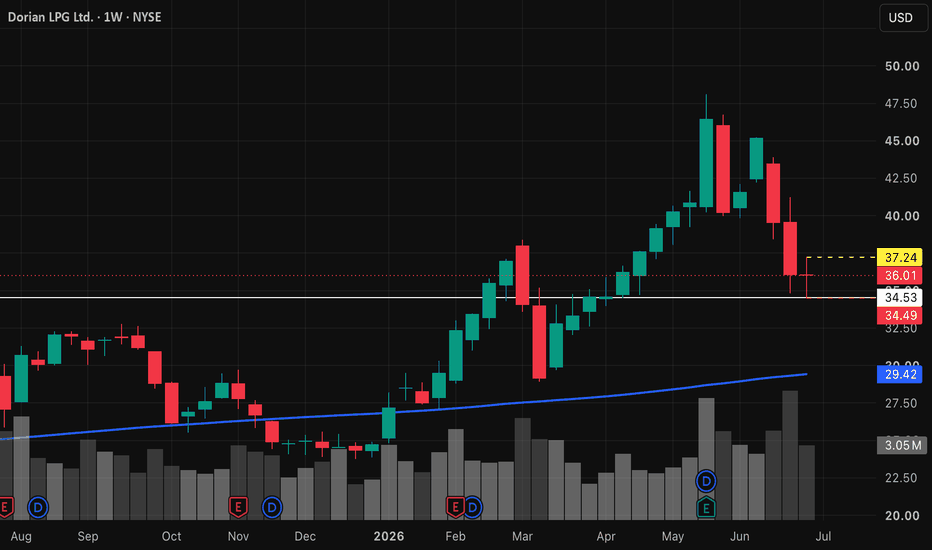
LPG | Continued stock growth- Timeframe: Weekly
- Trade type: Buy stop order
- Price: 37.24
- Take Profit: Open
- Stop Loss: 34.49 (-7.40 %)
Idea: Long on a breakout above last week's high - bullish momentum continuation.
Entry: Buy stop above last week’s high.
Stop-loss: Below the low of the same candle.
If the weekly candle closes below this level, the trade is invalidated.
Take Profit: Trailing stop following the lows of new weekly candles.
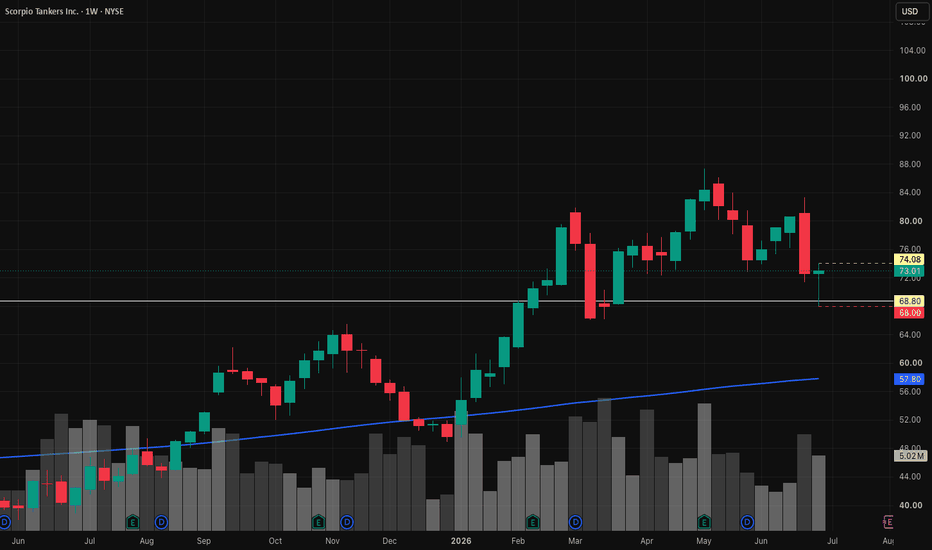
STNG | Continued stock growth- Timeframe: Weekly
- Trade type: Buy stop order
- Price: 74.08
- Take Profit: Open
- Stop Loss: 68.00 (-8.20 %)
Idea: Long on a breakout above last week's high - bullish momentum continuation.
Entry: Buy stop above last week’s high.
Stop-loss: Below the low of the same candle.
If the weekly candle closes below this level, the trade is invalidated.
Take Profit: Trailing stop following the lows of new weekly candles.
PLD | Continued stock growth- Timeframe: Weekly
- Trade type: Buy stop order
- Price: 139.50
- Take Profit: Open
- Stop Loss: 135.10 (-3.20 %)
Idea: Long on a breakout above last week's high - bullish momentum continuation.
Entry: Buy stop above last week’s high.
Stop-loss: Below the low of the same candle.
If the weekly candle closes below this level, the trade is invalidated.
Take Profit: Trailing stop following the lows of new weekly candles.
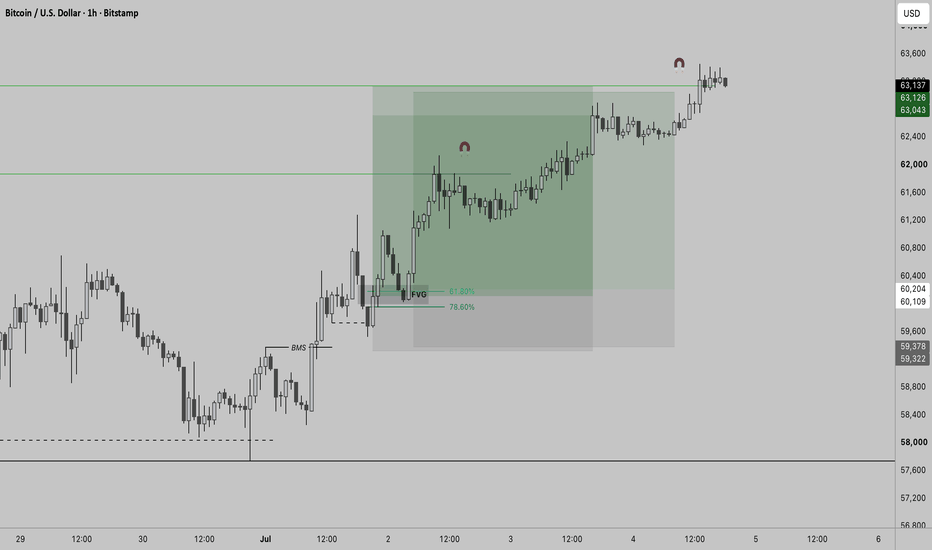
$BTC - Market Update (7/6)BINANCE:BTCUSDT ran the 63.5k sell walls we were highlighting before reversing.
Over $625M in net market sells over the last two hours. What's interesting is that we haven't seen any major liquidation cascades on the big exchanges.
The orderbook is still bid-heavy, with $166M in buy walls around 60.8k-60.6k. Though I'm also watching if we get a deviation into 60.5k-60.1k.
Nifty Analysis EOD – July 6, 2026 – Monday🟢 Nifty Analysis EOD – July 6, 2026 – Monday 🔴
Bulls Hold the Fort: Nifty Battles 24450 to Close Strong at 24430
🗞 Nifty Summary
Nifty opened with a gap-up of 40 points, even as Gift Nifty was showing 20 points negative. After an initial tick 24 points down, the index found its base at 24,287.10 and from there climbed gradually and steadily, moving up 166 points to reach 24,450, where it face resistance. It tried multiple times to break out above this level, but around 1:40 PM the last attempt failed and price fell back below IBH, 76 points off the day’s high. PDH came in to rescue the move here, and Nifty found support and bounced back 65 points, with the day closing at 24,423.75 and the adjusted close at 24,430.35, slightly above the 200 EMA.
Overall, the day was controlled by bulls and formed a 172-point range. The 24,420 ~ 24,430 zone was a struggling area for bulls to break through, but managing to close around it shows some strength.
The candle looks like a strong bullish one with a small upper wick, hinting buyers stayed in control right till the close. Tomorrow is a weekly expiry session, and with the put-call ratio at 0.99, it could be a session where either side holds the edge.
🛡 5 Min Intraday Chart with Levels
📉 Daily Time Frame Chart with Intraday Levels
🕯 Daily Candle Breakdown
Open: 24,306.85
High: 24,458.65
Low: 24,287.10
Close: 24,430.35
Change: +159.50 (+0.66%)
🏗️ Structure Breakdown
Type: Strong Bullish — buyers stayed in control through most of the session
Range: ≈ 172 points — moderate volatility
Body: ≈ 123.5 points — shows buyers held onto most of the gains right up to the close
Upper Wick: ≈ 28.3 points — a small rejection near the highs, nothing that looks like heavy supply
Lower Wick: ≈ 19.75 points — minimal selling pressure at the lows, the dip got bought fast
🛡 5 Min Intraday Chart
⚔️ Gladiator Strategy Update
ATR: 230.80
IB Range: 108.70 → Medium
Market Structure: Balanced
Trade Highlights:
09:45 Long Trade: Target Hit (R:R 1:2.28)
13:46 Short Trade: Target Hit (R:R 1:1.63)
Trade Summary: Both trades worked well today — the long trade in the morning caught the move away from the base at 24,287.10 and hit target with a solid 1:2.28 reward. The quick short trade in the afternoon caught the breakdown and hit target too, at 1:1.63. Two clean trades and two targets hit feels good, but I’d rather credit the system doing its job than anything special from me.
🧱 Support & Resistance Levels
Resistance Zones: 24480 ~ 24510 | 24600
Support Zones: 24350 | 24285 ~ 24235 | 24160
🧠 Final Thoughts
“Holding a level isn’t glamorous, but sometimes just not giving it back is the whole win.”
What stood out to me today was how many times Nifty tried 24,450 and got turned back, yet never really broke down either. The bounce off PDH after that 1:40 PM failure felt like buyers weren’t ready to let go of the day just yet.
For tomorrow, 24480 ~ 24510 is the zone I’m watching on the upside — if that goes, 24600 opens up. On the downside, 24350 and then 24285 ~ 24235 are the levels that matter; if those hold, this range could continue a bit longer.
Being a weekly expiry day with the PCR near 0.99, I’ll stay a little more careful with position sizing and let the first hour settle before doing much.
✏️ Disclaimer
This is my personal digital diary and represents my own analysis and point of view. It is not financial advice; please consult a professional advisor before making any trading decisions.
CRT Provides the Context. SMC Povides the ExecutionA Confirmation-Based Execution Framework
One of the biggest shifts in my trading wasn’t discovering another pattern.
It was changing when I decided to participate.
For a long time, I treated CRT as an entry model.
Now I treat it as a confirmation framework that guides my Smart Money Concepts execution.
That single adjustment has completely changed the way I approach the market.
⸻
The Mistake I Was Making
When price swept liquidity, I immediately started looking for an entry.
Sometimes it worked.
Sometimes it didn’t.
What I eventually realized was this:
A liquidity event alone does not automatically confirm directional intent.
It simply tells me that liquidity has been accessed.
The market still has to prove what it wants to do next.
That realization taught me the value of patience.
⸻
Candle One Creates My Framework
Everything begins with Candle One.
I mark its range.
• High
• Low
Nothing else.
At this stage, I have no bias based solely on the pattern.
I’m simply identifying the area where I expect the market to reveal information.
Think of Candle One as the map—not the destination.
⸻
Liquidity Is Information, Not an Entry
This was another major realization.
Many traders see a liquidity sweep and immediately assume continuation.
I no longer view it that way.
A wick beyond the range only tells me one thing:
Liquidity has been interacted with.
It does not automatically confirm acceptance in that direction.
That distinction changed my execution.
⸻
My Confirmation Rule
This is the rule that now defines my execution model.
After liquidity is taken, I wait.
Whether I’m using a two-candle or three-candle CRT framework, I want to see a candle body close beyond Candle One’s range before I begin looking for entries.
For me, that body close represents stronger confirmation than a wick alone.
It tells me the market has shown greater commitment before I risk capital.
This isn’t about predicting.
It’s about allowing the market to reveal intent.
⸻
Where Smart Money Concepts Takes Over
Once higher-timeframe confirmation is established, CRT has done its job.
Now my execution begins.
I shift to the lower timeframe and begin searching for:
• Liquidity sweeps
• Market Structure Shift (CHoCH)
• Displacement
• Order Block mitigation
• Precise execution
CRT provides my higher-timeframe confirmation.
SMC provides my lower-timeframe precision.
The two work together—not separately.
⸻
Why This Changed My Trading
The biggest improvement wasn’t finding more setups.
It was filtering out unnecessary ones.
Waiting for confirmation forces patience.
Patience improves decision-making.
Better decisions improve consistency.
The market will always create another opportunity.
My job is simply to wait until the odds improve.
⸻
Final Thoughts
This isn’t presented as the only way to interpret CRT.
It’s simply the confirmation-based execution framework that has improved my decision-making.
Every trader develops rules that fit their personality.
This is one of mine.
I no longer rush to participate because liquidity has been taken.
I wait for the market to confirm its intent.
Then I allow Smart Money Concepts to refine the execution.
CRT provides the context.
SMC provides the execution.
And for me, that distinction has made all the difference.
APP 520 August call, plus another leg after a Higher Low??AI stocks are under attack and I foresee this continuing for a little bit maybe July/August before we see a strong turnaround.
Software stocks MSFT, APP, NOW... now, NO PUN INTENDED, have a little wiggle room to prove their worth. As money rotates to these sectors/areas, we saw APP price break down to the lowet trendline and buyers stepped in.
1. This past week, we saw price close above the weekly 20ma, which has been a springboard for APP to get rolling.
2. Third touch of trendline support
3. Each touch of the bottom trendline has yielded a higher high
Gold next Week SET UPthe price action is at rock bottom point; the bullish engolfing has shown a great potential that buyers are getting inside the market, that means that it will keep pushing up. So the normal process is idication ; consolidation then continuation , and we have just experience the first phase idication, for a day trader we may look for an entry once the price hits premium
EURUSD: Support & Resistance Analysis for Next Week 🇪🇺🇺🇸
Here is my latest structure analysis and important
supports & resistances for EURUSD for next week.
Consider these structures for pullback/breakout trading.
❤️Please, support my work with like, thank you!❤️
I am part of Trade Nation's Influencer program and receive a monthly fee for using their TradingView charts in my analysis.
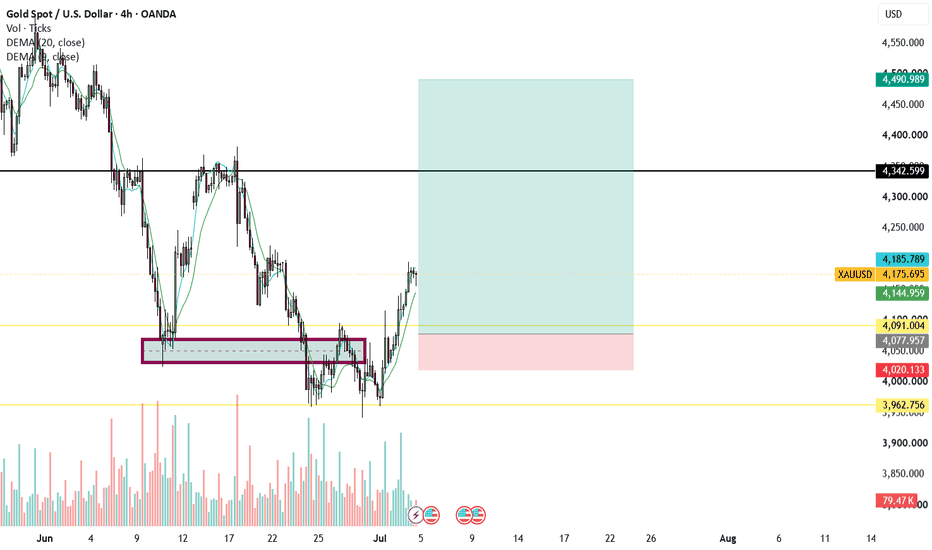
GOLD (XAUUSD): Support & Resistance Analysis For Next Week
Here is my latest structure analysis for Gold:
Support 1: 4085 - 4116 area
Support 2: 3944 - 4000 area
Support 3: 3886 - 3931 area
Resistance 1: 4190 - 4421 area
Resistance 2: 4330 - 4435 area
Resistance 3: 4570 - 4594 area
Resistance 4: 4637 - 4687 area
Consider these structures for pullback/breakout trading.
❤️Please, support my work with like, thank you!❤️
I am part of Trade Nation's Influencer program and receive a monthly fee for using their TradingView charts in my analysis.
ICT Traders - Dont Make This Mistake When Executing!!I missed two of the cleanest BTC long setups I've seen in months. Not because the setups weren't there, because I was waiting for perfection that never came.
In this video I walk through exactly what I saw, why I hesitated twice, and what I should have done differently. Full breakdown from the weekly bias all the way down to the one hour entry model using ICT methodology.
Here's what happened:
1. Weekly and daily both gave me a clear bullish bias after sweeping 60K.
2. The lower timeframes gave me two textbook entries: liquidity swept, break of market structure confirmed, OTE level with an inverted fair value gap on the second setup. Both ticked every box. I still didn't pull the trigger.
3. The first time I was waiting for price to come back into a fair value gap that it never tapped.
4. The second time frustration from missing the first entry clouded my judgment. Both setups hit their targets.
The lesson: a good setup taken is worth infinitely more than a perfect setup missed. When liquidity, market structure and your OTE level all line up, that is your signal. Nothing else needs to happen.
If you've ever watched a trade move without you this week, this video is for you. Have you missed a trade waiting for perfection? Drop it in the comments.
Nifty Analysis EOD – July 3, 2026 – Friday🟢 Nifty Analysis EOD – July 3, 2026 – Friday 🔴
Gap and Grind: Bulls Fade From the Open as Nifty Slips Below IBL to 24,271
🗞 Nifty Summary
Nifty opened with a 210-point gap above the 24,335 resistance zone, but the strength didn’t last long — an 83-point fall from the open (Open = High candle) showed sellers were active from the first tick itself. Most of the session then settled into a tight 50-point range, with both sides getting trapped in fakeouts along the way.
Around 1:30 PM, the index broke below IBL and extended another 42 points, eventually closing at 24,271.6, below the IBL. The day still ended in positive territory overall, but it felt like bears were in control for most of the session, with sellers doing damage control just to protect the gap-up open.
BankNifty seemed to be the one disturbing sentiment today — it tested its previous day low even while Nifty was holding above PDH. For the next session, a gap-fill looks possible. An opening above 24,335 might keep the bullish trend going without needing to fill the gap first. The candle itself looked like a strong bearish one despite the green close, and Monday’s opening tick should give more clarity on which way this settles.
🛡 5 Min Intraday Chart with Levels
📉 Daily Time Frame Chart with Intraday Levels
🕯 Daily Candle Breakdown
Open: 24,375.65
High: 24,378.15
Low: 24,252.35
Close: 24,270.85
Change: +95.15 (+0.39%)
🏗️ Structure Breakdown
Type: Strong Bearish — sellers took over almost right after the open
Range: ≈ 125.8 points — low volatility
Body: ≈ 104.8 points — reflects steady seller pressure through the session
Upper Wick: ≈ 2.5 points — barely any, bulls didn’t get a chance near the top
Lower Wick: ≈ 18.5 points — a small attempt at demand, but not enough to change the tone
🛡 5 Min Intraday Chart
⚔️ Gladiator Strategy Update
ATR: 235.58
IB Range: 83 → Medium
Market Structure: ImBalanced
Trade Highlights:
11:59 Long Trade: SL Hit
13:04 Short Trade: Target Hit (R:R 1:2.23)
Trade Summary: The long trade got stopped out, which happens when the open behaves this way. The short trade around 1 PM worked out well, catching the IBL breakdown for a solid R:R of 1:2.23. Net net, the system did its job today even with one loss on the board. Still a learner in days like this, letting the setups play out instead of forcing anything.
🧱 Support & Resistance Levels
Resistance Zones: 24,189 | 24,235 ~ 24,285 | 24,335
Support Zones: 24,125 | 24,050 | 23,970
🧠 Final Thoughts
“A green close can still feel like a red day if the sellers never really left the room.”
Today looked like a classic gap-and-fade — the open promised one thing and the session delivered another, with bears quietly doing the damage control work under a positive headline number.
For Monday, a gap-fill toward 24,189 or lower looks possible early on. If 24,335 gets reclaimed and held, the bullish trend might continue without needing to fill that gap at all — but until then, it’s better to treat this as a range with two-sided risk.
Staying a conservative trader here feels right — no need to guess Monday’s open, just wait for the first tick and let the structure show itself before picking a side.
✏️ Disclaimer
This is my personal digital diary and represents my own analysis and point of view. It is not financial advice; please consult a professional advisor before making any trading decisions.
$BTC - Market Update (7/4)CRYPTOCAP:BTC tagged 63.5k, though the move is looking a bit shaky now, while CRYPTOCAP:ETH is holding up much better.
Spot have been selling into strength, offloading $28.6M in the last hour. Major sell wall is resting at 63.5s ($34.1M), so BTC may struggle to push much higher unless spot buyers' step in.
Most of the current selling is coming from Hyperliquid, while the slight rise in open interest on Bybit suggests new shorts are starting to enter, adding to the spot selling coming from Coinbase.
Not a bad spot to take partial profits here. We'll be looking to re-enter if 61.5k-61k holds.
Have a great weekend!
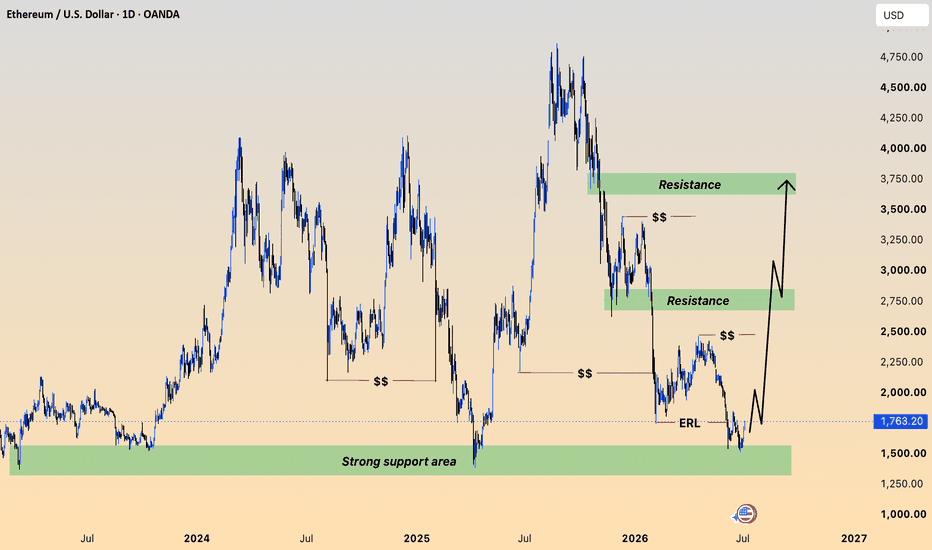
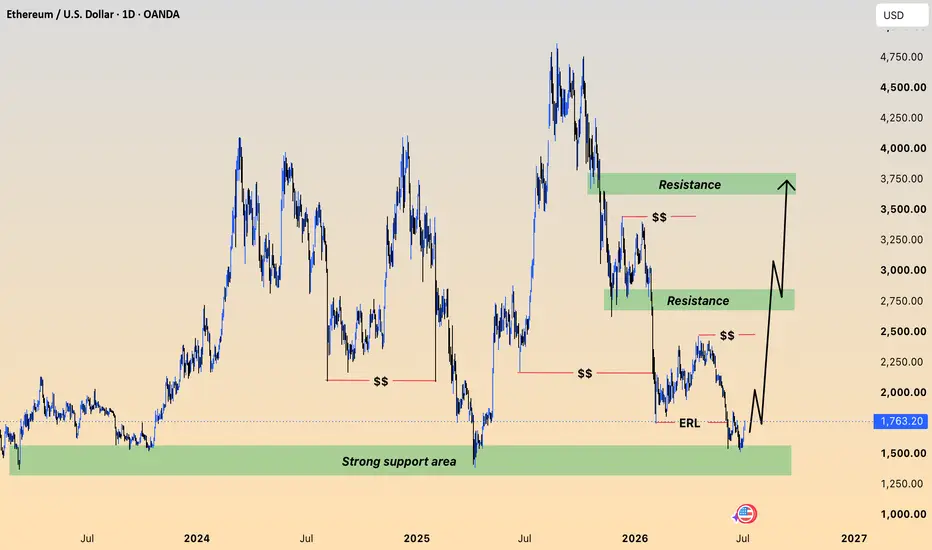
ETHUSD Daily Outlook | Recovery Begins from Major Demand ZoneEthereum is approaching a pivotal point after finding support at a key long-term demand area. The current reaction suggests buyers are stepping back into the market, increasing the likelihood of a bullish recovery.
If momentum continues to build, ETH could challenge the first resistance near $2,800, followed by the higher supply zone around $3,700.
What to Watch
* Strong defense of the current support zone.
* Bullish confirmation on higher highs.
* Break above nearby resistance.
* Continuation toward higher liquidity targets.
Successful traders follow structure, manage risk, and never force trades.
Not Financial Advice.
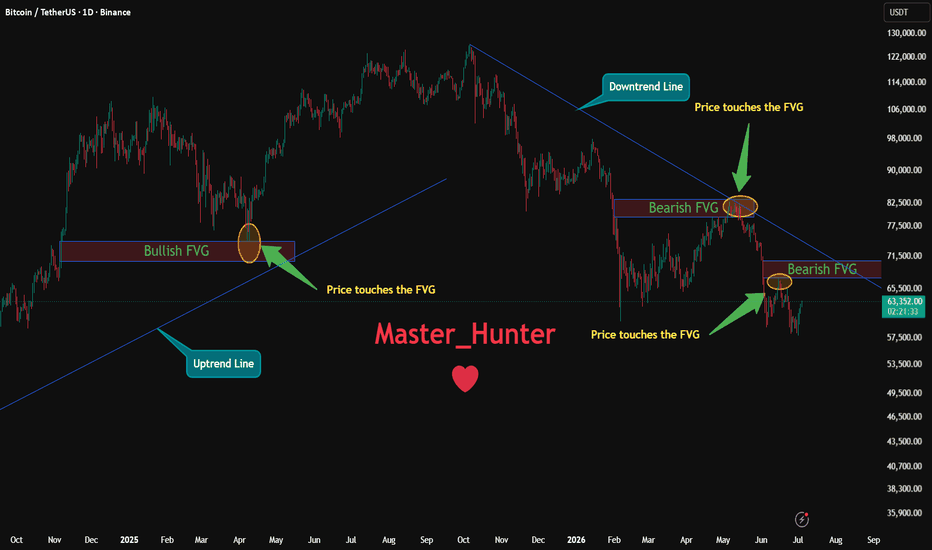
Master Fair Value Gaps (FVG): The Hidden Price Magnets SM UsesFair Value Gap is one of the most powerful concepts in modern Price Action and Smart Money Concepts (SMC). It represents an imbalance in the market — a zone where price moved so quickly that it left behind an "inefficiency" or gap between candles.
These gaps act like magnets. Price often returns to fill them before continuing the trend.
What is a Fair Value Gap?
A 3-candle pattern where the first and third candles have a gap between their wicks/bodies.
Bullish FVG: Price gaps up aggressively (low of candle 3 > high of candle 1).
Bearish FVG: Price gaps down aggressively (high of candle 3 < low of candle 1).
The middle candle shows the strong impulsive move that created the inefficiency.
How to Trade FVGs Like a Pro
Bullish FVG → Potential Support (buy zone) when price pulls back into it.
Bearish FVG → Potential Resistance (sell zone).
Best setups happen when FVG aligns with Order Blocks, previous highs/lows, or trend direction.
Look for mitigation (price entering the gap) + strong rejection (pin bar, engulfing, etc.).
Real Examples Right Now
Bitcoin ( BINANCE:BTCUSDT ): In this example, I have tried to show you both a Bullish and a Bearish example, and I have also identified the price action and reaction points for you..
Pro Tips for High Win-Rate
Higher timeframe FVGs (4H & Daily) are much stronger than lower timeframe ones.
Combine with Order Blocks or Break of Structure (BOS) for confluence.
Use tight stops just outside the FVG.
In ranging markets, FVGs get filled quickly — in strong trends, they can act as continuation zones.
Always wait for confirmation (candle rejection) instead of blindly trading into the gap.
Start hunting Fair Value Gaps on your charts this week. Once you see how price respects them, you’ll never ignore them again!
Have you traded FVGs before?
Which market are you spotting them in right now? Share your experience below 👇
BTCUSD Daily Forecast | Bears Target the $50K Demand ZoneBitcoin continues respecting the bearish market structure after rejecting a key resistance area. The latest price action suggests sellers remain dominant, increasing the probability of a move toward the next high-liquidity demand zone.
The $49,600–$50,000 support region is expected to be a critical level where institutional buying interest could emerge.
Market Structure
* Bearish trend remains intact.
* Strong rejection from resistance.
* Liquidity below recent lows remains attractive.
* Key support located around $50K.
* Watch for bullish confirmation before considering long positions.
Key Levels
* Resistance: 72K–74K Zone
* Major Resistance: 80K–83K Zone
* Support Target: 49.6K–50K
Patience and discipline create consistency in trading.
Not Financial Advice.
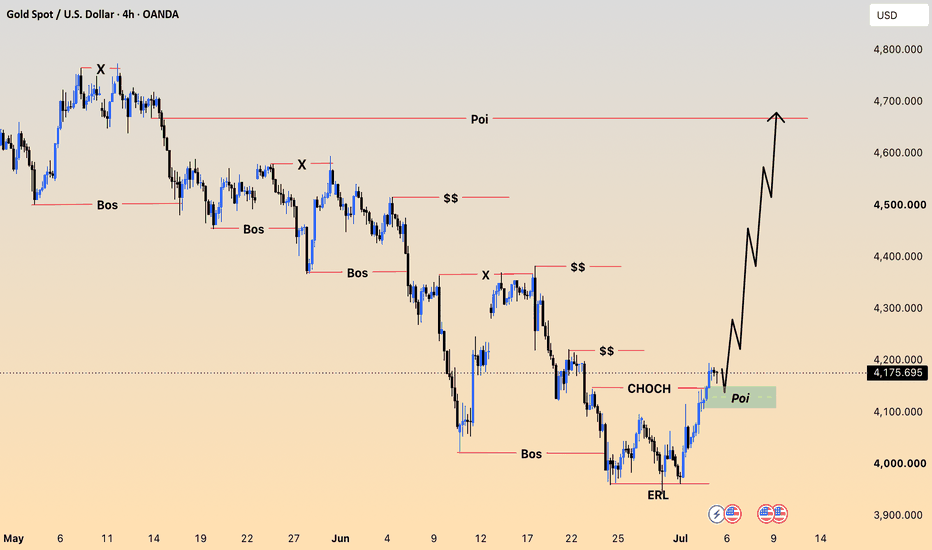
XAUUSD SMC Analysis | Buyers Return After CHoCH Confirmation Gold is showing classic Smart Money Concepts behavior. Following a prolonged bearish trend, price swept liquidity, formed a CHoCH, and reclaimed a high-probability Point of Interest (POI).
This structure often signals the beginning of a bullish expansion, provided buyers continue defending the current demand zone.
Analysis Highlights
* Bullish market structure shift.
* Institutional demand respected.
* Liquidity engineered below recent lows.
* Strong probability of continuation if confirmation holds.
* Higher timeframe target remains the major POI around 4670.
Always wait for confirmation before entering any trade and manage your risk accordingly.
Not Financial Advice.