OP: bounce ahead or more downside? key levels to watch nowOP – tired of bleeding or loading for a bounce?
L2 headlines keep popping up again, with new ecosystem incentives and governance talk, but OP is still parked near its local lows. According to the market, interest in L2s is picking up, while OP quietly sits on a key demand zone - that combo often gives decent mean-reversion moves.
On the 4H chart price is grinding sideways above support around 0.18 with a fat volume node near 0.19 and RSI hovering in the middle after a strong oversold reset. Fo
Relative Strength Index (RSI)
RBLX — Bearish Trend Continuation (Sell Setup) 20-40 daysWe are initiating a Sell on RBLX based on a bearish trend-continuation structure. The technical backdrop remains weak: price is trading decisively below both the 50- and 200-period moving averages, while ADX (~28) confirms an active directional trend rather than a range-bound environment. Momentum indicators remain subdued, with RSI in the high-30s, leaving additional downside room toward the next structural support near $60.07.
Order flow currently reads as neutral, providing no strong accum
STRK: falling knife or hidden gem? key levels to watchSTRK. Still hoping this thing suddenly moons after the airdrop hype? While the ecosystem keeps dropping “growth” headlines, the market is clearly focused on unlocks and fresh supply, and you can see it in the price action – every bounce gets sold almost instantly. According to industry sources, funds are still rotating into majors, so small caps like STRK are left to fend for themselves.
On the 4H chart we’re in a clean downtrend, and the last bounce stalled right under the main volume node a
PENGU: ready for a surge? key levels to watch for the days aheadPENGU – ready for round two or just a dead cat bounce? Meme coins are back on the radar as traders rotate into high-beta names again, and according to the market there’s fresh speculative flow into small-cap animals. PENGU just printed its first real impulse after a long bleed, so eyes are on whether this is the start of a trend or a one-off pump.
On the 4H chart price ripped off the lows and is now pulling back into the first demand zone around the recent breakout. RSI cooled down from overb
MVX: knife catching or caution? key levels to monitor nowMVX. Who’s trying to catch this knife and who’s just watching with popcorn? While majors steal the spotlight, smaller perp tokens like MVX are getting aggressively de‑leveraged, and this one just did a full waterfall into historical demand.
On the 4H chart we’re sitting right on that 1.8–2.0 demand zone, RSI is buried under 20 and starting to curl, and the last leg down came with a clear volume spike that smells like capitulation. With price trading well below the main volume cluster above, I’m
IP: catching a knife or waiting for bounce? key levels aheadIP
Catching this knife or letting it bounce first? While majors are chilling after the latest volatility spike, small caps like IP are quietly building bases - according to market chatter, leverage in alts has been flushed and fresh spot buyers are creeping back in. On 4H we’ve got a long bleed, capitulation wick and now a flat shelf right on a strong demand zone around 1.10.
On the 4H chart price hugs that green support with declining sell volume, and the volume profile shows a fat liquid
I
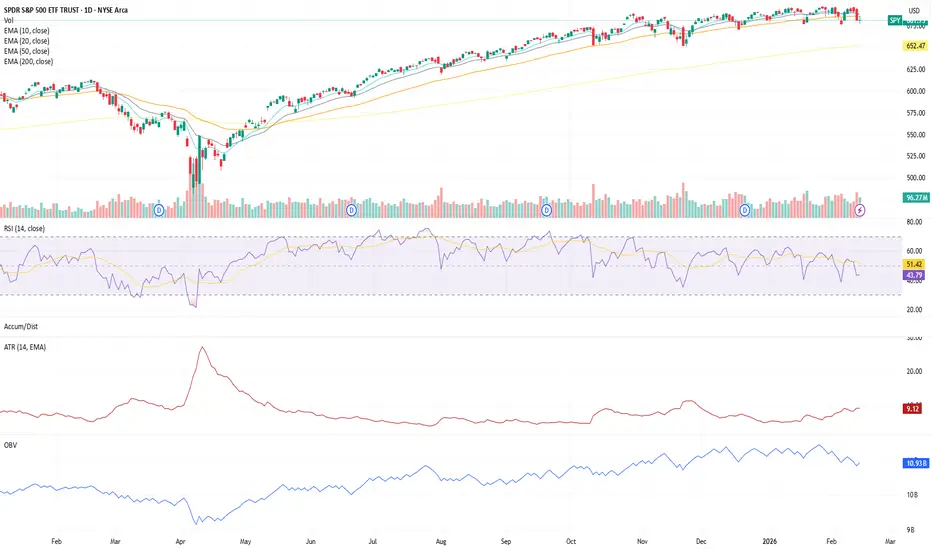
SPY Structure Update (Daily)No predictions. Just structure.
Price closed just beneath the 50 EMA, with the broader EMA stack still holding alignment above the 200. The trend has not broken, but short-term pressure is testing the intermediate level.
Momentum & Participation
• RSI (14)
Short-term RSI is attempting a minor uptick (43.79), while longer-term RSI sits near 51.42 and continues to drift lower.
This reflects short-term stabilization inside a broader momentum slowdown — not expansion.
• ATR
Volatility remains st
Flare: ready to break out? key levels and targets for todayFlare. Tired of watching only the majors while small caps sneak in the real moves? According to industry sources, Flare just got fresh attention around new data and DeFi integrations, and the price quietly reacted with a solid bounce from local lows. Market mood is still cautious, which is exactly when charts like this tend to surprise latecomers.
On the 4H chart we bounced cleanly from the green demand around 0.0090 and are now grinding just under a fat volume node and red supply near 0.0100
ARB: is the bounce finally here? key levels to watch todayARB. Tired of watching this thing bleed and asking if the bounce is finally real? After a brutal selloff, headlines around layer‑2 activity and renewed interest in scaling stories are slowly coming back, and the market stopped panic‑dumping this one. Today we see ARB stabilizing while the rest of the market cools off a bit, which is often how quiet reversals start.
On the 4H chart price is building a base above 0.11 after that waterfall move. RSI has ripped from oversold to above 60, and the vo
#TONUSDT Is Quietly Loading for a Breakout? –Trap for sellers
Yello Paradisers! Are you prepared for a potential #TONUSDT breakout while the majority is still emotionally reacting to the previous liquidity sweep?
💎#TON is forming a textbook inverse head and shoulders at the bottom of the descending channel support. Before the structure developed, price swept liquidity below the channel, triggering stop losses and forcing weak hands out. This liquidity grab is typical smart money behavior before accumulation phases. The bottom of the head formed at $1.126
TLong
TRUMP: ready for a bounce? key levels to watch for the next daysTRUMP. Tired of watching this election meme bleed or ready for the next squeeze? According to market chatter, the latest political headlines cooled off the whole election-narrative sector, so the hype premium got flushed out. Now price is sitting right on that big green demand zone where earlier buyers finally woke up.
On the 4H chart the trend is still clearly down, but we just bounced off support around 3.0 and started to grind sideways. RSI printed oversold and is curling up with a small bul
POL: ready for a rebound? key levels to watch in the coming daysPOL – tired of bleeding or just loading the spring for the next move? According to market sources, fresh headlines around the Polygon 2.0 migration and new incentives for builders lit up the ecosystem today, and intraday volume picked up right away. On the chart we’re sitting right on a chunky demand zone where buyers defended price several times already.
On the 4H, RSI bounced from oversold and is pushing above its signal line, while the visible range volume profile shows a fat node a bit hi
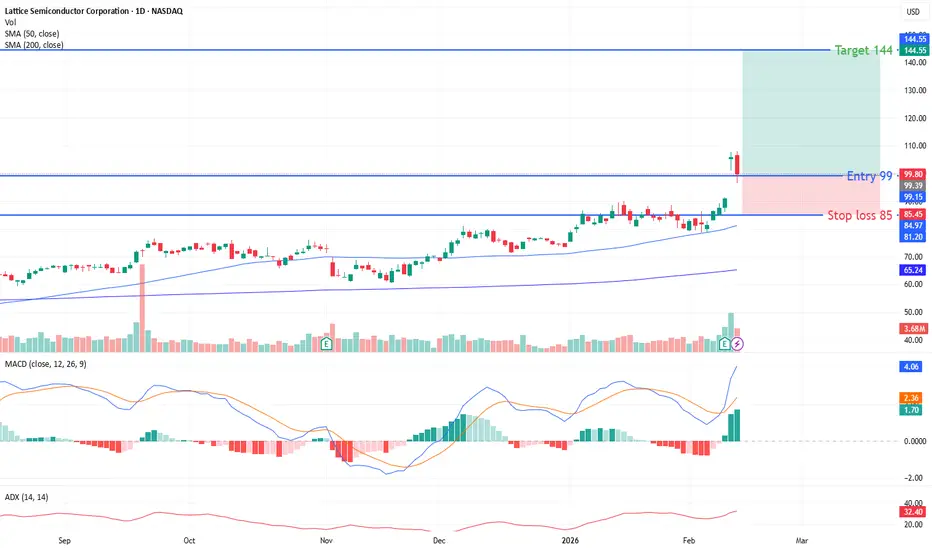
LSCC — Buy | Trend Continuation SetupBias: Bullish (Buy / Trend Continuation)
Entry zone: $99.27 – $100.38
Stop-loss: $85.41
Target 1 (conservative): $108.08
Target 2 (primary): $133.92
Estimated R:R: ~1:2.3 (to primary target)
Trade thesis:
LSCC remains in a strong uptrend, trading well above the 50- and 200-day moving averages while ADX (~32) confirms healthy directional strength. The recent pullback has occurred on very low volume, indicating constructive consolidation rather than distribution and supporting a continuation
WLD: potential breakout ahead? key levels to watch for todayWLD. Still watching this thing drip and wondering if the next move is finally up? AI coins are back on the radar after fresh headlines about new partnerships in the sector, while, according to the market, WLD is facing another wave of attention around supply and regulation. Volatility is waking up again right at a key support zone.
On the 4H chart price is sitting on a big demand block around 0.36–0.37, where we already saw a sharp wick and quick buyback. RSI bounced from oversold and is curlin
KAS: ready for a surprise rally? key levels and targets aheadKAS. Still watching this PoW rocket sleep after the last hype wave? Today the headlines talk about growing miner activity and new listing rumors, and according to industry sources network metrics are ticking up again while price is still stuck in the basement. That combo often gives us those nasty short squeezes when nobody expects them.
On the 4H chart price is sitting on a big volume node around 0.031 - 0.033 with RSI curling up from the mid zone, after a brutal flush into that green demand a
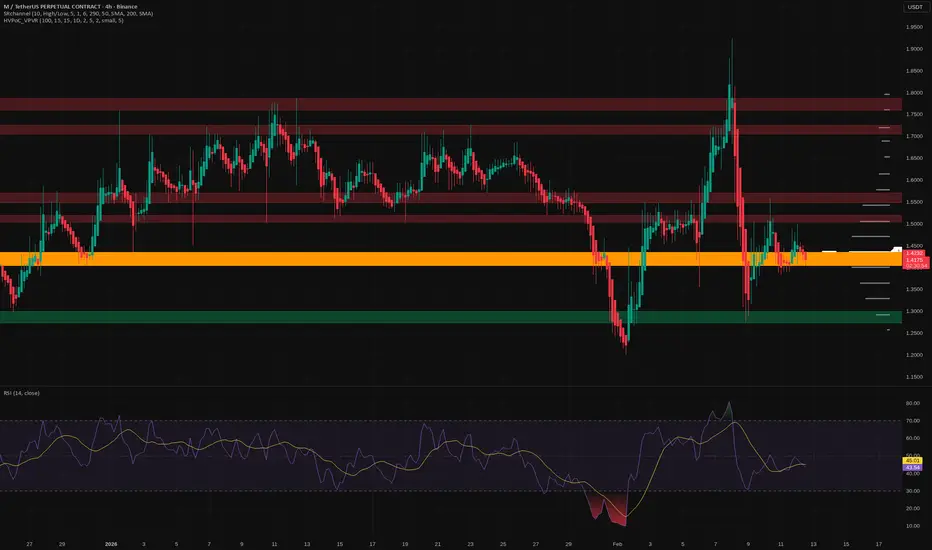
M: poised for a move? key levels and targets for todayM. Who’s bored of chasing BTC wicks and wants a clean alt setup instead? Lately liquidity has been rotating back into second-tier perps according to market desks, and M is sitting right on a fat 4H value area around 1.40 - that’s usually where smart money quietly reloads, not where it panic exits.
On the 4H chart price keeps hugging this orange HVN zone while RSI chills near 45 after cooling off from overbought. I’m leaning long from here: buyers defended this area after the last liquidation sp
ATYM (LONDON) – Strong Momentum Stock Digesting Gains Near HighsAtalaya Mining has been a standout over the past year, up roughly 140% and trending consistently higher. The chart shows a clean series of higher highs and higher lows, which is exactly what you want to see in a sustained move. The company is a copper producer focused on Spain, giving it direct exposure to the broader electrification and infrastructure build-out theme.
On the business side, production has remained steady and copper pricing has been supportive. Tight supply and long term d
ENA: is this the moment to buy? key levels and targets aheadENA. Thinking this thing is dead, or is the crowd just giving up at the worst moment? According to industry sources, yield and restaking tokens have been under pressure again after fresh headlines about tighter oversight and cooling demand, and ENA has been sold with the rest of the basket. On the 4H chart we’re now sitting right on a big demand zone around 0.10 where price previously bounced.
Technically, trend is still heavy, but RSI is hugging the oversold area and each new low comes on slig
Pi Network: is it time to short? key levels and targets aheadPi Network. Thinking about catching this dip, or letting it bleed first? Altcoins are getting hammered again after the latest risk-off wave in crypto, and Pi is no exception - every bounce is being sold. According to the current market mood, speculative coins are being used as an ATM to cover risk elsewhere.
On the 4H chart price is in a clean staircase downtrend, trading below the main volume cluster near 0.155 and having flipped 0.14 from support to resistance. RSI is buried in oversold, so I
ESPR (USA) - Cardiovascular Biotech Consolidation Before EarningEsperion Therapeutics has had a strong run over the last year, gaining about 80% over the year, but a tremendous 300% since the May '25 lows as it carves out a niche in the cholesterol management space. Based in Michigan, they focus on oral therapies for patients who can't get their LDL levels down with standard statins. The stock has shown significant momentum recently, largely thanks to its non-statin treatments gaining traction in a market that is increasingly looking for alternatives to
E
Ethereum Classic (ETC): breakdown impending? key levels to watchEthereum Classic – ready for one more leg down or a sneaky short squeeze? Lately the headlines around older PoW coins are all about fading interest while liquidity migrates into the majors, and according to the market that’s exactly how ETC is trading. Add in the recent risk‑off mood across alts, and buyers here look pretty shy.
On the 4H chart price is stuck in a tight range with lower highs, pressing on support around 8.1–8.2 – classic bear flag vibes for me. RSI keeps failing near the midlin
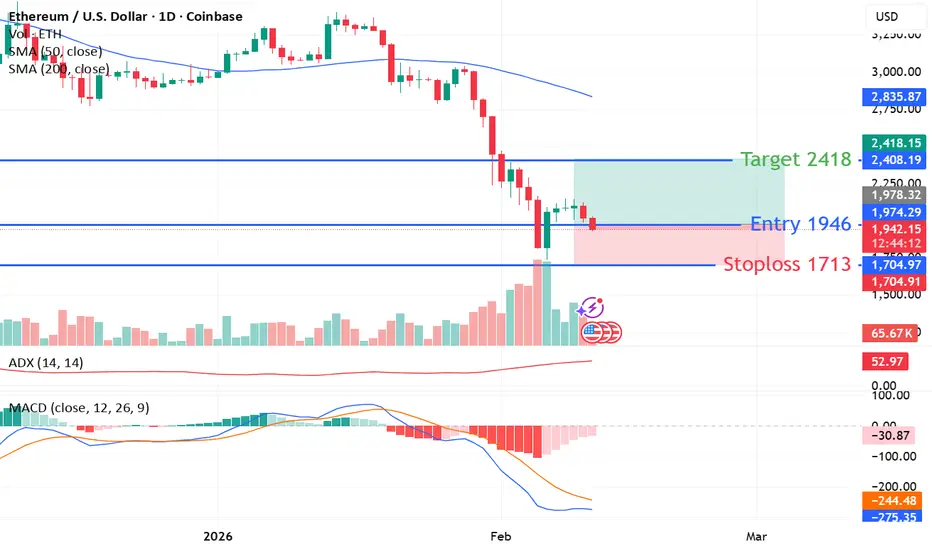
ETHUSDT — Mean Reversion Long SetupWe are initiating a BUY on ETHUSDT within the defined entry zone 1946.78–1982.12, following the Mean Reversion strategy. The setup is supported by high technical conviction, a deeply oversold RSI structure, and bullish order-flow absorption combined with very low volume during the recent pullback, indicating consolidation rather than active distribution.
Trend strength (ADX) remains elevated, suggesting that once direction stabilizes, moves may accelerate. While strong ADX environments can pr
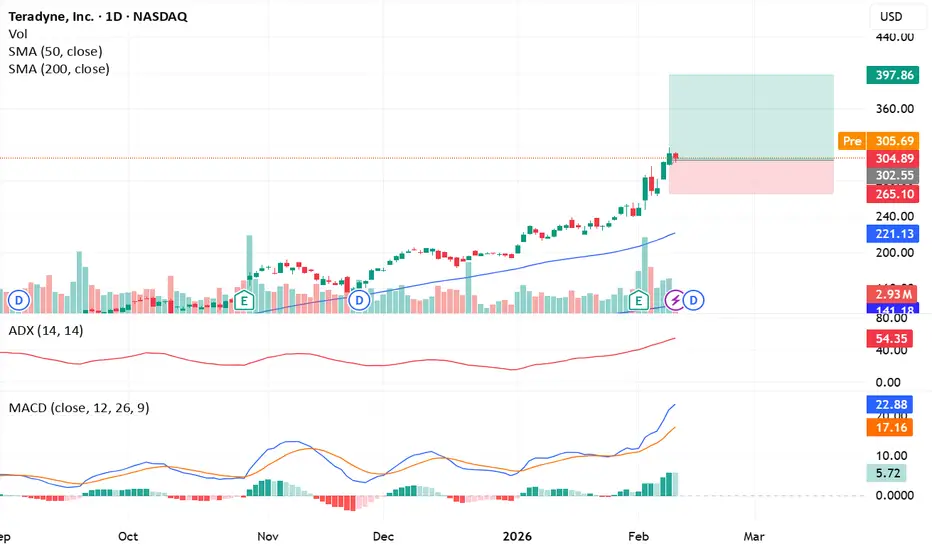
TER — Trend Continuation Long IdeaBias: Trend-continuation long with disciplined risk management to account for near-term consolidation risk.
Initiating a Buy on TER from the entry zone 302.81–305.82, as the broader technical structure remains orderly and trend strength is elevated (ADX ~54), indicating sustained directional momentum. The most recent pullback occurred on relatively light volume, suggesting limited distribution and reinforcing the case for continuation rather than reversal.
Price continues to trade above key l
Bitcoin's weekly MACD & RSI —The bottom is inBitcoin's weekly MACD just hit a new all-time low. The previous ATL happened July 2022.
The histogram hit bottom late November 2025. From this point forward, the MACD can start to recover to trend upward long-term. It will not go any lower.
BTCUSDT MACD (W):
Bitcoin's weekly RSI just hit the lowest point since June 2022, the second lowest reading ever. It is also the second time Bitcoin's weekly RSI enters oversold territory. It will start to recover to trend higher long-term. This is the bo