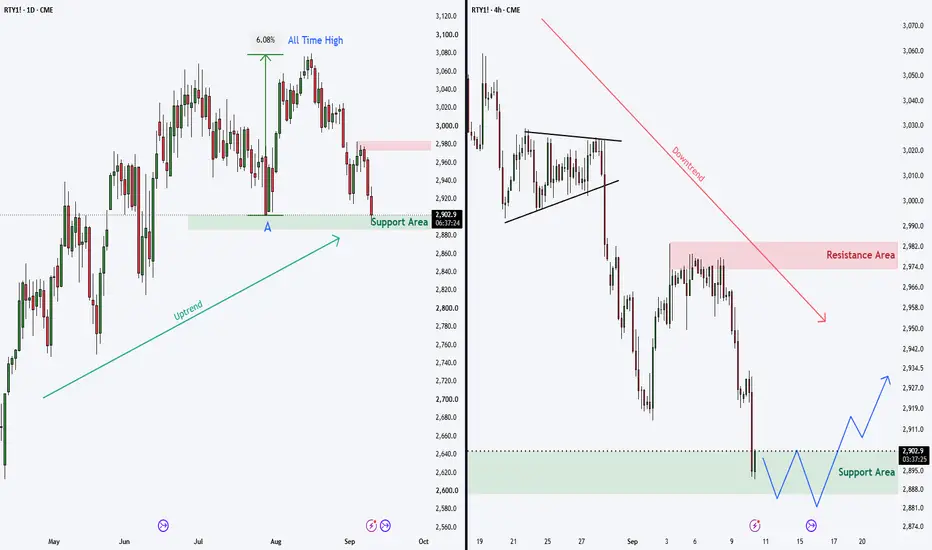
RTY1! / RUSSELL 2000 Multiple Timeframes
RTY1! Multiple Timeframe Analysis:
On the Daily chart (LEFT), we can see that this price zone (A) previously acted as support and led to a strong +6% move to a new all-time high. The Daily chart is still in an uptrend.
However, the 4H chart (RIGHT) is trending steadily lower, and at the moment there is no clear sign that the downtrend is coming to an end.
Since the Daily trend (LEFT) remains intact, we could potentially see a bullish reversal if a double bottom, a breakdown failure, or a s
Shooting Star
CADJPY 4H: Bullish Reversal Setup Off Key Support Zone Overview & Setup Parameters
Pair / Timeframe: CAD/JPY (4-Hour Chart)
Current Trading Price: ~111.334
Bias: Long / Bullish Reversal
Key Support Zone (Entry Zone): 110.830 – 111.330
Target Resistance (Take Profit): 113.340 – 113.500
Invalidation / Stop Loss: Below 110.500 (below major structural low)
📉 Technical Analysis
Major Support Test: CAD/JPY has retested a major horizontal support zone around 110.830–111.000, which historically held as a key structural base in late July / early Augu
Tactical Risk-Off Broadens as MES Loses 7,670Tactical Risk-Off Broadens as MES Loses 7,670
Market Regime: Tactical Risk-Off / Downside Continuation
Macro Regime: Hostile Tilt
Systemic Stress: Not confirmed
Confidence: High
Wednesday confirmed that the market’s narrow repair attempt had failed.
MES lost the 7,670.50–7,682.25 support band and remained below it during the evening review. The significance was not limited to the index decline: equal weight, small caps, sectors and global equities broadly confirmed the deterioration.
A growi
SNR MODEL (QML & COL) | Advanced Support & Resistance Framework
The SNR Model (Support & Resistance) with QML (Quasimodo Level) and COL (Change of Level) is an advanced price-action framework used to identify high-probability reversal and continuation zones.
Traditional traders see support and resistance as simple lines, but professional traders understand them as institutional decision areas where liquidity, order flow, and market structure interact.
The combination of SNR + QML + COL helps traders identify where smart money may enter, exit, or reverse t
Tesla: Shooting star, MA Cross rejection, 328x P/E. Short trade!The following video has an analysis of Tesla along with the short trade setup that I have created as of 8 September 2026, which is the next day after Tesla's launch of Cybercab in Austin had triggered a federal audit inquiry on the very day commercial services began where NHTSA audited Tesla for self-certification of a car with no steering wheel, no pedals, and no mirrors as being road legal according to federal safety standards. Considering Tesla's forward price to earnings ratio is 328 times w
Gold (XAUUSD) — Liquidity Grab at Trendline, Eyes on the Bullish**Gold (XAUUSD) — Liquidity Grab at Trendline, Eyes on the Bullish OB 🟡📉**
Price just swept the highs of a descending trendline that's been capping rallies since the 4,520 top — classic **liquidity grab** before rejection. Since that grab near 4,440, price has been carving out a bearish channel, printing lower highs and lower lows straight into the 4,400 zone.
**What the chart is showing:**
🔸 **Liquidity Grab (~4,440):** Price wicked above the descending trendline, triggering breakout buy sto
GBP/USD setup: Ascending channel retest & key support zones
Technical Analysis
Trend & Structure: GBP/USD on the 4-hour timeframe is respecting an ascending channel / trendline originating from the July lows (~1.3150). Price action shows higher highs and higher lows overall.
Key Support Zones:
Immediate Support / Flip Zone: The 1.3540–1.3550 area acts as a pivot zone (former resistance now behaving as support/resistance).
Major Horizontal Support: Located around 1.3437, which coincides with the primary ascending trendline and a previous consolida
GOLD - The market is under pressure from a bearish trend ICMARKETS:XAUUSD remains in a local bearish trend, while consolidation below the 4,435 liquidity zone is becoming a technical catalyst for further downside
The dollar is stagnating, but at the same time, it is weakening due to interventions by the Bank of Japan. Gold looks weak against this backdrop, especially given the Fed’s medium-term hawkish stance. Geopolitical risks and inflation expectations that could limit further upside remain in place. The key event of the week will be the U.S.
GBP/USD 2H | Breakout Setup with Bullish TargetsGBP/USD is showing a potential bullish breakout from the descending structure after holding the support zone. A confirmed breakout could open the way toward the 1st target at 1.3560, followed by the 2nd target near 1.3609.
Key focus: breakout confirmation and support holding.
NAS100 Bullish Breakout — Target 29,746NAS100 has broken above the key **29,200 resistance**, confirming bullish momentum. Price is now holding above the breakout area, while the marked **FVG around 29,350–29,400** could act as a potential pullback/support zone. As long as price remains above the breakout level, the bullish setup remains valid.
🎯 **Target:** 29,746
🛡️ **Key Support:** 29,200
📌 **Potential Entry:** Pullback into the FVG / breakout zone
📈 **Bias:** Bullish
ETH/USD Bearish Rejection — Targets 2,434 & 2,385
ETH/USD is showing a **bearish rejection from the strong resistance zone around 2,530–2,540**. Price has dropped sharply after failing to break higher, suggesting sellers are taking control. The marked **FVG around 2,480–2,520** could act as a pullback/retest zone before further downside.
🎯 **1st Target:** 2,434
🎯 **2nd Target:** 2,385
🔴 **Strong Resistance:** 2,530–2,540
🟢 **Support Zone:** 2,375–2,385
📉 **Bias:** Bearish below 2,490
Gold is consolidating, waiting for important news.Based on the chart you sent, the current structure of XAU/USD is quite clear: price is being squeezed between the descending trendline above and the 4,382 support zone below.
🔴 Resistance
1. 4,440 – 4,450: Near-term and important resistance
This is the Resistance Zone on the chart.
It is also located close to the descending trendline.
If price reaches this area but gets rejected → the probability of a move back to 4,382 is quite high.
If an M30/H1 candle closes clearly above 4,440–4,450, the
ETHUSDT - The Hunt for Liquidity Ahead of a Bullish Rally BINANCE:ETHUSDT.P continues to consolidate within the 2,350–2,550 range. Resistance has been confirmed and is acting as an important trigger. A breakout above 2,550 could trigger a rally higher, but...
Bitcoin has been consolidating near resistance for the third consecutive week, suggesting that the bulls may still be interested in pushing prices higher. Ethereum is also consolidating. A scenario involving a long squeeze of support before the next move higher remains possible. Such a move
GOLD - The price remained within the range following the NFPICMARKETS:XAUUSD is reacting to Friday’s NFP data with a fairly strong sell-off. However, the market is aggressively buying the dip. What should we expect from the market on Monday?
The dollar remains weak, but toward the end of Friday’s trading session, the market gave back part of the bullish impulse, providing some support for the dollar.
The main focus remains on geopolitical developments and upcoming economic data, including PPI and CPI.
Technically, I expect a correction toward 4,396
Headline Indices Repair, but Breadth Still Refuses to ConfirmMarket Regime: Mixed / Narrow Leadership / Tactical Caution
Macro Regime: Long-End Yield Pressure / Hostile Tilt
Systemic Stress: Not confirmed
Confidence: High
The shortened trading week begins with MES and MNQ holding repaired structures, but the broader market still has not confirmed the strength displayed by the capitalization-weighted indices.
Because Monday was a market holiday, the latest cash-market breadth and internal readings remain Friday’s information. Tuesday’s opening participat
EURUSD H4: Rebound from Support Target Resistance at 1.1704Technical Analysis
Timeframe: 4-Hour (H4)
Current Price: ~1.1630
Trendline Breakout & Consolidation: The price broke above the key descending trendline that capped lower highs throughout late August. It is currently forming a tight bullish consolidation (bull flag pattern) just above the breakout point.
Support Zone (1.1584 – 1.1600): A demand zone highlighted on the chart. Notice the long lower wick on September 1–3, showing strong rejection of lower prices at the 1.1584 level.
Resistance
Naqi Water Company (2282) : Trendline Breakout is Required !TADAWUL:2282
🚀 Bulls Taking Control — 60–63 Is the Breakout Zone
The bulls appear to be gradually taking control, with price attempting to break out of the long-standing 48–60 range-bound zone.
The next few candles could be crucial.
📈 Bullish Scenario
If price successfully breaks and consolidates above 60–63, it would strengthen the breakout confirmation and could trigger a broader bullish rally toward:
🎯 74 → 79 → 90
The key here is sustaining above the breakout zone, rather than simp
GOLD 4H: The Final Dip Before $4,870 Multi-Month Surge?Technical Analysis
Macro Market Structure: Gold (XAUUSD) maintains a clean bullish market structure on the 4-hour timeframe. The primary Descending Trendline that capped upside expansion through the summer months has been decisively broken.
Trendline Retest & Demand Zone: Following a peak near $4,543, price executed a controlled corrective pull-back into a descending wedge/flag structure. Price has now retested the multi-month trendline breakout confluence near the $4,179 Support Area, establi
#EURUSD Buy Trade Scenario.EURUSD BUY SETUP 📈
EURUSD is showing a bullish structure with buyers gaining strength around the current support zone. The setup indicates potential upward momentum, with a possible continuation toward the next resistance levels.
Trade Direction: BUY
Market Bias: Bullish 📈
Entry: Based on confirmation
Take Profit: Next key resistance zones
Stop Loss: Below the recent swing low
Trade with proper risk management and wait for confirmation before entering. Always protect your capital and avoid ov
XAUUSD — Bullish Wave 3 From Buy ZoneXAUUSD — Bullish Wave 3 From Buy Zone
Gold is building a bullish recovery structure after completing the previous bearish wave near the lower area. From Kelly’s view, the current chart suggests that XAUUSD may be preparing for a new upside continuation while price is holding around the Buy zone wave 3.
The key idea is simple: gold may be forming wave (2) correction now, and if buyers defend the current buy zone, wave (3) can start pushing toward the upper liquidity levels.
⟡ Market Structure
EURAUD Falling WedgeWatch for this falling wedge. If the support below holds in the next few trading days and decisively breaks above the falling trend line, re-tests and shows bullish conviction, then it can be a good buy setup. Price is not letting go of the support below and getting compressed inside the wedge.
BITCOIN - Consolidation following the NFP. There's a chance...BINANCE:BTCUSDT.P is consolidating within the 76,000–81,000 range. The key target at 83K has still not been reached, which is why it remains relevant. Yesterday’s NFP data triggered another round of liquidity collection, and the market continues to consolidate
Bitcoin continues to consolidate. Yesterday’s attempt to break through resistance failed amid the mixed NFP report. However, the market is holding the downside, with price consolidating above 79,500.
Technically, the medium-term outl
How will gold react after the news?Based on the XAU/USD chart, the current structure shows that price is correcting within a larger uptrend. The most notable point is that price is currently trading between support at 4,320 and resistance at 4,527–4,580, while a descending trendline needs to be broken to confirm a return of bullish momentum.
🔴 Resistance
1. 4,520 – 4,535 — Key Resistance
This is the Resistance Zone on the chart.
Reference level: 4,527.605.
This is also the breakout area that price needs to overcome to confirm
GOLD - Correction and retest of the 4460 resistance levelICMARKETS:XAUUSD continues its rebound after the false breakdown of the 4,300 support level. The fundamental backdrop remains mixed, but selling pressure is still present
The dollar is stagnating, potentially due to intervention from the Bank of Japan. The correction in the Dollar Index is giving gold room to recover. The key event is Friday’s NFP report. A weak report could support a further recovery in gold, while a strong report could bring selling pressure back. The 4,460 level remains