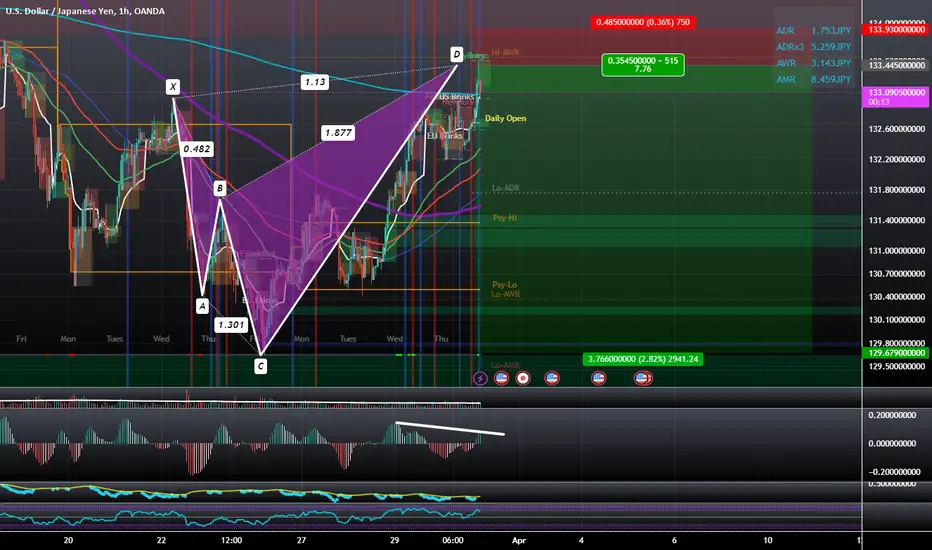
USDJPY rejected at 4H Lower HighI decided to short UJ here as the 4H shooting star at a re-tested area was a bearish enough signal for me to go short. Price has been making Lower Highs on 4H and daily chart. The bullish candles have been forming with a lot of indecision. This entry was taken based on the 4H close, as well as the 1H presenting a strong evening star at a Evening star re-test. My entry was upon a bearish 15min engulfing at a potential high/re-test of resistance. My stop loss is just Above the high of the shooting
Shooting Star
AUDUSD short this morningI decided that this pair is relatively close to retracing as the 30min moving average crossed over to the downside and a 30min trendline break. I placed a short order based on the false break close on the monthly resistance. The 4H turned out to be a shooting star at a key area. I believe that Buys are short term over. Now is the time to profit from shorts. Looking to catch the reversal. from Bullish to Bearish.
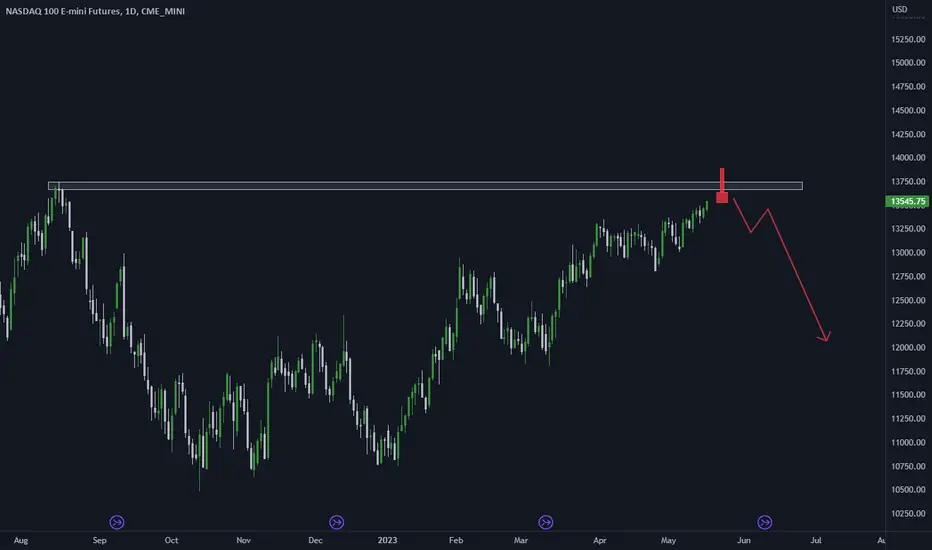
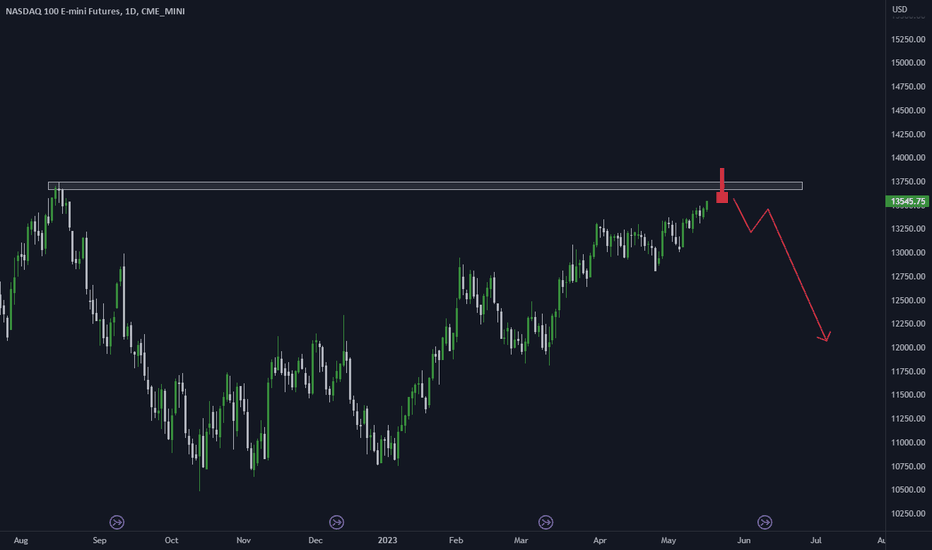
Grabbing the best possible trade on NQ1!Obviously, going short at every supply zone or going long at every demand zone doesn't work every time. If it did trading would be too easy and no one would lose. So, how do we trap the losers and become the winners? Wait for a liquidity sweep above, most often indicated by a bearish shooting start candlestick with a close back below the supply zone. Previous shorts will be stopped out and new longs will be trapped. That's the best possible time to enter short and ride the reversal back down h
Catching Falling Knife Series= "IZMO"In this Knowledge Nugget, I have explained logic behind my own trade in "IZMO" which rallied 50% + from its swing low in just days. I am found of entering such stocks for one round of buying at support level with my own set up logic.
This is for educational purpose & please do not copy this trade without understanding risk & position sizing.
Ethereum is retracing to create its lower highIt's a great thing we're no longer fooled by big big candles being a big move. Proce closed pretty Bullish on Sunday only adding to the combination of randomness . Anytime price created a lower low, I project and expect it tush lower after a retest. This is exactly what price is doing, a reversal candlestick at a key area suggests its almost time to short. If anything price has determined where it wants to slow down. This 61.8 retracement is no surprise considering the fact that the weekly was
Potential High for usdjpy, intraday short setup 30mminUSDJPY has been uptrending rather strong for quite a few weeks now. Its common that you'd like to go go against the trend, however, the only way to learn how to trade reversals is to trade them. Price presented a volatile shooting star for the close of Thursday. (4H). The daily had some wick action also. The 1H had a moving average crossover to the downside before making the latest high. the 30Min has already created a srtrong eveing star and began downtrending on its 2nd lower low. Im looking t
EURGBP falls again with ⭐️Evening Star⭐️Candlestick Pattern!!!EURGBP has attacked the resistance line several times, but it seems that the 💡sign💡 of the failure of this attack can be the formation of the Evening Star Candlestick Pattern on the resistance line and near the 🟡 Price Reversal Zone(PRZ) 🟡.
I expect EURGBP to fall to the 🎯targets🎯 I specified in the chart; I also shared a short position with RR=2.28 with you, but be sure to trade according to your own strategy and don't forget capital management.
🔅Euro/British Pound Analyze ( EURGBP ), 4-hou
NVDA: 2 Top Signals Under a Powerful Resistance - What's Next?• NVDA finally hit its long-term target this week, the 289 resistance, which I mentioned in my previous public analysis (the link to it is below this post, as usual);
• It has been correcting since then, as it did a top signal just under our 289 resistance (Bearish Harami). However, the trend is still bullish, as NVDA is still doing higher highs/lows and it is still above the 21 ema;
• Despite this correction, there’s no clear technical bearish reversal pattern around;
• The 21 ema is supposed t
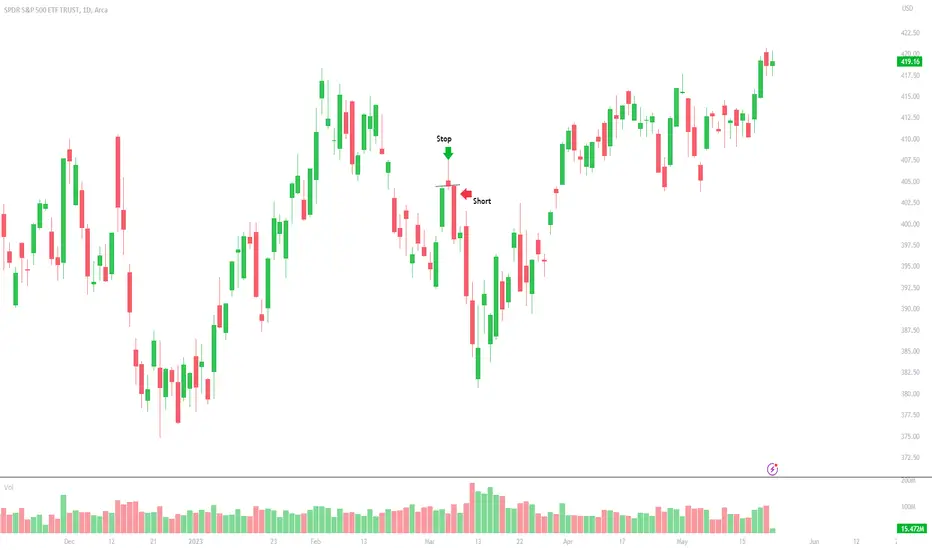
Candlestick tradetrade based on shooting star candle and pattern formation along with downtrend formation.
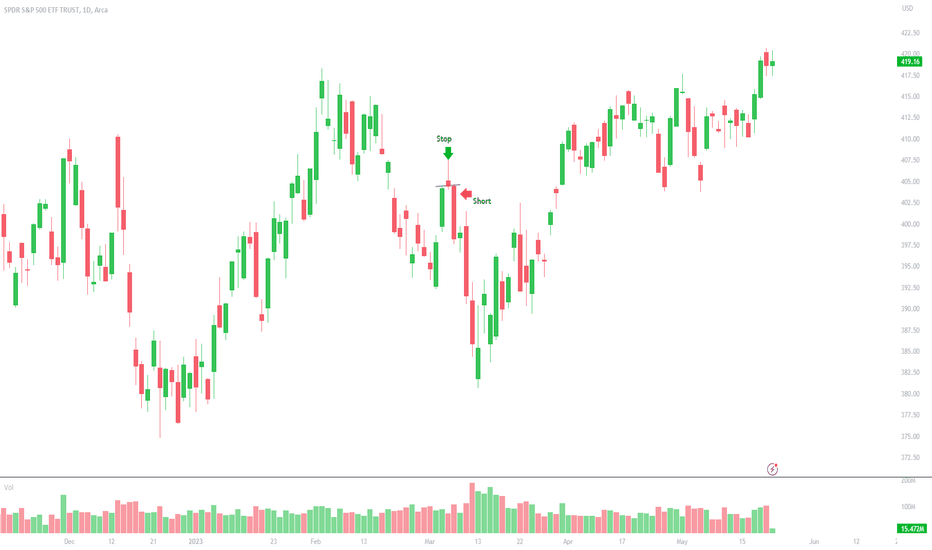
EShort
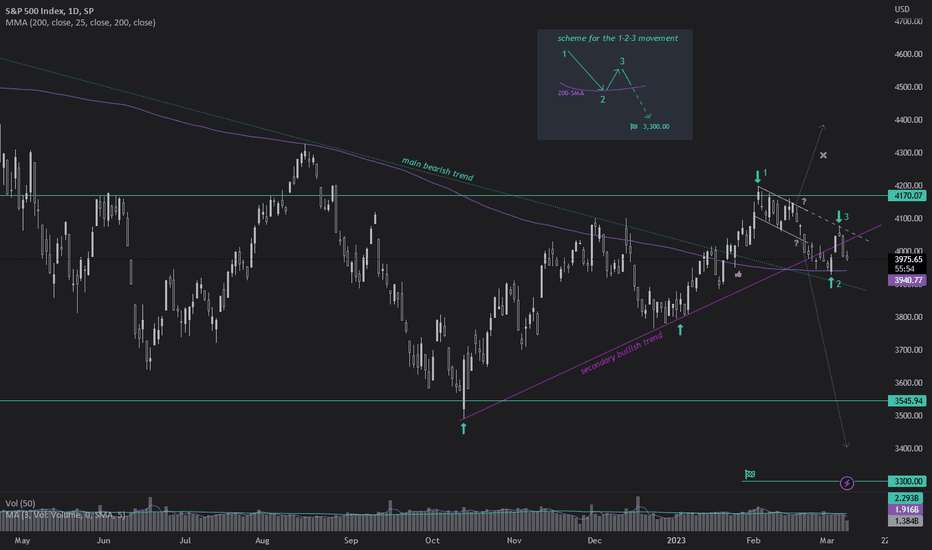
Possible beginning of a new bearish leg for SPXSummary:
Main bearish trend (dotted teal downtrend line)
Reversal attempt in progress (purple uptrend line)
200-SMA breakout in jan-2023
Failure to continue the breakout (failed bull flag - orange lines)
Arrow #3 as a good entry option for a bear trade.
Possible beginning of a new bearish leg, aligned with the main trend
Possibility to surpass the last low (oct-13-2022). Set target @3,330.00.
Timeframe expected: 3 to 4 months.
Detailed explanation:
2022 was a very
SPX: About to Correct? Next Key Points to Watch.• The SPX hit its resistance at 4,060, and now it seems it is losing strength;
• In the daily chart, we see a Shooting Star candlestick pattern, that if triggered, could take the index to lower levels;
• In the 1h chart, the SPX is correcting, and the next support is the 21 ema, which is ascending;
• The 21 ema in the 1h chart is almost at the same price the 21 ema in the daily chart is, making this a dual-support area;
• If the index loses this dual-support, I see a sharper correction to the 50
Bearish Play on USDCHFEIGHTCAP:USDCHF
Last Friday's daily bar closed as a shooting star, indicated bearish sentiment. On top of that, it also finished as a SFP (Swing Failure Pattern) from a previous swing high, another bearish confluence.
I'm expecting a run down to the previous swing low which is where I'll be taking profit.
Entry is at an imbalance and stop is set above the most recent swing high.
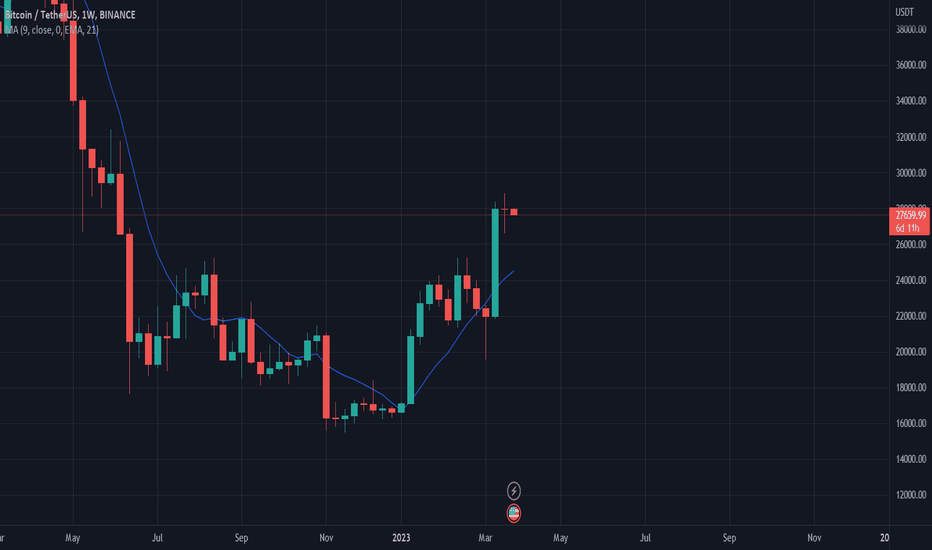
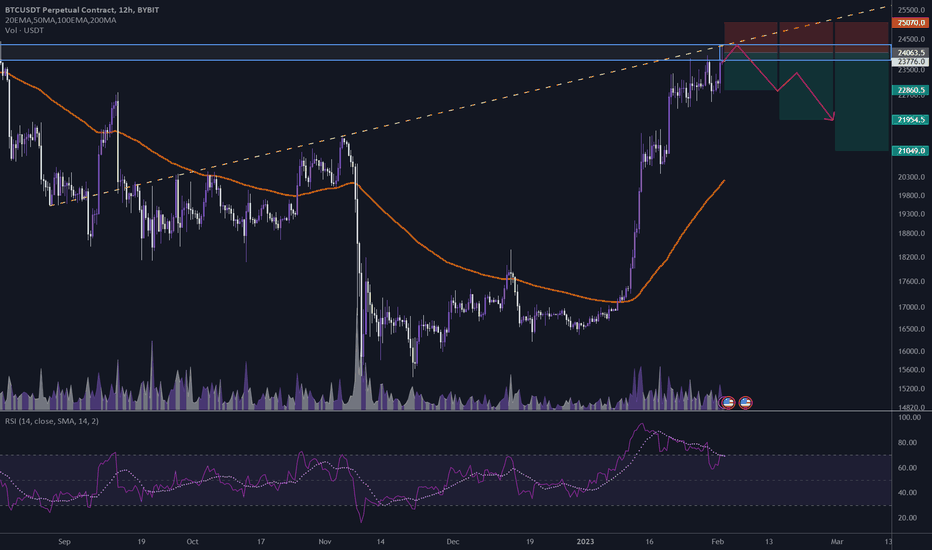
$BTC/USDT 12h (#Bybit) Ascending trendline retestBitcoin just printed a shooting star like 6 months ago, which is a reversal candlestick.
Also, we got a bearish divergence on RSI, this could finally lead to a retracement down to 100EMA.
⚡️⚡️ #BTC/USDT ⚡️⚡️
Exchanges: Binance Futures, ByBit USDT
Signal Type: Regular (Short)
Leverage: Isolated (7.0X)
Amount: 6.8%
Current Price:
23776.0
Entry Zone:
23809.5 - 24317.5
Take-Profit Targets:
1) 22860.5
2) 21954.5
3) 21049.0
Stop Targets:
1) 25070.0
Published By: @Zblaba
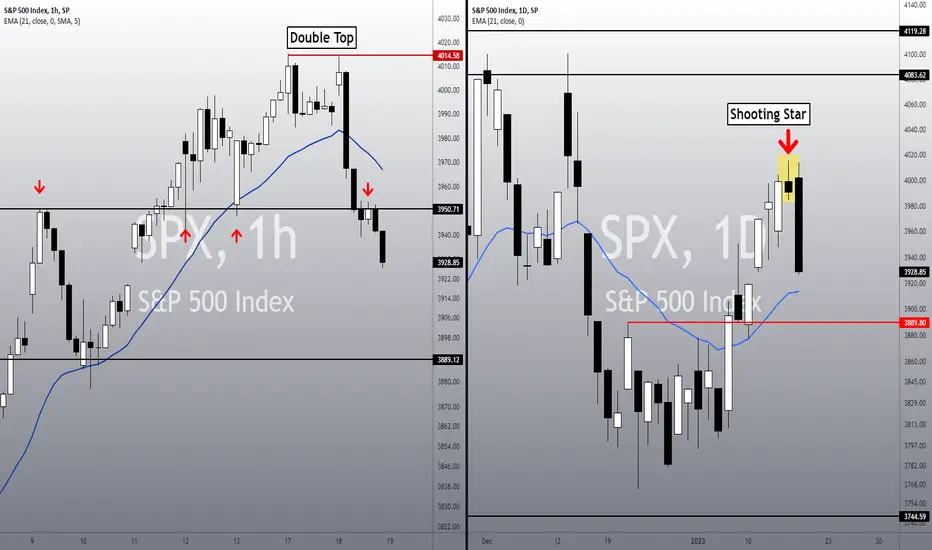
SPX: Imminent Crash! Next Key Points to Watch.• The SPX reversed the short-term bull trend, as it lost our 21 ema in the 1h chart, failing in breaking the previous top (it did a Double Top chart pattern around the 4k);
• In addition, it lost the support we mentioned yesterday, at 3,950, indicating a sharp correction – maybe even an overreaction;
• Either way, the 3,950 is a new resistance on SPX, according to the Principle of Polarity;
• Now, it seems the index is heading to the 21 ema in the daily chart, as I mentioned yesterday (link to m
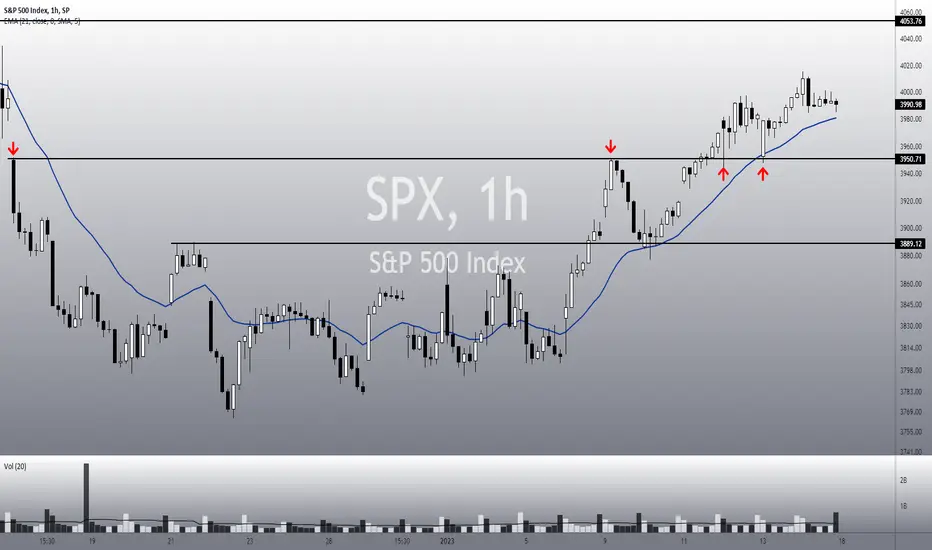
SPX: Flying High! Next target + Trend analysis. 🤓• The SPX is in a short-term bull trend, as seen in the 1h chart, and only if it loses the 21 ema we would see a correction ahead;
• In theory, it wants to hit the next resistance level, at 4,053, and as long as it stays above the 21 ema, this is the most likely scenario;
• This reinforces our previous reading on this, as mentioned in our previous study from yesterday (link below this post);
• If it loses the 21 ema, the next stop would be the 3,950 area.
• In the daily chart, SPX did a top s
SPX: What it Takes to REVERSE? Let's see. 🕵️♂️• Despite the Shooting Star from yesterday, it seems the SPX found a strong support level at the 21 ema;
• As stated yesterday, on my previous public analysis on SPX (link below), this movement could be just a pullback to the 21 ema, just to resume the bull trend again;
• Therefore, the 21 ema is our key support level, and only if the index loses it, we would see a stronger correction – possibly to the 3,744;
• Although it found a support at the 21 ema, and it closed above the 3,911 yesterday, i