NZDCAD: Bearish Trend Continuation 🇳🇿🇨🇦
NZDCAD is trading in a downtrend on a daily time frame.
The market was coiling for 2 weeks within a symmetrical triangle pattern.
Its support was finally broken last week.
I expect a trend-following movement.
Next goal - 0.794
❤️Please, support my work with like, thank you!❤️
I am part of Trade Nation's Influencer program and receive a monthly fee for using their TradingView charts in my analysis.
Wedge
INIO- Ignition Off $17.3 — Breakout at $22?📊 The Pattern — After a roughly 60% slide from the ~$43 June high inside a falling wedge, INIO carved out a base around $17.3 and tested it back. The descending trendline has been broken, and price is now pressing up against the $22 swing high that capped the bounce between those two lows. Read as a double bottom, $22 is the neckline.
⚡ The Confirmation — Today's candle is a +12.49% thrust. It reclaimed the EMA20 and is running on 8.02M shares, above the recent volume average, with volume build
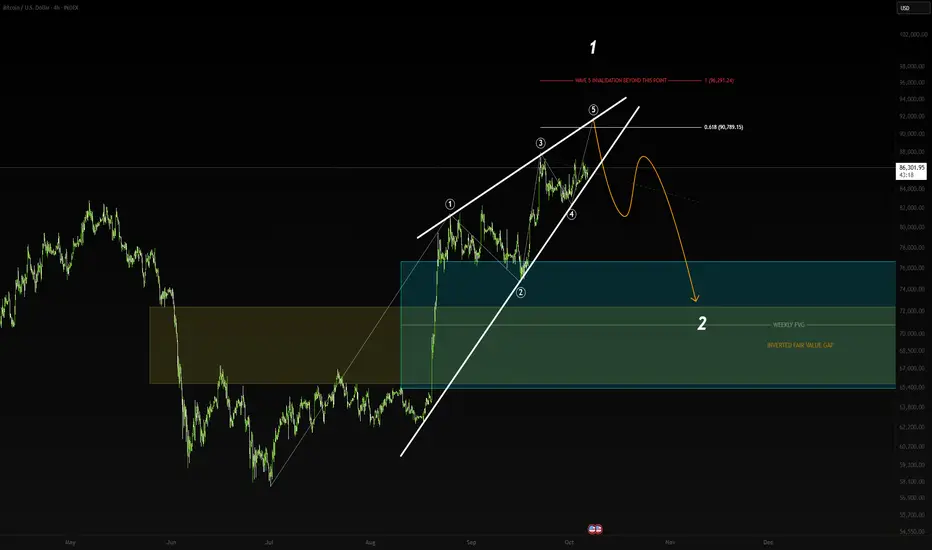
Bitcoin's Rising WedgeBitcoin is currently forming a rising wedge, while volume continues to decline and a bearish divergence is developing.
I'm still seeing another leg up to $88-$91k zone hitting the upper trendline of this rising wedge followed by a drop breaking down the lower trendline.
I also updated my Elliott Wave count to a simple Leading Diagonal 33333 with an Extended 1st Wave. This means that Wave 5 must not go beyond 100% of Wave 3.
What are your thoughts?
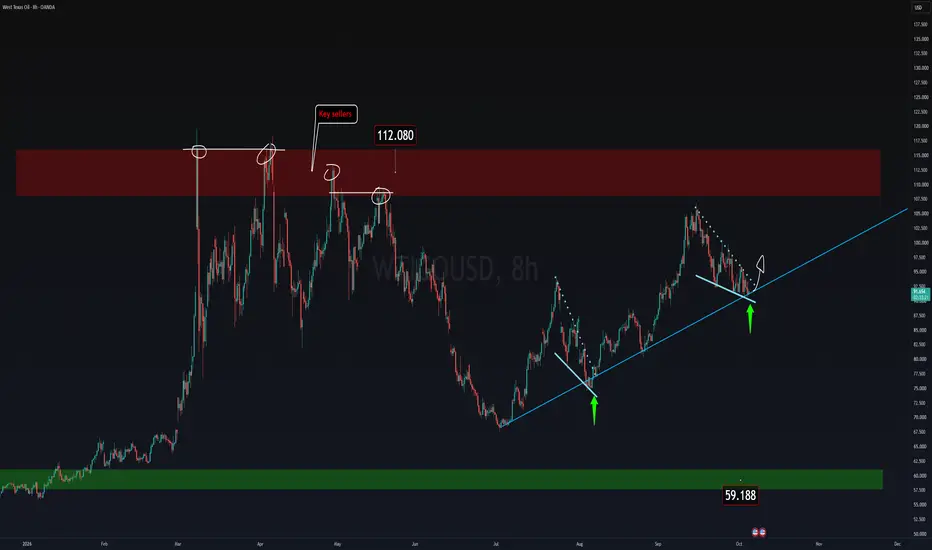
Oil Stuck at $90Oil is trading at a discount based on this solid trend with lots of upside to catch.
Metals will be looking to sell off doing the exact opposite.
🎯Potentially ~22%/($112/Barrel)
Simple wedge pattern formed up similar to the last breakout. Price is at a squeeze sitting around $90 and is looking to pop any time soon.
View Related Publications for the Wedge setup template.
Rising Wedge vs Falling Wedge | What’s the Difference?📐 Rising Wedge vs Falling Wedge
Rising Wedge
Price makes higher highs and higher lows, but the range keeps getting tighter.
It looks bullish, but often signals weakening buying momentum and can lead to a bearish breakout.
Falling Wedge
Price makes lower highs and lower lows, while the range keeps getting tighter.
It looks bearish, but often signals weakening selling momentum and can lead to a bullish breakout.
The key is not to enter just because the pattern appears - -wait for a clear b
Btc reaccumulation?This count is based on my assumptions so anything can happen not a trading or financial advice just for educational purposes only kindly do your own ta thanks trade with care good luck.
Technical & Structural Breakdown of the BTCUSD Setup
The integration of classical Wyckoff accumulation on the daily BTCUSD chart presents a remarkably cohesive structural narrative.
1. Wyckoff Accumulation Blueprint & Phase Transitions
The Base Construction: The chart successfully maps out a textbook insti
NVDA | Weekly Structure | $236 Could Unlock the Final Wave 5Thesis:
NVDA is now testing one of the most important confluence areas on the weekly chart.
The zone between roughly $228 and $236 brings together several major technical levels, and a clean break above it would put the Bull Case firmly back in play.
Context
This is the same area I have been watching for several weeks.
NVDA has continued to push higher and is now trading directly below its all-time high, with the larger Wave 5 structure still intact.
What I see
- Previous all-time high
Falling Wedge Pattern: The Bullish Signal Built from Lower LowsEvery swing inside a falling wedge is a lower high and a lower low. By the textbook definition of a downtrend, that is bearish. Yet the falling wedge is one of the classic bullish patterns. The contradiction dissolves once you look at speed rather than direction: the lows are still falling, but each one falls a little less than the last. Sellers are still in charge, and they are running out of force.
That deceleration is the whole signal. Where it happens decides what it means.
What Is a Fallin
NKE bottom is in?I'm starting a long-term position in NKE here - I like what I'm seeing in the earnings (EPS beat but lower guidance, hence the price drop), and I think the bottom is in around the $30-35 levels. I'm building my position slowly and holding over the next few years.
Why? Because it's exactly when the media and the Street are piling on a stock - "don't buy this," "it's a falling business" - that you know the bottom is in.
Yes, retail is down right now on lower consumer spending, and yes, retail is
POWI: Wedge Target Hit — Recharging at SupportStory:
📊 The Pattern
POWI broke out of a multi-year descending wedge and rallied all the way to the top of the implied range — the $90s zone, lining up with the prior 2022 high. After tagging that target, it pulled back and came right back down to retest the original breakout zone.
⚡ The Confirmation
That retest found support — price held the breakout zone rather than falling back into the old wedge, and this week's candle is confirmation above a hammer of previous week's candle.
🎯 Levels to
$MU: Weekly Wedge Breakout + Retest - Eyeing the $1,080–$1,200NASDAQ:MU (1W): Breakout confirmed, retest in play. 📐
Not much has changed here - the weekly breakout from the descending wedge is locked in, and price is putting in a textbook backtest:
• Holding cleanly above both the 50D + 50W SMA ($887.28).
• The daily breakout was backed by solid volume; this pullback looks like normal absorption.
• Structure stays bullish. Upside target corridor remains $1,671 – $1,896.
Invalidation is simple: W close below $935 on high volume breaks the setup. Until t
$EURUSD - Falling Wedge at Resistance: Watch $1.16Hi guys! 👋
🔔 Euro has been recovering after a continuous drop since mid-January, which pushed price to a new year-to-date low at $1.13245. That decline was orderly — not a crash, not panic selling — and it left a clear technical structure behind it.
🔔 The correction formed a falling wedge, internally structured as a 5-wave ABCDE sequence. Wedges of this type are typically continuation or reversal patterns depending on where they appear in the broader trend, and this one is sitting at a locatio
# XAUUSD 4H: BREAK OUT OR DOWN ??HAS GOLD ACCUMULATED ENOUGH LIQUIDITY TO BREAK OUT TO 4,391 OR WILL IT BE DUMPED DOWN TO 3,965?
XAUUSD on the 4H timeframe is entering an extremely sensitive squeeze phase, converging between two blue trendlines and key horizontal levels. Following a strong bullish rejection wick off the cyan support zone (around 4,100.000), price is currently rebounding to retest the resistance ceiling at 4,208.930 – 4,260.856.
The market is sharply divided into two opposing camps:
---
## 1. MARKET SENTIMEN
BTCUSDT: Upward Channel Holds as Bulls Target 86,500$Hello everyone, here is my breakdown of the current BTCUSDT setup.
Market Analysis
BTCUSDT previously traded inside a wedge structure before breaking higher and shifting bullish. Price then entered an upward channel, tested the Resistance Zone near 86,500, and pulled back toward support.
Currently, BTCUSDT is trading below the 86,500 Resistance Zone while holding above the 83,500 Support Zone and the upward channel. The recent rebound from support suggests buyers may attempt another move hig
GBPAUD: Key Resistance Level Holds 🇬🇧🇦🇺
GBPAUD reached a major key resistance level yesterday.
The price violated a support line of a rising wedge pattern after a bull trap on an hourly time frame.
I expect a bearish continuation now.
Goal - 1.902
❤️Please, support my work with like, thank you!❤️
I am part of Trade Nation's Influencer program and receive a monthly fee for using their TradingView charts in my analysis.
Nasdaq breaks the coil and heads into open airThe Nasdaq 100 has broken higher from the wedge-like structure the price had been coiling within over the past couple of weeks, pushing above 30,756.3, the record high set back in June.
In the period since, we’ve seen a minor pullback towards the breakout level, providing a potential entry point for longs.
The message from the oscillators is bullish. RSI (14) continues to trend higher above 50, while MACD has confirmed the move by staging a bullish crossover and is now diverging further away f
MESZ Sep 30: 7767 Breakout or 7720 Breakdown After the News?MESZ is trading around 7,755 following a sharp reaction to the morning news.
The short-term structure remains volatile, so I’m focused on confirmation around a few key levels.
On the upside, 7,756 is the first short-term level showing buyer strength.
The more important breakout level is 7,767. A confirmed 1-hour or 4-hour close above that area could support continuation toward 7,786.
On the downside, 7,720 is the first important intraday support.
A confirmed 1-hour close below 7,720 could increa
XAUUSD Short: Sellers Return at Supply — 4,050 Becomes the KeyHello traders! Here’s my technical outlook based on the current XAUUSD (2H) chart structure. XAUUSD previously traded inside a range before breaking higher and later forming a descending structure under the Trend Line. Price then tested the Supply Zone near 4,200, where sellers rejected the upside.
Currently, XAUUSD is trading below the 4,200 Supply Zone while holding above the 4,050 Demand Zone. The recent rejection and descending Trend Line suggest a possible continuation lower toward demand.
MarketBreakdown | NZDCHF, US30, BITCOIN, DOLLAR INDEX
Here are the updates & outlook for multiple instruments in my watch list.
1️⃣ #NZDCHF daily time frame 🇳🇿🇨🇭
The price violated a resistance line of a huge falling wedge pattern.
It opens up a potential for a bullish continuation.
2️⃣ #US30 Dow Jones Index daily time frame 🇺🇸
I see a bearish accumulation on a major daily support cluster.
We may see another test of that and its breakout attempt.
A daily candle close below it will confirm a bearish continuation.
3️⃣ #BITCOIN #BTCUSD d
FARTCOIN / USDT (BULLISH SETUP)Market Structure & Trade Setup
Price has been in a downtrend, consistently forming Lower Lows (LLs) and Lower Highs (LHs). However, a bullish divergence has developed on the 1H RSI, indicating a potential loss of bearish momentum. This is further supported by the formation of a Falling Wedge, a bullish reversal pattern.
The previous LH level has already been broken, providing confirmation of a potential trend reversal and bullish market-structure shift. Additionally, price has retested the pre
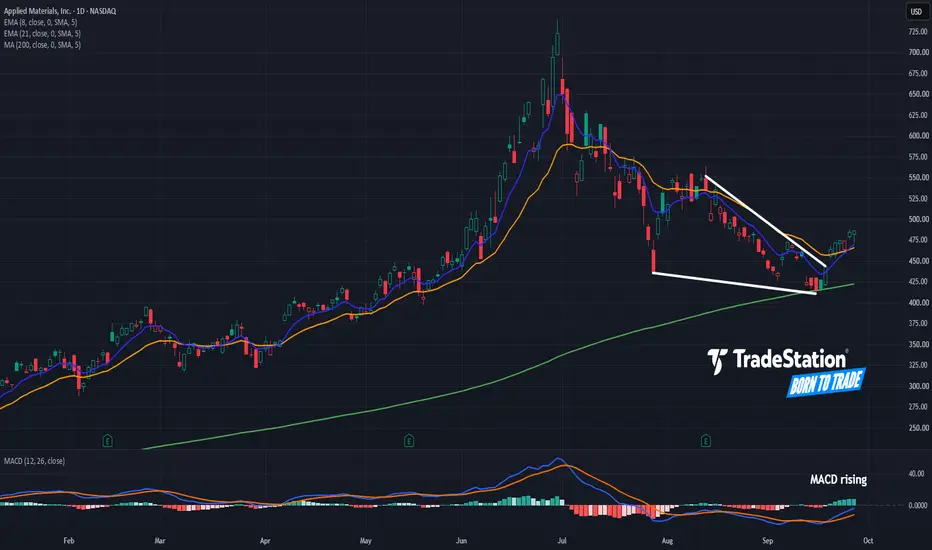
Applied Materials May Be ClimbingApplied Materials had a long pullback, but some traders could think it’s climbing again.
The first pattern on today’s chart is the 2-1/2 month slide between early July and mid-September. That decline, following the previous surge, may be viewed as an opportunity for trend followers.
Second, the semiconductor-equipment company bounced at its 200-day simple moving average (SMA). That may confirm its longer-term uptrend remains in effect.
Third, AMAT’s last low had a shallower angle than its low
MESZ Sep 29: Pullback to 7736 Before a Break Toward 7850?MESZ has bounced strongly from the recent lows and is now trading around 7,756.
The short-term structure is improving, but I’m watching for a possible pullback into the 7,735–7,736 fair value gap before another continuation higher.
If buyers defend that zone, the first major upside level is 7,786.
A confirmed 4-hour close above 7,786 could support continuation toward last week’s high around 7,850.
On the downside, 7,715 is the key higher-time-frame support. A confirmed 4-hour close below that le