Canadian Gold Miners UndervaluedThe Invesco S&P/TSX Global Gold Index ETF (CGMU) offers investors diversified exposure to many of Canada's leading gold mining companies, providing a way to benefit from rising gold prices without relying on the success of a single miner. As one of the world's largest gold-producing regions, Canada is home to high-quality operators with long-life assets, strong balance sheets, and increasing free cash flow.
Despite gold trading near record highs, Canadian gold miners remain relatively undervalued. Years of investor preference for technology and AI stocks have left the sector overlooked, even as mining companies generate record earnings and strengthen their financial positions. Many producers continue to trade at attractive valuation multiples compared to the broader market and previous gold bull cycles. With central banks continuing to accumulate gold, persistent geopolitical uncertainty, and expectations for lower interest rates supporting bullion prices, the outlook for gold remains constructive. If investor sentiment shifts back toward defensive assets, Canadian gold miners could benefit from both rising earnings and expanding valuation multiples, making CGMU an attractive way to gain broad exposure to the sector.
The technical setup here is becoming increasingly interesting and appears to be forming the foundation for a potentially significant reversal. Price has been compressing within a falling wedge pattern for several months, a formation that is often associated with bullish reversals once a breakout occurs. That breakout has now taken place, and the recent pullback is finding support at the broader range's Value Area Low, adding an important layer of technical confluence. This area also aligns closely with key Fibonacci retracement levels, further strengthening the case that buyers may begin stepping in.
While no setup is guaranteed, the current risk-to-reward profile looks quite attractive if these support levels continue to hold. A sustained move higher could trigger renewed momentum as confidence returns to the sector, particularly if gold prices remain strong. Although it's an ambitious target, I believe there is a realistic path for the ETF to advance toward the **$15** level over the medium term, representing a substantial recovery from current prices if the broader bullish thesis plays out.
 Long
Long
Bitcoin Is Compressing. Mapping The Next Structural Expansion.Strong rallies rarely end because price gets tired; they pause so liquidity can build for the next leg.
High-Timeframe Context (4H)
Looking at the broader picture, Bitcoin’s recent expansion was supported by clean momentum.
When measuring impulse legs, the macro projection points toward the $91,000 region. However, macro targets are roadmap destinations—not immediate entries.
We need lower-timeframe structure to manage our risk.
Low-Timeframe Structure (1H)
On the 1-hour chart, INDEX:BTCUSD Bitcoin is consolidating inside a corrective falling wedge pattern right above the $76,000 support zone.
This compression is healthy after a sharp vertical move.
We map out two potential execution pathways:
Breakout Execution: A clean 1H candle close above the upper wedge boundary.
Retest Execution:
Bullish price action or rejection signals inside the $76,000 pullback area.
Key Targets & Resistance Walls
Immediate Resistance: $82,800 — A significant order cluster sits at this level. Expect temporary absorption or a pause here.
Pattern Target:
$85,400 — Calculated directly from the 1H wedge geometry.
This is our primary profit-taking zone where risk should be significantly scaled down.
Macro Measured Move: $91,000 — Based on leg projection theory if momentum sustains past $85.4k.
Invalidation Level: $74,000
Risk & Execution Perspective
As long as price stays above $74,000, the structural bias remains constructive. A breakdown below $74,000 invalidates the wedge setup and signals a deeper corrective phase, leaving no reason to remain long.
Define your risk, take profits at key structural hurdles, and let the market confirm the breakout before expanding position size.
Patience comes before execution.
Risk Warning:
Trading cryptocurrencies involves significant financial risk. This analysis represents a personal market view and structural perspective, not financial advice. Always define your risk before entering any trade and never risk capital you cannot afford to lose.  Long
Long
 Long
Long
DOGE Is Setting a Trap—Will You Be Ready Before It Explodes?Yello Paradisers! Are you prepared for a potential sharp move on #DOGE, or are you still underestimating what’s quietly building behind the scenes? At first glance, this structure might seem like a simple and healthy pullback. But when we strip away emotions and analyse the chart objectively, a completely different narrative emerges. This is not random price action this is a high-risk, high-opportunity zone where discipline matters far more than opinions.
💎#DOGE has broken above the descending resistance trend line of a falling-wedge pattern and successfully retested it. At the same time, a clear bullish RSI divergence has formed, adding further strength to the bullish probability.
💎As long as price continues to hold momentum with in the OB + FVG zone, the structure remains constructive. The first important resistance level to watch is 7920. A clean reaction around this level will be important probability, because it can show whether buyers are strong enough to continue controlling the move.
💎#DOGE has recently printed a classic selling climax, followed by a climactic action candle supported by ultra-high volume. This is a textbook indication of accumulation. Historically, this exact behaviour appears when smart money begins positioning ahead of a larger move. While subtle to the untrained eye, this probability carries significant weight for experienced traders.
💎#DOGE has also swept the liquidity below the selling climax and then broken above the upper trigger line with a strong momentum candle. This suggests that weak hands were pushed out before stronger buyers stepped in with conviction. If the prices sustain this momentum, the next upside path can open toward 8530, which is currently acting as a major structural resistance level.
💎If #DOGE fails to hold bullish momentum and a momentum candle closes below 6700, the current bullish probability becomes invalid. In that case, we could see further downside pressure.
That is why Paradisers, we are playing it safe right now. If you want to be consistently profitable, you need to be extremely patient and always wait only for the best, highest probability trading opportunities only on confirmations.
MyCryptoParadise
iFeel the success🌴
 Long
Long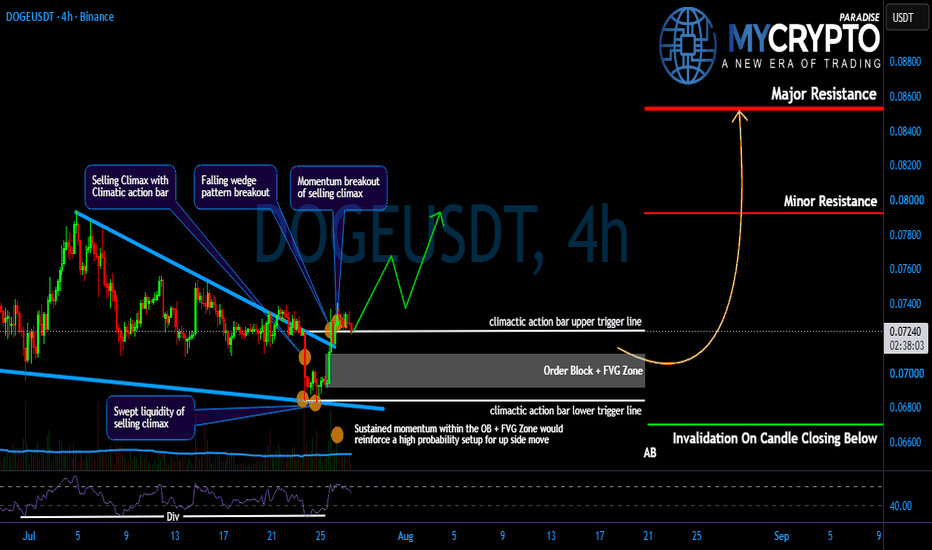
BNB Trap Before the Big Move?Yello Paradisers! Are you prepared for a potential sharp move on #BNB, or are you still underestimating what’s quietly building behind the scenes? At first glance, this structure might seem like a simple and healthy pullback. But when we strip away emotions and analyse the chart objectively, a completely different narrative emerges. This is not random price action this is a high-risk, high-opportunity zone where discipline matters far more than opinions.
💎#BNB has broken out of the falling wedge pattern, while the overall market structure has gradually started shifting to the upside. On top of that, we can see a clear RSI divergence, which adds more strength to the bullish probability. As long as the price continues to hold momentum inside the order block zone, the structure remains constructive, with 664 acting as the first important resistance level to watch.
💎#BNB has recently printed a classic selling climax, followed by a climactic action candle supported by ultra-high volume. This is a textbook indication of accumulation. Historically, this exact behaviour appears when smart money begins positioning ahead of a larger move. While subtle to the untrained eye, this probability carries significant weight for experienced traders.
💎#BNB has also swept the liquidity below the selling climax with shakeout test and then broken above the upper trigger line with a strong momentum candle. This suggests that weak hands were pushed out before stronger buyers stepped in with conviction. If the prices sustain this momentum, the next upside path can open toward 729, which is currently acting as a major structural resistance level.
💎If #BNB fails to hold bullish momentum and a momentum candle closes below 502, the current bullish probability becomes invalid. In that case, we could see further downside pressure.
That is why Paradisers, we are playing it safe right now. If you want to be consistently profitable, you need to be extremely patient and always wait only for the best, highest probability trading opportunities only on confirmations.
MyCryptoParadise
iFeel the success🌴
 Long
Long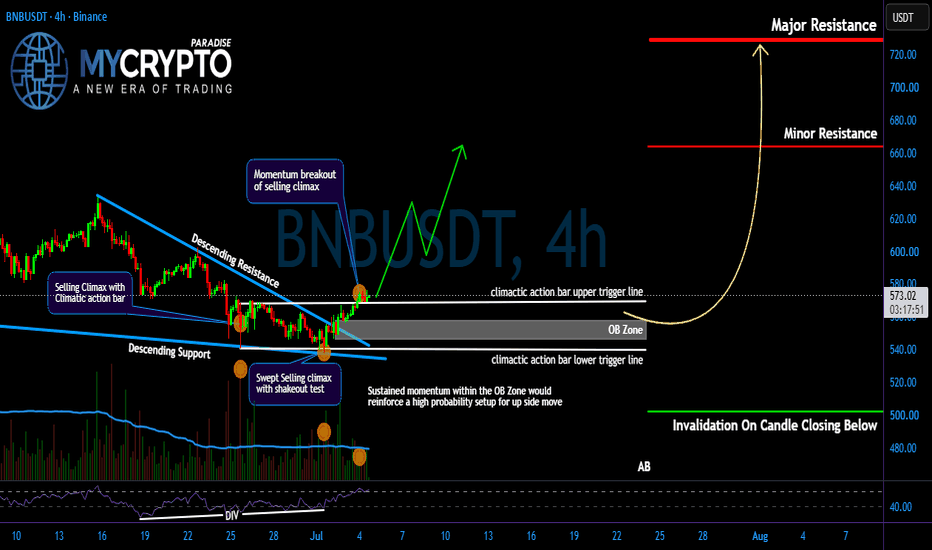
BlackRock Acquires $852M in Bitcoin and $316M in EthereumBlackRock has made headlines with its recent acquisition of 11,098 Bitcoin ($852 million) and 132,769 Ethereum ($316 million) over just two days. This substantial investment, totaling approximately $1.17 billion, highlights a notable surge in institutional interest within the cryptocurrency market as reported by Lookonchain. Such moves are likely to influence market sentiment positively in the near future.
The Story So Far
The broader crypto market has been displaying mixed signals, but BlackRock’s substantial purchases are drawing significant attention. With Bitcoin and Ethereum being leading cryptocurrencies, this acquisition signals a strong institutional vote of confidence. Market participants are closely watching how this influx of capital will affect overall market dynamics and sentiment in the coming days.
At a Glance
BlackRock has acquired 11,098 Bitcoin and 132,769 Ethereum. The total investment amounts to $1.17 billion. This acquisition occurred over a two-day span. The purchases indicate growing institutional interest in crypto assets. Market sentiment may shift positively following this news.
Token Metrics
As of now, the crypto market is experiencing fluctuations, with BlackRock’s investment poised to impact trading dynamics. While specific volume figures for the day are absent, the market’s attention is focused on how these institutional buys will shape trader sentiment and potentially spark further investment activity across various cryptocurrencies.
BlackRock is a global investment management corporation, managing trillions in assets. Its foray into cryptocurrencies showcases its recognition of digital assets as a legitimate investment class, potentially reshaping market dynamics and trader strategies.
Eyes on These Levels
What traders should watch next includes potential ripple effects from BlackRock’s purchases. Key levels of support and resistance in Bitcoin and Ethereum could become more pronounced as market participants react. Additionally, monitoring interest rate trends and macroeconomic factors will be crucial for understanding the broader impact on crypto sentiment.
This article is for informational purposes only and should not be considered financial advice.  Long
Long
Selena | XAUUSD 2H – Bullish Breakout ScenarioFOREXCOM:XAUUSD PEPPERSTONE:XAUUSD
Gold has broken out of the descending channel and is now retesting the previous supply zone as fresh support. Buyers continue to defend higher lows, suggesting bullish momentum is building. If price successfully holds above the 4,030–4,050 demand zone and breaks the descending trendline resistance, the next move could target the major resistance area near 4,400. A healthy pullback into support may offer buyers another opportunity before continuation.
Bullish Targets 🚀
🎯 Target 1: 4,180
🎯 Target 2: 4,300
🎯 Target 3: 4,400–4,450
Key Levels
🟢 Support: 4,030–4,050
🔴 Resistance: 4,180–4,220
Market Bias: Bullish, provided buyers maintain control above the demand zone and confirm a breakout above the descending trendline.
Educational purposes only — not financial advice  Long
Long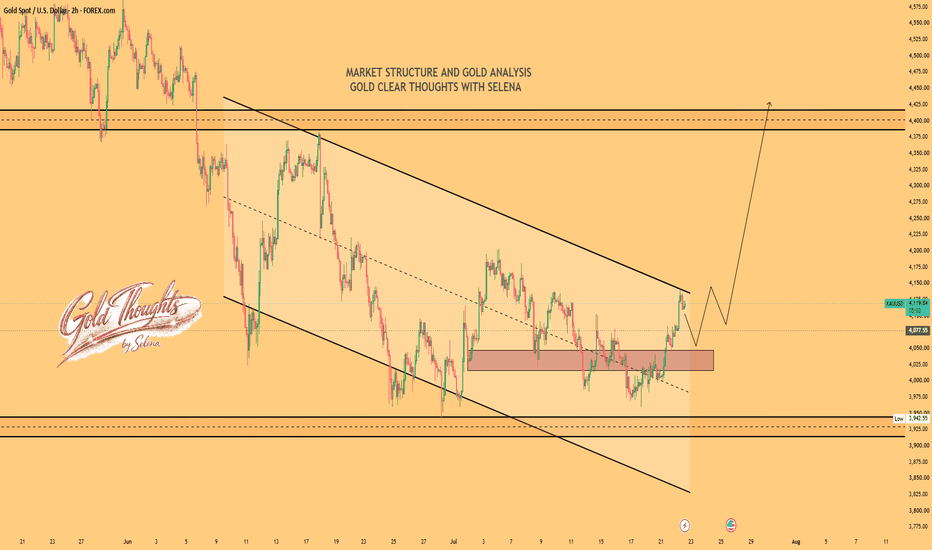
Selena | XAUUSD 2H – Bullish Continuation SetupFOREXCOM:XAUUSD PEPPERSTONE:XAUUSD
Gold is currently consolidating inside a key demand zone after rejecting lower prices, while the broader structure continues to recover from the previous downtrend. Price remains above the recent support area around 4,020–4,040, showing that buyers are still defending this level. A short-term pullback into the highlighted demand zone could provide fresh buying interest before the next impulsive move higher.
If buyers maintain control and break above the descending trendline together with the 4,170–4,190 resistance zone, bullish momentum could accelerate toward the next major resistance levels. However, losing the demand zone would weaken the bullish outlook and delay the expected continuation.
Bullish Targets 🚀
🎯 Target 1: 4,170–4,190
🎯 Target 2: 4,300
🎯 Target 3: 4,400–4,450
Key Levels
🟢 Support: 4,020–4,040
🔴 Resistance: 4,170–4,190
Market Bias: Bullish, as long as buyers continue defending the demand zone and confirm a breakout above the descending trendline.
Educational purposes only — not financial advice. Long 
Has XRP & Crypto bottomed early this cycle or one last plunge?BTC has broken out against USCPI so has XRP
The chart tells us long term support is on the green line
The potential target could be top of the range again, and we have typically a bullish phase which typically lasts 3 years to get there
These charts are particularly useful in calling tops and bottoms in cryptoland and have track record of rewarding - gifts from the trading gods!
XRP bounced off the $1 which was the target for the head and shoulders top, we still have long term asc triangle targets on log scales that are incomplete, but on arithmetic they were nicely met. The max that XRP could do this cycle is most likely less than its 7 year asc triangle which did about a 5.5 X last cycle so dont believe all these you tubers that say 20 or 100 dollars ... I would love them to be right but they generally are not. However if it was 5x times $1 max would be $5 this cycle, so look to close some out if it gets into the 4's - that will be smart and required a lot of buying by the bulls to move it up there. I hope the whole crypto market gets a bid from institutions then we could see new ATHs which would be nice for all, but be safe out there. And bank your gains Summer in 3 years time please.
I love XRP it has the potential to move but the hype from the XRP team is too much they keep on selling into strength and lining their pockets, using an algo to do that. When will they learn to hold back put that bot on hold and let the price acculumate because if they sell when the prices is in the high 4's they will make a lot more money and now they can access the fed account and borrow against their xrp. Thus they can pay off those loans if taken now with a lot less selling pressure in say 2.5 years time. Sell into the strong bull market. Give the price a boost, create a great market again for XRP or get left behind. Brad come on, you need to get your billions back and then some! Sending love to you and yours! You actually can have your cake and eat it, and float Ripple too, imagine if XRP is priced much higher what the IPO will be placed at .... That should be the strategy ! I am available for consultation and I work for free!  Long
Long
Long 
BTC vs. SPX: The Reset Before the Next Cycle?**BTC vs. SPX: The Reset Before the Next Cycle?**
One of the more interesting charts in the market right now isn't BTC/USD.
It's **BTC/SPX**.
When Bitcoin is divided by the S&P 500, a repeating structure becomes much easier to see:
**Expansion → Falling Wedge / Reset → Breakout → Expansion**
And it has happened multiple times during this relative-strength advance.
Look at the sequence on the chart.
Each major push higher in BTC/SPX has been followed by a controlled downward-sloping consolidation. Instead of completely breaking the relative-strength trend, Bitcoin resets against equities, establishes another higher base, and eventually begins the next leg higher.
Now we're seeing a very similar structure developing again.
### Why BTC/SPX Matters
BTC/USD only tells us what Bitcoin is doing against the dollar.
BTC/SPX asks a different question:
**Is capital being rewarded more for holding Bitcoin or the broad U.S. equity market?**
When BTC/SPX trends higher, Bitcoin is outperforming the S&P 500.
That makes the current consolidation particularly interesting.
The ratio remains within the broader relative-strength advance, while another downward-sloping reset has formed near the highs.
If this structure resolves the same way the previous ones did, a breakout would suggest **Bitcoin is beginning another period of relative outperformance versus equities.**
### The Pattern I'm Watching
Previous sequence:
**BTC/SPX impulse higher
→ falling consolidation
→ breakout
→ higher high**
Then again:
**Impulse
→ reset
→ breakout
→ higher high**
And again.
Now:
**Impulse
→ reset
→ ?**
The question is whether the current structure becomes the next continuation.
A confirmed break above the descending trendline — particularly if followed by expansion in the ratio — would strengthen that thesis.
Failure to break out, or loss of the broader higher-low structure, would invalidate the immediate continuation setup.
### Bigger Picture
This is why periods where Bitcoin appears to be "doing nothing" can be deceptive.
Markets don't move vertically.
Strong trends repeatedly go through **expansion, consolidation, and re-expansion**.
BTC/SPX is currently testing whether this is simply another reset in Bitcoin's relative-strength cycle.
If history rhymes again, the next move may not just be Bitcoin moving higher.
It could represent **another rotation toward Bitcoin outperforming traditional equities.**
**BTC/SPX is the chart I'm watching for confirmation.**
*This analysis is for educational purposes only and is not financial advice. Past chart structures do not guarantee future results. Always conduct your own research and manage risk appropriately.*
Long 
MESU Aug 20: 7682 Sweep or Reversal Toward 7764?MESU sold off aggressively overnight and is now trading near a major downside liquidity area around 7,682.
That level is the first key decision point for today.
If sellers continue pressing through 7,682, the next downside target I’m watching is around 7,650.
However, the 1-hour chart also shows an imbalance above price around 7,700–7,705, so a short-term bounce back into that area is possible before the market decides its next larger move.
For the bullish scenario, 7,733 is the key confirmation level. A confirmed 15-minute close above that area would shift my short-term tone bullish and open the path toward 7,764.
Key levels
7,682 — major downside liquidity
7,650 — next bearish target
7,700–7,705 — first FVG / bounce area
7,733 — bullish confirmation
7,764 — upside target
Bearish scenario: Lose 7,682 with momentum → target 7,650.
Bullish scenario: Sweep 7,682, reclaim 7,733 with confirmation → target 7,764.
Not financial advice. No confirmation, no trade. CME_MINI:MESU2026  Long
Long
BTCUSDT: Rejection From Wedge Resistance — 63,400$ in FocusHello everyone, here is my breakdown of the current BTCUSDT setup.
Market Analysis
BTCUSDT previously traded inside an upward channel before breaking below the channel support and shifting bearish. Price then formed a range near the 62,600–63,300 area before breaking higher toward the 65,100 Resistance Zone.
Currently, BTCUSDT is trading below the 65,100 Resistance Zone while holding above the 63,400 Support Zone. The recent rejection from resistance and the descending wedge structure suggest that sellers may attempt to regain control.
My Scenario & Strategy
As long as BTCUSDT remains below the 65,100 Resistance Zone and respects the wedge resistance line, the bearish scenario remains valid. A rejection from current levels could push price toward the 63,400 Support Zone (TP1).
However, a breakout and close above 65,100 would weaken the bearish outlook and increase the possibility of further upside.
That’s the setup I’m tracking. Thank you for your attention, and always manage your risk. Short 
 Long
Long
Short 
META: Heavy Discount Meets Daily Wedge Support | Path to $800+1-Technical AnalysisPattern & Price Action (Daily Timeframe):
On the daily chart, META is consolidating within a multi-month falling wedge pattern. Price is currently testing and reacting off the bottom support trendline of the wedge near the $550 mark, showing initial signs of a rebound.
Primary Path (Path 1 - Immediate Rebound):
A successful bounce from the daily wedge baseline targets an upward break through descending resistance (~$600–$620), confirming a structural shift back toward prior highs.
Secondary Path (Path 2 - Deep Retest & Aggressive Buy Zone):
If broader market weakness or headline sentiment breaks the wedge support, the secondary high-conviction demand zone sits between $487 – $502. Notably, the $487 level aligns directly with the weekly 200 SMA support/inflection area, coinciding with major horizontal structural demand. A dip into this $487–$502 pocket represents an optimal zone to aggressively scale and add to long positions.
Macro Moving Average Structure:
Despite short-term daily consolidation, META remains well-supported by long-term structural trendlines, with the macro weekly moving averages continuing to provide underlying baseline support.
2- Fundamental Context & ValuationHeadline Headwinds & Trial Impact:
The recent sell-off and price pressure are largely fueled by headline risk as META faces a landmark federal trial in California regarding allegations of intentionally designing Facebook and Instagram to addict children. Opening arguments commenced on August 18, 2026, driven by a bipartisan coalition of 29 U.S. states. While prosecutors label this the "largest consumer protection lawsuit in American history" seeking billions in damages and structural app changes, past precedent suggests the case will either lose momentum over time or settle for significantly lower, manageable damages without impairing core monetization.
Core Monetization & AI Infrastructure:
Meta's digital ad dominance and high user engagement (3.6B Daily Active People across Family of Apps) remain intact. Near-term operating margins and free cash flow face temporary pressure from AI infrastructure and data center capital expenditures, setting the stage for future operating leverage once the cycle matures.
Valuation & Conservative Intrinsic Value ($800):
Considering long-term ad yield growth, messaging monetization, and post-capex margin recovery, a conservative intrinsic value sits at $800 (with an extended fair value up to $850), providing a substantial margin of safety at current multiples.
 Long
Long
XRP’s Trap Is Almost Ready - Will Bulls Take Control Next?Yello Paradisers! Are you prepared for a potential sharp move on #XRP, or are you still underestimating what’s quietly building behind the scenes? At first glance, this structure might seem like a simple and healthy pullback. But when we strip away emotions and analyse the chart objectively, a completely different narrative emerges. This is not random price action — this is a high-risk, high-opportunity zone where discipline matters far more than opinions.
💎#XRP has recently printed a classic Selling Climax, followed by a Climactic Action candle backed by ultra-high volume. This is a textbook probability that accumulation may be developing. Historically, this type of behaviour often appears when smart money starts positioning before a larger move. To inexperienced traders, it may look like noise. But for experienced traders, this kind of volume reaction carries serious weight.
💎#XRP swept the Selling Climax with an Automatic Rally structure and then aggressively breaking above the Automatic Rally trend-line with strong momentum. This is a key probability. It suggests weak hands are being forced out of the market while stronger participants continue accumulating positions with confidence.
💎#XRP swept the selling climax liquidity with a shakeout test adding more confluence for the bullish probability. If the prices sustain this momentum, the next upside path can open toward 1.0920, which is currently acting as a major structural resistance level.
💎#XRP momentum has now shifted toward the bullish side. A clear RSI divergence is also visible, adding further confirmation to the bullish probability. As long as prices holds momentum inside the order block and fair value gap zone, the structure remains constructive. The first minor resistance level to monitor is 1.0475. A decisive break and sustained acceptance above this area would strengthen the probability of further continuation toward 1.0920.
💎If #XRP fails to hold bullish momentum and a momentum candle closes below 0.9795, the current bullish probability becomes invalid. In that case, we could see further downside pressure.
That is why Paradisers, we are playing it safe right now. If you want to be consistently profitable, you need to be extremely patient and always wait only for the best, highest probability trading opportunities only on confirmations.
MyCryptoParadise
iFeel the success🌴
Long 
 Long
Long
MESU Aug 19: Bounce Toward 7760–7780 or Break 7700?MESU remains inside a broader pullback structure, but there is still room for a short-term bounce into the fair value gaps above.
The first upside area I’m watching begins around 7,742, with 7,760 as the first continuation target if buyers regain momentum. Above that, the larger fair value gap around 7,780 remains in play.
On the downside, 7,700 is my key intraday breakdown level. A confirmed 15-minute close below 7,700 could open the door toward the higher-time-frame fair value gap around 7,682.
Key levels
7,740–7,742 — bullish trigger / first FVG area
7,760 — first upside target
7,780 — higher upside FVG target
7,700 — bearish trigger
7,682 — major downside target
Bullish scenario: Confirmed break above 7,740 → target 7,760 → possible extension toward 7,780.
Bearish scenario: Confirmed break below 7,700 → target 7,682.
For now, I’m staying patient between the trigger levels and waiting for price to confirm direction.
Not financial advice. No confirmation, no trade. CME_MINI:MESU2026 Long 


 Long
Long
 Long
Long


