EMA 40 Pullback Pyramid StrategyEMA 40 Pullback Pyramid Strategy
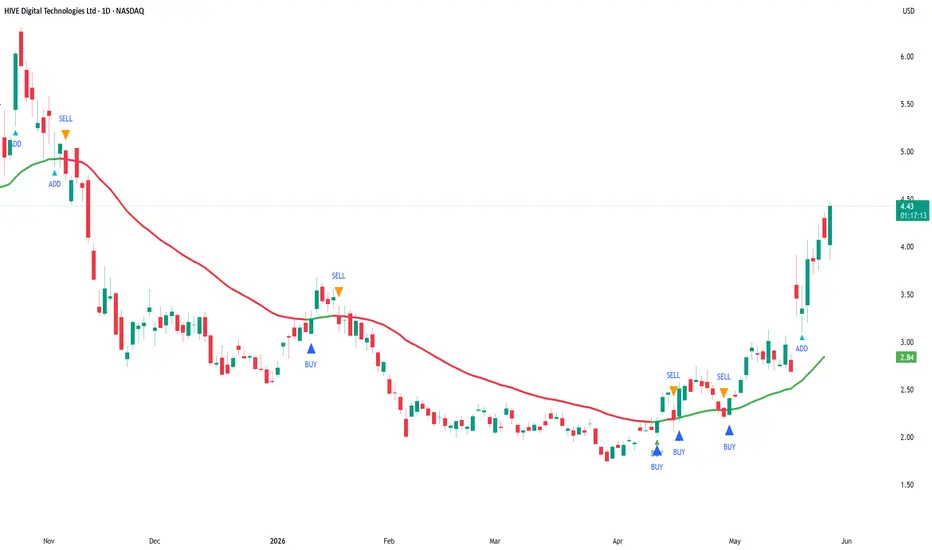
EMA 40 Pullback Pyramid Strategy is an educational trend-following strategy designed to study long-side entries around a rising 40-period Exponential Moving Average, with optional pullback re-entry logic, ADX trend-strength filtering, and EMA cross-based entry/exit conditions.
This is a strategy script, not a prediction tool and not financial advice. It is intended for research, backtesting, and forward-testing only. Historical results are hypothetical and can differ significantly from live trading due to slippage, commissions, liquidity, order execution, symbol behavior, timeframe selection, and market regime changes.
What the strategy does
The strategy uses the 40-period EMA as its main directional reference.
The EMA color changes according to its slope:
- Green EMA: the EMA is rising.
- Red EMA: the EMA is falling.
- Gray EMA: the EMA is flat or unchanged.
The strategy can enter long positions when selected bullish conditions occur and can close positions when selected bearish or exit conditions occur.
Core logic
1. EMA 40 trend direction
The strategy calculates a fast EMA using the selected EMA length. The default value is 40.
A bullish trend condition exists when the EMA is rising. A bearish condition exists when the EMA is falling.
The original base entry occurs when the EMA changes from not rising to rising, and ADX is above the selected minimum threshold.
2. ADX trend-strength filter
The strategy uses DMI / ADX to filter weak trend conditions.
A trade can qualify only when ADX is above the selected ADX threshold. The default threshold is 20.
This filter is intended to reduce entries during weak or sideways market conditions, but it does not eliminate false signals.
3. Pullback re-entry logic
When enabled, the pullback module looks for price to retrace toward the EMA by a selected ATR-based distance and then recover above the EMA.
The pullback condition uses:
- ATR length.
- Pullback distance multiplied by ATR.
- Recovery candle logic, where the candle closes above the EMA and closes above its open.
This feature is designed to study additional entries during an existing upward EMA trend. Because pyramiding is enabled, these pullback signals can add to an existing long position depending on the strategy settings.
4. EMA 40 cross signals
The strategy includes optional EMA cross buy/sell logic.
The cross detection mode can be:
- Close mode: uses close crossing above or below the EMA.
- Wick mode: uses wick interaction with the EMA followed by a close on the opposite side.
When “Use EMA cross signals in strategy orders” is enabled, these signals can participate in actual strategy entries and exits. When disabled, they can be used only as visual reference signals.
5. Minimum bars between entries
The strategy includes a minimum-bars-between-entries setting. This helps reduce immediate repeated entries and gives users control over signal spacing.
6. Pyramiding
The strategy uses pyramiding to allow multiple long entries when qualifying conditions appear. This is mainly intended to study whether adding into a trend after pullbacks improves or worsens the tested behavior.
Users should review this setting carefully. Pyramiding increases exposure and can materially increase both potential returns and potential drawdowns.
Default strategy properties
The script uses the following default strategy properties:
- Initial capital: 1,000
- Position sizing: percent of equity
- Default order size: 33% of equity
- Pyramiding: 3
- Commission: 0.1%
- Slippage: defined in the strategy settings
- Bar magnifier: disabled
- Calculate on every tick: disabled
- Process orders on close: disabled
These settings are included for testing purposes only. They may not be suitable for every market, timeframe, or trader. Users should adjust position sizing, commission, slippage, pyramiding, and test date range to reflect realistic conditions for the instrument being tested.
Important backtesting note
TradingView strategy results are simulations based on historical bar data. They are not live trading results.
Backtest results can change significantly depending on:
- Symbol
- Timeframe
- Date range
- Commission
- Slippage
- Liquidity
- Spread
- EMA length
- ADX threshold
- ATR length
- Pullback multiplier
- Minimum bars between entries
- EMA cross mode
- Whether EMA cross signals are used for orders
- Pyramiding setting
- Market regime
Users should test the strategy on a sufficiently large sample of trades and across different market conditions before drawing conclusions. A small number of trades is not enough to evaluate a strategy reliably.
How to use it
A practical workflow is:
1. Select the symbol and timeframe to test.
2. Use a realistic date range that includes different market conditions.
3. Review whether the strategy produces a sufficient number of trades.
4. Adjust commission and slippage to match the market being tested.
5. Review the impact of position size and pyramiding on drawdown.
6. Compare results with and without pullback re-entry.
7. Compare results with and without EMA cross signals being used for strategy orders.
8. Forward-test before considering any real-world use.
Inputs
Date Range
- Start Date: first date included in the test.
- End Date: last date included in the test.
Moving Average
- Fast EMA Length: controls the EMA used for trend direction, pullbacks, and cross signals.
DMI / ADX
- DI Length: DMI calculation period.
- ADX Smoothing: smoothing period for ADX.
- ADX minimum to trade: minimum ADX value required for qualifying trend entries.
Pullback Re-entry
- Enable pullback re-entry: enables or disables ATR-based pullback entries.
- Pullback distance × ATR: controls how close price must pull back toward the EMA.
- ATR Length: ATR period used for pullback distance.
Signal Control
- Minimum bars between entries: controls spacing between entries.
EMA 40 Cross Signals
- Use EMA 40 cross buy/sell signals: enables visual EMA cross signals.
- EMA cross detection mode: chooses Close mode or Wick mode.
- Use EMA cross signals in strategy orders: determines whether EMA cross signals affect actual strategy orders.
Visual elements
The script plots:
- The EMA line, colored by slope.
- Base entry markers.
- Pullback add-entry markers.
- Optional EMA cross buy/sell markers.
- Hidden ADX and ADX threshold plots available for reference.
Limitations
This strategy is long-side focused and does not create independent short positions.
The strategy can underperform during sideways or choppy market conditions, even with the ADX filter.
EMA-based systems are inherently lagging because moving averages react to prior price data.
ADX can confirm trend strength but does not determine trade direction by itself.
Pullback and pyramiding logic can increase exposure and may increase drawdown.
No strategy setting can guarantee profitability or future performance.
Recommended use
This strategy is best used as an educational framework for testing EMA trend continuation, ATR-based pullback re-entry, ADX trend-strength filtering, and pyramiding behavior.
It should be used with realistic backtesting assumptions, conservative risk controls, and additional independent analysis before any trading decision. Strategia

ATR Position SizerATR Position Sizer
A simple position sizing tool for futures traders. Calculates how many contracts to trade based on your risk tolerance and the current ATR-based stop distance.
How it works
The indicator uses the standard formula:
Contracts = Risk $ ÷ (ATR × Stop Multiplier × Dollar per Point)
It pulls the contract's dollar-per-point value directly from the symbol info, so you don't need to enter it manually. At the close of each bar, the calculation updates and displays in the bottom right of your chart.
Inputs
ATR Lookback (bars): How many bars to use for the ATR calculation. Default is 14.
Risk Tolerance ($): Maximum dollar amount you're willing to lose on the trade. Default is $250.
Stop Multiplier (xATR): How wide your stop is relative to ATR. Default is 1.5x.
How to use it
Add the indicator to your chart.
Set your ATR lookback, risk tolerance, and stop multiplier in the settings.
At the close of your entry candle, look at the contracts value in the bottom right.
Size your trade accordingly.
The output is a decimal so you can see exactly where you stand. Round down if you want to stay within your risk, round up if you're comfortable taking slightly more.
Supported instruments
This indicator was designed and tested on the following futures contracts:
S&P 500: ES, MES
Nasdaq 100: NQ, MNQ
Russell 2000: RTY, M2K
Dow: YM, MYM
Nikkei 225: NKD, NIY
Gold: GC, MGC
Crude Oil: CL, QM, MCL
It may work on other futures contracts that have a defined point value in TradingView, but results outside the listed instruments are not guaranteed.
Disclaimers
This indicator is for educational and informational purposes only. It is not financial advice, investment advice, or a trading recommendation.
The calculations assume your actual stop loss will be placed at the ATR-based distance. If you use a different stop placement method, your real risk will differ from what this indicator shows. Always verify your stop placement and position size before entering a trade.
ATR is a backward-looking measure of volatility. It does not predict future price movement, slippage, gaps, or news-driven volatility expansion. Your actual loss on a trade can exceed the calculated risk amount, especially on thinly traded instruments, around economic releases, or during overnight sessions.
This tool does not account for commissions, exchange fees, margin requirements, account size, or overall portfolio exposure. You are responsible for ensuring any position size is appropriate for your account and risk profile.
Futures trading involves substantial risk of loss and is not suitable for every investor. Past performance is not indicative of future results. Trade at your own risk. Indicatore

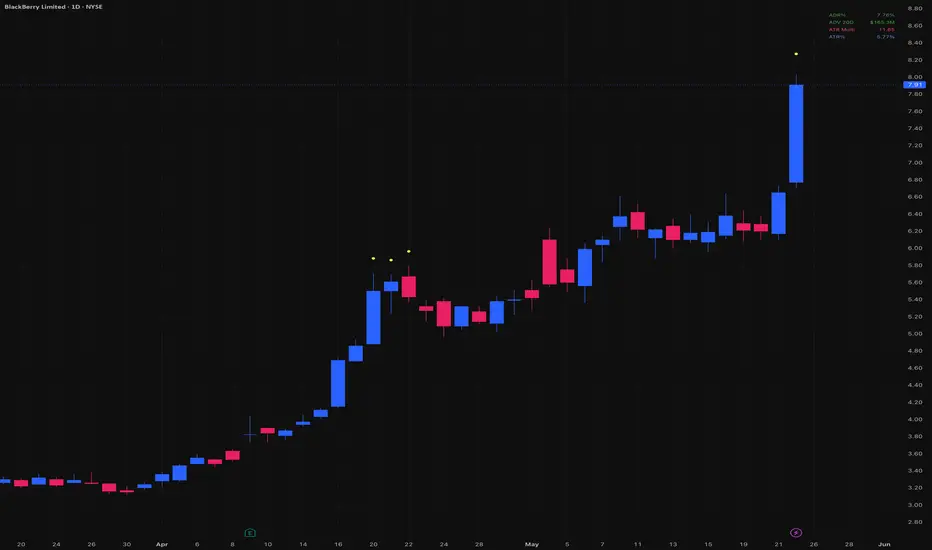
Entry Gate - ADR% / ADV / ATR MultipleThree critical pre-trade filters, always visible right on your chart.
Before entering any swing trade, three questions determine whether the setup is even worth considering: is this stock volatile enough to move my account, is it liquid enough to trade cleanly, and is it too extended to enter now? Entry Gate answers all three at a glance, in a single corner of your chart.
ADR% (Average Daily Range) measures how much a stock moves on an average day. Too low and it won't move your portfolio. Too high and daily noise will stop you out randomly.
ADV (Average Dollar Volume) measures how much money flows through the stock each day. Liquid stocks respect key levels, pull back cleanly to moving averages, and don't gap on low volume. Illiquid stocks do the opposite.
ATR Multiple measures how extended the price is above its 50-day moving average, expressed in ATR units. The further extended, the higher the probability of a pause or reversal. Based on jfsrev's published formula: % Gain from MA divided by ATR%.
ATR% rounds out the dashboard with the raw volatility number for context.
All values are color-coded against your thresholds:
🟢 Green — within your ideal range
🟠 Orange — borderline, proceed with caution
🔴 Red — outside your criteria
A yellow dot also plots above the bar when the ATR Multiple exceeds your trigger level, marking historically extended zones at a glance.
Fully customizable:
Independent thresholds for ADR%, ADV, and ATR Multiple
Warning zones for borderline values
Lookback periods for each calculation
Font size, table position, dot size and offset
Color customization for good / warning / bad / ATR / dot
All values are pulled from the daily timeframe via request.security, so the numbers stay consistent whether you're on a daily, weekly, or intraday chart.
Default thresholds are calibrated for swing traders running mid-sized accounts. Adjust to match your strategy.
Credits to ArmerSchlucker for the original ADR% table indicator, MikeC / TheScrutiniser and GlinckEastwoot for the ADR% formula, and jfsrev / Fred6724 for the ATR% Multiple from 50-MA approach. Indicatore

Average Daily Range Percentage (ADR%) and Average Daily VolumeTwo critical pre-trade filters, always visible right on your chart.
Before entering any swing trade, you need to know two things: is this stock volatile enough to move your account, and is it liquid enough to trade cleanly? This indicator answers both questions at a glance.
**ADR% (Average Daily Range)** measures how much a stock moves on an average day. Too low and it won't move your portfolio. Too high and the daily noise will stop you out randomly. The color tells you where you stand instantly.
**ADV (Average Dollar Volume)** measures how much money flows through the stock each day. Liquid stocks respect key levels, pull back cleanly to moving averages, and don't gap randomly on low volume. Illiquid stocks do the opposite.
Both values are color-coded against your thresholds:
🟢 Green — within your ideal range
🟠 Orange — borderline, proceed with caution
🔴 Red — outside your criteria, skip it
Fully customizable:
ADR% and ADV thresholds
Warning zones for borderline values
Lookback periods for both calculations
Colors for good, warning, and bad values
Default thresholds are calibrated for swing traders. Adjust to match your account size and risk tolerance.
Built for swing traders who want clean, fast chart reviews without second-guessing liquidity or volatility on every name. Indicatore

Indicatore

Median ATR SD OscillatorMedian ATR SD Oscillator
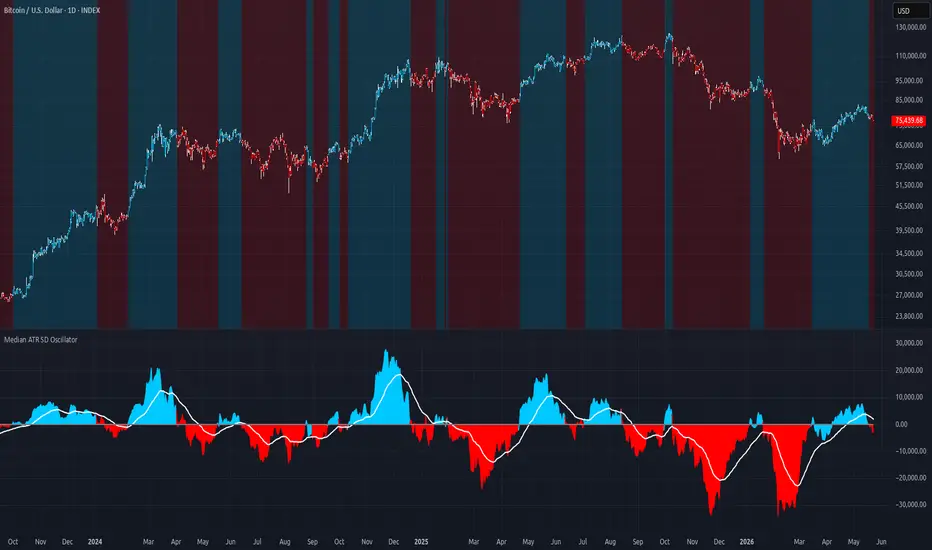
Median ATR SD Oscillator is a trend-following volatility oscillator that measures the distance between price and two independent reference levels — an ATR band and a standard deviation band — both anchored to a percentile-based median. The asymmetric design uses different volatility measures for long and short signals, creating a natural bias toward staying in bullish trends longer while reacting quickly to breakdowns.
The result is an area oscillator that expands above zero in a confirmed bullish state and contracts below zero in a bearish state, with a white EMA line as a momentum confluence filter.
How It Works
A percentile median is calculated from a configurable price source — giving a robust, noise-resistant central reference level that adapts to recent price behavior.
Two independent volatility bands are then derived from this median:
ATR Band — median plus ATR multiplied by a configurable factor. The short condition uses the ATR band — price must fall below it to confirm a bearish state
SD Band — median plus the standard deviation of close. The long condition uses the standard deviation band — price must break above it to confirm a bullish state
Once a directional state is confirmed, the oscillator measures the distance between price and its reference level. An EMA of this distance acts as a confluence filter — the final signal only confirms when the distance is not only positive or negative but also above or below its own EMA, ensuring momentum is genuinely building in that direction.
Why This Approach Works
Most oscillators use a single volatility measure for both long and short signals. The Median ATR SD Oscillator deliberately uses two different measures — ATR for shorts and SD for longs — because they capture different market dynamics and create a natural asymmetry between entries and exits.
This asymmetric design reflects the structural reality of markets like crypto — price spends more time trending upward than downward. Longs require a statistically significant breakout above the SD band, while shorts only need price to fall back below the ATR band. The result is a system that stays in bullish trends longer while reacting quickly when momentum fades.
Settings
Median Source — Price source for the percentile median calculation (default: hl2)
Median Length — Lookback period for the percentile median (default: 63)
ATR Length — Lookback period for the ATR calculation (default: 4)
ATR Factor — Controls the width of the ATR band (default: 1.0)
SD Length — Lookback period for the standard deviation calculation (default: 29)
Use EMA — Enables the EMA confluence filter (default: true)
EMA Length — Lookback period for the EMA confluence filter (default: 35)
Use Bar Coloring — Colors bars based on the current state (default: true)
Color Background — Enables background coloring of the chart based on the current state (default: false)
Background Transparency — Controls the transparency of the background color (default: 85)
How to trade it
Long — when the oscillator expands above zero and the area turns blue, a bullish state has been confirmed. This is the signal to look for long entries or to hold existing long positions
Short / Cash — when the oscillator contracts below zero and the area turns red, the momentum has faded. This is the signal to exit longs, move to cash, or look for short entries depending on your strategy
EMA line — when the area is above the white EMA line momentum is building, when it crosses below momentum is weakening
Recommended Usage
Best used on the 1D timeframe for clean and reliable signal generation
Should not be used alone for trade entries — combine with an additional confirmation indicator for best results
The asymmetric ATR/SD design makes this oscillator particularly well suited for bullish-biased markets like crypto
Higher ATR Factor values make short exits more sensitive — lower values make them less reactive
Higher SD Length values create more stable long signals — lower values make them more reactive to short-term price movements
All signals are confirmed on bar close. Indicatore

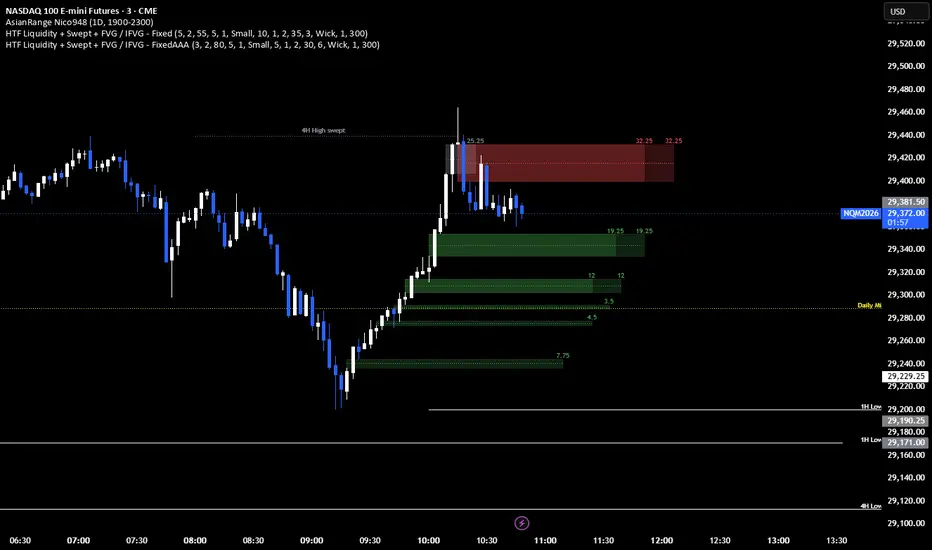
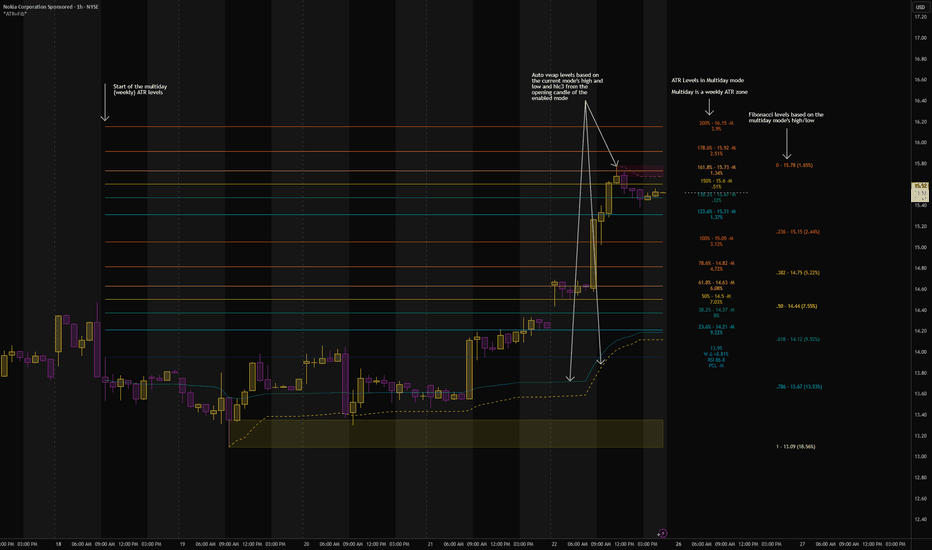
ATR & Fibonacci Expansion ZonesATR & Fibonacci Expansion Zones is a multi-mode ATR framework designed to help traders read price location, volatility expansion, session structure, and active high/low range context. The script is built around a simple but powerful idea: ATR levels can provide a volatility-adjusted map of how far price has moved from a meaningful close reference. From there, the workflow adds flexible mode selection, organized ATR labels, optional historical ATR periods, mode-aware AVWAPs, active high/low zones, and fibonacci labels that correspond to a respective level within the enabled mode.
────────────────────────────
Core Idea
────────────────────────────
ATR (actual true range) is powerful because it gives price movement a volatility-adjusted frame of reference.
This script helps traders evaluate:
• How far price has expanded from the selected close anchor
• Whether price is still near the first ATR expansion zone or already extended
• Whether price is approaching a major +1, +2, +3, or +4 ATR area
• Whether price is reacting around an active session high/low zone
• Where price is trading inside the active session fibonacci range
• Which ATR mode best frames the current move: Daily, Multiday, Swing, Position, or Long-Term
That makes the script useful for intraday context, multiday moves, swing structure, position-style tracking, and longer-term range mapping.
────────────────────────────
ATR Modes
────────────────────────────
The script renders one selected ATR engine at a time. This keeps the chart cleaner than stacking multiple ATR families together.
Included modes:
Daily
Uses the daily ATR framework. Best for day/session-level context on intraday charts.
Multiday
Uses the weekly ATR framework. Best for trades developing across multiple sessions.
Swing
Uses the monthly ATR framework. Best for larger swing-style movement.
Position
Uses a 3-month ATR framework. Best for broader position-style context.
Long-Term
Uses a 12-month ATR framework. Best for major range structure and larger macro-style moves.
All modes can render the full 23.6% through 400% ATR expansion range, with separate line and label controls for each major range block.
────────────────────────────
ATR Expansion Grid
────────────────────────────
The main ATR grid plots upper and lower ATR expansion levels from the selected close anchor.
The grid includes:
• 23.6% to 100%
• 123.6% to 200%
• 223.6% to 300%
• 323.6% to 400%
Each range has its own parent Show / Hide controls for lines and labels, plus child controls for upper and lower sides. This makes it easier to keep the chart simple when only the closer ATR levels matter, or expand the full map when price is making a larger move.
The labels can show:
• ATR ratio
• ATR level price
• selected mode tag
• percent distance from current price
That percent-from-price read helps make the grid more practical because you can quickly see how close price is to the next ATR level instead of visually estimating it or using the info line tool.
────────────────────────────
Previous / Current Close Reference
────────────────────────────
The PCL / CC line and label show the active close reference used by the selected ATR grid. Depending on the selected mode and settings, this can represent:
• Previous Close
• Current Close
• Daily close reference
• Weekly close reference
• Monthly close reference
• 3-month close reference
• 12-month close reference
The label can also show close-to-close percent change and RSI(14) from the selected ATR timeframe. This is important because the close anchor is the foundation of the ATR grid. The script keeps that reference visible so the user can see exactly where the ATR expansion map begins.
────────────────────────────
ATR Session AVWAPs
────────────────────────────
The script includes mode-aware ATR Session AVWAPs. These are not static VWAPs. They follow the currently selected ATR mode. Depending on the mode, the AVWAP set can reset from:
• the active day/session
• the active week
• the active month
• the active 3-month period
• the active 12-month period
Included AVWAP paths:
• Session VWAP
• High AVWAP
• Low AVWAP
The Session VWAP starts from the active ATR period/session start. The High AVWAP anchors from the candle that creates the active period high. The Low AVWAP anchors from the candle that creates the active period low. When a new active high or low forms, the matching AVWAP re-anchors.
In practical terms:
• ATR levels show volatility expansion from the selected close anchor
• AVWAPs show volume-weighted behavior from the active period structure
• High/Low AVWAPs help track how price behaves after major active-period extremes form
This adds a useful volume-weighted layer around the ATR map.
────────────────────────────
ATR Session High / Low Boxes
────────────────────────────
The script can also draw active high and low boxes for the selected ATR session or period.
The High Box starts from the candle that creates the active high.
The Low Box starts from the candle that creates the active low.
These boxes are wick-based, which makes them useful for highlighting rejection zones, liquidity wicks, exhaustion candles, or important high/low reference areas inside the active ATR period.
────────────────────────────
ATR Session Fibonacci Labels (levels)
────────────────────────────
ATR Session Fibonacci Labels add another layer of context beside the ATR grid.
The ATR grid answers:
“How far has price expanded from the selected close anchor?”
The session fib labels answer:
“Where is price trading inside the active high-to-low range?”
The fib labels use the same active high and low tracked by the AVWAP and high/low box engines.
Direction is inferred automatically:
• If the low formed before the high, the script treats it as a bullish session leg
• If the high formed before the low, the script treats it as a bearish session leg
The fib labels can show:
• fib ratio
• price
• percent distance from current price
This creates a clean second layer of structure: ATR levels for expansion, fib labels for internal active-range location.
────────────────────────────
Historical ATR Periods
────────────────────────────
The script includes an optional Historical ATR Periods mode. When enabled, prior ATR grid segments can remain visible for a user-defined number of completed ATR periods.
This is useful for reviewing:
• how price respected previous ATR levels
• where prior extensions acted as support or resistance
• whether price repeatedly reacted around certain volatility zones
• how current ATR behavior compares to prior periods
Historical labels are intentionally excluded to keep the chart cleaner. The historical mode focuses on line segments only.
────────────────────────────
Asset-Aware Behavior
────────────────────────────
The script includes separate behavior for stocks, crypto, and futures.
For stocks and funds:
• ATR calculations can use regular or extended-session source data
• Daily lines can start from regular open or extended open
• Daily AVWAPs, boxes, and fib labels can reset from the extended-session / premarket day start when available
• Higher-timeframe stock modes wait for the first regular-hours bar of the new period for cleaner visual alignment
For crypto:
• the chart ticker is used
• Daily mode resets once per calendar day
For futures:
• the chart ticker is used
• Daily mode uses a Globex-style 5:00 PM Central session boundary
• higher-timeframe modes reset from the selected W / M / 3M / 12M ATR period boundary
This makes the script more flexible across different asset classes instead of treating every market like a regular-hours stock chart.
────────────────────────────
How I Use It
────────────────────────────
I use this script as a volatility and structure map.
A few practical ways to read it:
• Daily mode helps frame intraday price movement around the active daily ATR grid
• Multiday mode helps show where price is trading inside the weekly ATR structure
• Swing mode is useful when the daily chart is too narrow and the monthly range matters more
• Position and Long-Term modes help zoom out and understand broader extension zones
• PCL (previous close) / CC (current close) keeps the close anchor visible
• The Auto close-anchor setting is especially useful for Daily stock mode because it automatically adapts between Current Close during New York premarket / after-hours and Previous Close during regular market hours
• This means the ATR grid can stay aligned with the session environment without forcing the user to manually decide when to use PCL or CC
• During premarket and after-hours, Current Close helps the levels respond to the active extended-hours move
• During regular hours, Previous Close keeps the main daily ATR map anchored to the completed prior session
• The price guide dash makes it easier to line up current price with the ATR label column
• High/Low Boxes help mark active wick-based extremes
• Session AVWAPs add a volume-weighted path from the active period and its extremes
• Session Fib Labels show internal retracement context inside the active high/low range
• Historical ATR Periods help review how price behaved around prior ATR grids
The Auto close-anchor behavior is one of the most practical parts of the workflow. Premarket and after-hours trading can make a static previous-close grid feel disconnected from the live move, while regular-hours trading often benefits from keeping the prior close as the main reference. Auto handles that transition in the background so the ATR levels remain tied to the most relevant close reference for the active session. In other words, you don't have to decide when to use "Use Current Close" depending on if your'e in pre-market or regular trading hours.
The value of this script is organization. It brings ATR expansion, close-reference context, session extremes, AVWAP structure, and active-range fib location into one chart-side workflow.
ATR levels by themselves can already be useful but this script expands that idea into a fuller range map so traders can better judge whether price is early in a move, pressing into extension, reacting from an active extreme, or moving through a broader volatility structure.
────────────────────────────
Attribution
────────────────────────────
This script is a modern rebuild inspired by Saty’s ATR Levels concept and my original ATR Levels publication.
Special thanks to SimpleCryptoLife for past help and inspiration around improving the original ATR Levels workflow and for the Significant Figures library used for cleaner number formatting.
As always, this is a visual context tool. It is not meant to replace risk management, market structure, support/resistance, volume analysis, or a complete trading plan.
────────────────────────────
A Few Chart Examples
────────────────────────────
Indicatore
Indicatore
Indicatore

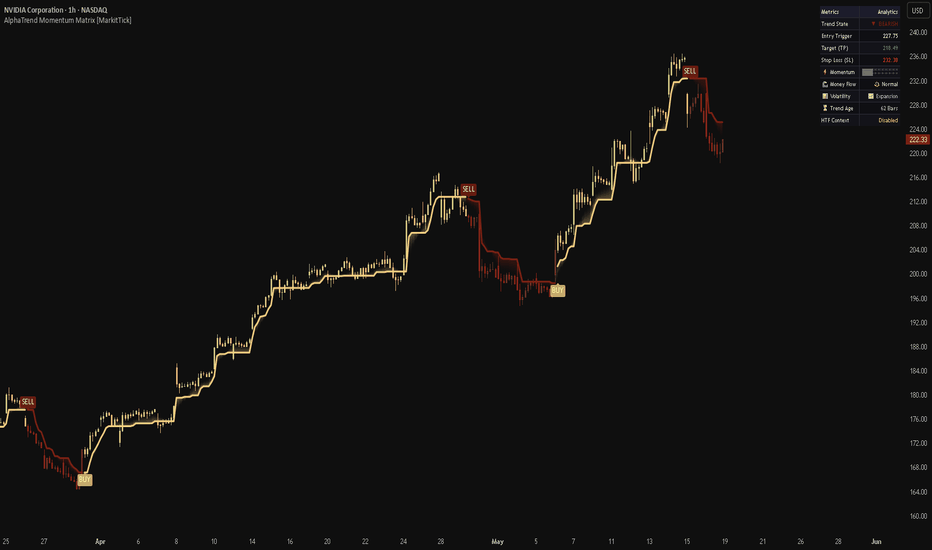
AlphaTrend Momentum Matrix [MarkitTick]💡 The AlphaTrend Momentum Matrix is an advanced, comprehensive trend-following architecture designed to dynamically track market momentum, manage dynamic trade states, and seamlessly bridge the gap between technical charting and automated execution. Far from a simple overlay, this script acts as a multi-layered analytical suite. It evaluates primary trend direction using volatility and volume-weighted money flow, filters out market noise with a custom state-matrix, and projects actionable higher-timeframe data onto the active chart. Furthermore, it incorporates an internal mathematical framework capable of dynamically calculating strict risk-to-reward targets and dispatching meticulously formatted JSON payloads for external webhook execution.
✨ Originality and Utility
● The Momentum Matrix Advantage
While traditional trend indicators rigidly lock onto moving averages or standard price bands, the AlphaTrend Momentum Matrix thrives on market dynamism. Its true utility lies in its multifaceted approach to trend validation. It introduces an exclusive "ATR Breakout Override" system—a custom logic module that forces a trend recalibration if an explosive price movement severely disrupts the standard deviation envelope, regardless of standard trailing conditions. This ensures the indicator remains highly responsive to sudden, high-impact market events without waiting for lagging conditions to catch up.
● Automated Payload and State Management
A standout feature of this tool is its embedded Trade State system. It does not merely paint a signal on the chart; it internalizes the exact entry price, computes a precise stop-loss based on the active AlphaTrend baseline, and mathematically projects a 1:2 risk-to-reward Take Profit target. This localized tracking seamlessly interfaces with the built-in Alert Engine, dynamically injecting these critical metrics into formatted JSON templates ready for third-party automated execution systems.
🔬 Methodology and Concepts
● AlphaTrend Core Engine
The primary directional engine relies on the interplay between the Average True Range (ATR) and the Money Flow Index (MFI). A trailing upper band (Support) and lower band (Resistance) are calculated using a user-defined ATR coefficient. The script interrogates the 14-period MFI; if the MFI reads above 50, indicating positive money flow momentum, the algorithm biases toward the Support band, updating it only when the price makes higher lows. Conversely, an MFI below 50 shifts the bias to the Resistance band.
● Breakout Override Protocol
To counteract the inherent lag of volume-weighted smoothing, the indicator employs a momentum breakout scanner. By measuring the absolute distance between the previous two closing prices and comparing it against the prior ATR multiplied by a sensitivity factor, the script can definitively detect volatility shocks. If a shock occurs concurrently with a directional price cross over the active AlphaTrend line, the system immediately forces a directional shift, bypassing the standard MFI requirements.
● Signal Filtering and Matrix Constraints
Raw signal crossovers are notoriously noisy during consolidation. To mitigate whipsaw trades, this script implements a continuous loop counter (the K and O matrices). It tracks the consecutive bars since the last primary buy or sell condition. A signal is only declared "valid" if it successfully breaks the historical sequence of the opposing trend counter, ensuring that localized micro-fluctuations do not trigger premature trade entries.
🔍 Deconstruction of the Underlying Scientific and Academic Framework
● Volatility and the Average True Range
Developed by J. Welles Wilder Jr. in 1978, the Average True Range is a foundational pillar of this indicator. The ATR scientifically quantifies absolute market volatility by decomposing the entire range of an asset's periodic price action, factoring in gaps and limit moves. By applying a multiplier to the ATR, this script establishes a statistically significant standard deviation envelope, distinguishing between normal market "breathing" and definitive structural shifts.
● Volume-Weighted Momentum via Money Flow Index
The MFI, created by Gene Quigley and Colin Dysart, represents an evolution of the Relative Strength Index (RSI). From an academic standpoint, the MFI incorporates volume into its momentum calculation, producing a more robust metric of buying and selling pressure. It uses the Typical Price (High + Low + Close / 3) multiplied by volume to calculate raw money flow. The 50-level threshold serves as the equilibrium point; sustaining above this level empirically signifies net accumulation, providing the mathematical justification for the indicator's bullish bias.
● Algorithmic State Machines
The signal filtering mechanism and the internal Trade State tracker are practical applications of Finite State Machines (FSM) commonly used in quantitative algorithmic design. The script holds memory of its current operational state (Long, Short, Neutral) and refuses state transitions unless specifically validated mathematical conditions (boolean logic gates) are met, significantly reducing error rates inherent in purely reactive, memory-less indicators.
● Repainting and Lookahead Warning
This script utilizes the request component to pull Higher Timeframe (HTF) context into the primary chart. Crucially, it employs the barmerge.lookahead_on parameter. While this creates a visually perfect, non-lagging representation of higher timeframe trends when analyzing historical data, it introduces lookahead bias. Traders must understand that historical HTF visuals and signals may appear with perfect precision on past bars, but real-time execution will lack this future data context, potentially resulting in different localized behavior in live markets.
🎨 Visual Guide
● The AlphaTrend Trailing Line
Up Trend (Bullish): A bold, solid step-line tracking below the price, rendered in a distinctive golden-yellow (#F0D080).
Down Trend (Bearish): A bold, solid step-line tracking above the price, colored in a deep crimson (#7A2010).
● The Cloud Fill
Dynamic Channel: A semi-transparent shaded area connecting the active AlphaTrend line to a central Cloud Reference Line (a smoothing of the typical price). This cloud visually represents the buffer zone of the current trend.
Color Coding: The cloud dynamically changes color to match the dominant trend (Gold for bullish, Crimson for bearish), allowing for rapid peripheral analysis of market conditions.
● Price Action Overrides
Colored Candles: The bodies and wicks of the actual price candles are uniformly colored to reflect the AlphaTrend matrix state, instantly identifying periods of alignment or divergence.
● Execution Elements
Signal Labels: Distinct "BUY" and "SELL" textual shapes appear precisely on the chart at the moment the state matrix validates a trend shift.
HTF Stepline: When enabled, a secondary, smoothed step-line appears to show the overarching macro trend, colored accordingly to dictate the broader market regime.
📖 How to Use
● Trend Riding and Context
The most effective way to utilize this tool is to align the primary chart timeframe with the HTF AlphaTrend line. If the HTF line is Gold, you should strictly look for "BUY" signals generated by the primary indicator to trade in the direction of the macro trend, ignoring temporary bearish signals as minor pullbacks.
● Momentum Breakout Confirmation
When you observe a sudden color change accompanied by an unusually large price bar, this is often the Breakout Override triggering. These scenarios represent high-momentum events. Instead of waiting for a retest, aggressive traders may use these specific signals to capture immediate volatility expansions, placing their stop-loss strictly on the opposite side of the newly formed AlphaTrend line.
● Automating Your Strategy
For quantitative traders, the indicator handles the heavy lifting of trade logic. Ensure you configure the exact JSON payload strings required by your third-party execution platform (like 3Commas, PineConnector, etc.) in the settings. The indicator will autonomously calculate your risk/reward parameters upon every valid signal and fire a perfectly formatted JSON alert.
⚙️ Inputs and Settings
• ⚙️ Core Calculations
ATR Multiplier: Defines the sensitivity of the trailing line. Lower values (e.g., 0.5) track price closely for scalping; higher values (e.g., 2.0) provide wide breathing room for swing trades.
ATR & MFI Lookback Period: The standard window (default 14) for calculating both volatility and volume momentum.
Display Signals: Toggles the visibility of the "BUY" and "SELL" chart labels.
• 🛡️ Breakout Override
Enable ATR Breakout Override: Turns the momentum-shock detection system on or off.
Breakout Sensitivity: Determines how large a price jump must be (relative to the ATR) to force a trend change. Lower values trigger more aggressively.
• 🕐 Higher Timeframe
Show HTF AlphaTrend: Projects the higher timeframe data onto the current chart.
HTF Timeframe: The specific macro timeframe to monitor (e.g., Daily "D" when trading on the 1-Hour chart).
• ☁️ Cloud Fill
Show Cloud Fill: Toggles the visual buffer zone on the chart.
Cloud Reference Length: Adjusts the smoothing period of the central reference line.
Color Candles: Enables or disables the overriding of standard chart candle colors based on trend direction.
• 🔌 Webhook Execution Config
Payload Actions: Four distinct text fields where you can define the exact syntax your external bot requires for entering longs, entering shorts, closing longs, and closing shorts. These values are automatically injected into the dynamic JSON alert string.
⚠️ Disclaimer
All provided scripts and indicators are strictly for educational exploration and must not be interpreted as financial advice or a recommendation to execute trades. I expressly disclaim all liability for any financial losses or damages that may result, directly or indirectly, from the reliance on or application of these tools. Market participation carries inherent risk where past performance never guarantees future returns, leaving all investment decisions and due diligence solely at your own discretion. Indicatore
ATR Exceedance Probability Model [LuxAlgo]The Volatility Exceedance Probability Model (VEPM) indicator is a comprehensive statistical tool designed to quantify the significance of volatility spikes, determine the likelihood of trend continuation, and categorize market environments into specific regimes.
🔶 USAGE
The indicator provides a multi-layered view of volatility, allowing traders to distinguish between standard market noise and statistically significant "exceedance" events.
🔹 Oscillator Interpretation
The main oscillator plots the current exceedance frequency (the rate at which price or range breaches ATR-based thresholds) against a long-term baseline.
Bullish/Significant Glow: When the Z-Score of the frequency exceeds the sensitivity threshold, the oscillator glows green, indicating a high-probability volatility expansion.
Bearish/Normal Glow: When the frequency falls below the baseline, the oscillator shifts toward red, signaling a contraction in volatility.
Frequency Delta: The area between the current frequency and baseline frequency is filled to highlight the momentum of volatility expansion or exhaustion.
🔹 Chart Visuals & Regimes
The script overlays information directly on the price action to provide context:
ATR Bands: Dynamic bands based on the Average True Range act as the "exceedance" barrier.
Regime Boxes: The indicator automatically identifies "Quiet," "Normal," and "High Vol" regimes. These are visualized as colored boxes (defaulting to High Vol) to show the duration and range of specific volatility climates.
Significance Dots: Circles appear at the top of the chart to mark bars that have breached the volatility threshold.
🔹 Dashboard Metrics
A real-time dashboard provides quantitative data:
Exceedance Freq: The percentage of bars in the short-term window that breached the ATR levels.
Serial Break Prob: The historical probability that a breach will be followed by another breach (continuation).
Clustering Edge: The statistical advantage of volatility clustering; a positive value suggests that volatility is currently feeding on itself.
🔶 DETAILS
The VEPM operates on the principle that volatility is not constant but "clusters" in time. It uses the following logic to derive its metrics:
Exceedance Detection: It calculates whether the current price range (True Range) or price levels (High/Low) exceed a user-defined ATR multiplier.
Statistical Z-Score: By comparing the current frequency of these breaches to a long-term baseline (200 bars by default), the model calculates a Z-Score to determine if the current activity is statistically "abnormal."
Continuation Probability: The model looks back at previous breaches and calculates how often they resulted in immediate follow-through, providing a "Serial Break" percentage.
🔶 SETTINGS
🔹 Core Settings
ATR Length: The lookback period used for the Average True Range calculation.
ATR Multiplier: The threshold used to define what constitutes a "breach" or exceedance.
Breach Detection Method: Choose between comparing the bar's total range to ATR or checking if price levels exceed the previous bar's bands.
🔹 Statistical Windows
Short-Term Window: The period used to calculate the current exceedance frequency.
Baseline Window: The long-term period used to establish the "normal" mean of volatility frequency.
Z-Score Sensitivity: Determines the threshold for identifying statistically significant volatility spikes.
🔹 Visuals
Show ATR Bands: Toggles the visibility of the ATR-based levels on the chart.
Bands Mode: Determines if bands are offset from a central basis (SMA/EMA) or from the bar's High/Low.
Regime Box Options: Toggles background boxes for Quiet, Normal, or High Volatility regimes.
🔹 Dashboard
Dashboard: Enables or disables the on-screen information table.
Position/Size: Controls the location and scale of the dashboard UI.
Indicatore

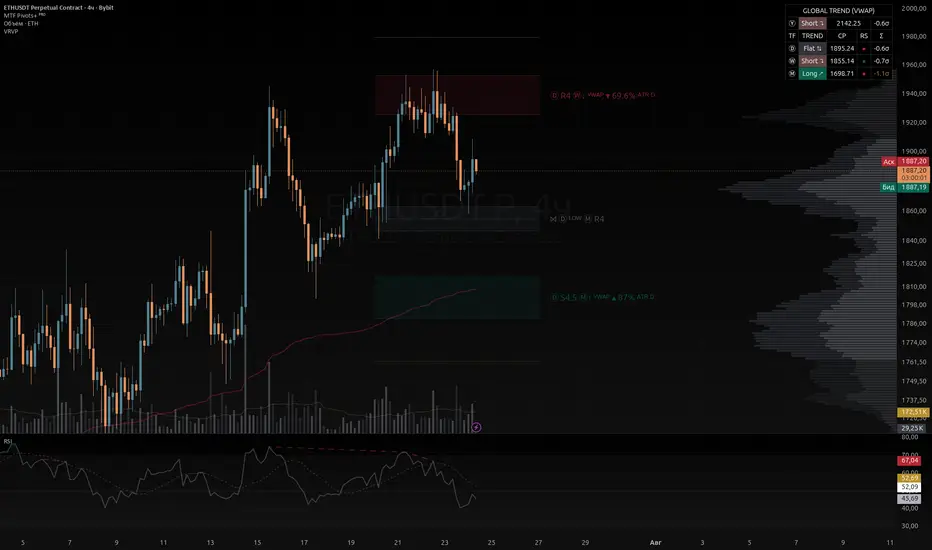
MTF Pivot+ (Camarilla & CPR)MTF Pivot+ is an advanced indicator that combines Camarilla levels and Central Pivot Range (CPR) zones with multi-timeframe (MTF) analysis. It equips traders with a powerful toolkit to identify key support and resistance zones, analyze market trends, and pinpoint precision entry areas for both day trading and swing trading!
Key Features:
⏱️ Smart Auto-Timeframe: Automatically selects the optimal higher timeframe for calculating levels based on your current chart (e.g., Daily levels for intraday charts up to 30m).
🎯 Central Pivot Range (CPR): Displays the CPR zone (CP, BC, TC) with built-in trend analysis. The zone automatically changes color depending on its shift relative to the previous period (bullish, bearish, or flat).
📊 Camarilla Pivot Levels: Comprehensive calculation of internal levels (R1-R2 / S1-S2), key reversal zones (R3 / S3), breakout extremes (R4 / S4), and extended targets (R5-R6 / S5-S6).
🔄 Dynamic (Rolling) Pivots: Option to calculate levels from the previous day's close for daily dynamic updates, while still maintaining the true highs and lows of the higher timeframe.
💱 Advanced Futures Support: Seamlessly use continuous contracts and calculate pivots based on the Last Traded Price (LTP) instead of exchange settlement prices.
🎛️ MTF Dashboard: A compact, sleek on-chart panel showing the current price's position relative to the Central Pivot (CP) across Daily, Weekly, and Monthly timeframes at a single glance.
🔔 Comprehensive Alerts System: Built-in alerts with a smart "cooldown" feature for CPR crosses, touches of reversal zones, R4/S4 breakouts, and previous period High/Low breaches.
🎨 Highly Customizable: Easily toggle specific levels or features on/off (for example, enabling HLC mode hides main levels) to keep your charts clean, focused, and informative!
⚠️ Disclaimer:
This indicator is provided solely for educational and informational purposes. It does not constitute financial, investment, or trading advice.
Please keep the following important points in mind:
High Risks: Trading in financial markets (cryptocurrencies, forex, stocks, futures) involves a high level of risk and may result in the partial or total loss of your capital.
No Guarantees: Indicators are based on the mathematical analysis of past price data. Past price movements and successful level tests do not guarantee future profits.
Do Your Own Research (DYOR): Never make trading decisions based solely on the readings of a single indicator. Always conduct your own comprehensive market analysis, consider the overall context, and employ strict risk management.
Responsibility: You use this script entirely at your own risk.
Indicatore

ATR, DTR and Stop LossATR, DTR and Stop Loss
Compact TradingView overlay table for daily ATR, daily trading range, and ATR-based stop-loss reference levels.
Features
Shows ATR / DTR with DTR as a percent of ATR.
Shows ATR-based stop-loss guidance using 0.25 ATR and 0.5 ATR.
Optional display modes:
ATR distance values only
Stop prices using close - 0.25 ATR and close - 0.5 ATR
Stop prices with ATR distance values in parentheses
Default table position is bottom-left.
Includes an extra blank spacer row so the table is less likely to be hidden by TradingView UI icons.
Uses muted, non-invasive table colors.
Settings
Table Position: Choose where the table appears.
Text Size: Tiny, Small, Normal, or Large. Default is Normal.
ATR Length: Daily ATR period. Default is 14.
Stop Loss Format: Choose ATR values, stop prices, or stop prices plus ATR values. Default is Stop Prices.
Show $ Prefix: Toggle dollar-style formatting on/off.
Indicatore

ADX Filtered Average True RangeOverview
This indicator combines ATR-based volatility measurement with ADX directional filtering to highlight only those moments when volatility expansion is aligned with confirmed trend momentum. Raw ATR measures how much price moves per bar, but a rising ATR alone says nothing about direction or conviction. By layering an ADX filter on top, the indicator separates meaningful expansion — where volatility is growing in the direction of a strengthening trend — from choppy noise where volatility rises without directional follow-through.
The result is a two-signal system displayed in a separate pane: a smoothed ATR line that changes colour only when the trend is directionally confirmed, and a background highlight that activates only when all three conditions align — expanding ATR, a rising directional ADX signal, and a bar that closes in the direction of the trend. This gives traders a compact, at-a-glance read on whether current volatility is actionable or should be ignored.
The indicator is designed for swing and intraday traders on instruments with clear trending behaviour, such as NSE:NIFTY , NSE:BANKNIFTY , MCX:CRUDEOIL1! , and major crypto pairs.
How It Works
ATR is calculated by applying the selected smoothing method to the true range series. A second SWMA pass (smoothed ATR, atrs ) acts as a baseline — when raw ATR rises above atrs and atrs itself is also rising, the indicator treats volatility as actively expanding:
atr = ma_function(ta.tr(true), atrlen)
atrs = ta.swma(atr)
ATRExpanding = (atrs > atrs and atr > atrs)
The ADX filter uses Pine's native ta.dmi() to compute DI+, DI−, and raw ADX. A SWMA of ADX ( sadx ) acts as the directional baseline. Bullish ADX is confirmed when sadx is rising, ADX is above sadx , DI+ shows momentum or dominance over DI−, and DI+ is above 15. Bearish ADX mirrors this using DI−:
sadx = ta.swma(adx)
ADXUp = sadx > sadx and adx > sadx and (diplus > diplus or diplus > diminus) and diplus > 15
ADXDn = sadx > sadx and adx > sadx and (diminus > diminus or diminus > diplus) and diminus > 15
Background highlighting only fires when all three conditions are simultaneously true — expanding volatility, directional ADX confirmation, and a bar closing in the expected direction.
Colour key:
Dark red line — raw ATR; always visible as the volatility baseline
Thick white line — smoothed ATR (SWMA of ATR); the trend-adjusted volatility baseline
Green background — ATR expanding + bullish ADX confirmed + bullish bar (close > open)
Red background — ATR expanding + bearish ADX confirmed + bearish bar (close < open)
No background — ATR contracting, or ADX directional filter not met, or bar indecisive
Inputs
ATR – Length — Number of bars used to smooth the true range for ATR calculation. Constrained to the Fibonacci sequence for harmonic alignment. Low (e.g. 5): fast, reactive ATR that tracks short-term volatility spikes. High (e.g. 55): slow, structural ATR that filters out minor fluctuations. Default: 13.
Smoothing — MA method applied to the true range when computing ATR. RMA (Wilder's moving average) is the industry standard and matches most platform ATR implementations. SWMA is the most responsive with zero lag; VWMA incorporates volume weight. Default: RMA.
ADX – Length — Lookback period for the DMI/ADX calculation via ta.dmi() . Low (e.g. 8): ADX responds faster, triggers more frequently but with more false positives. High (e.g. 55): ADX requires sustained directional pressure before confirming. Default: 34.
ADX – Smoothing — Smoothing period applied inside ta.dmi() to derive the signal line (lensig). Low (e.g. 1): raw, unsmoothed ADX. High (e.g. 13): heavily smoothed ADX that lags but reduces whipsaws. Default: 3.
Usage Notes
A green or red background is a confluence signal, not a standalone entry. Use it to confirm setups identified on your primary chart — price action, structure, or another trend tool.
When the background is absent despite a strong price move, treat this as a caution flag. Either ATR is contracting (move may be running out of energy) or ADX disagrees with direction (possible counter-trend move).
The DI threshold of 15 acts as a minimum directional noise filter. In low-volatility instruments or compressed consolidation phases, ADX rarely satisfies this condition — this is intentional behaviour, not a bug.
The Fibonacci-constrained length inputs encourage harmonic consistency across ATR and ADX settings. Consider pairing lengths that share a ratio — for example ATR 13 with ADX 34, or ATR 21 with ADX 55.
On shorter timeframes (1m–5m), set ATR Length to 5 or 8 and ADX Length to 13 or 21 for responsive signals. On daily or weekly charts, 34/89 or 55/144 combinations work well.
This indicator plots in a separate pane. Keep your price chart uncluttered — the background colour bleeds through to the main chart, providing context without requiring you to watch the pane constantly.
Recommended Pairings
This indicator pairs well with a trend-following overlay such as a Hull MA, VWAP, or a multi-timeframe EMA ribbon to confirm the broader bias before the background activates. Volume indicators — particularly Volume Delta or On-Balance Volume — add a useful layer of confirmation when the background fires, helping distinguish absorption-driven moves from thin-market noise. For Indian derivative traders, pairing with an open-interest change indicator on NSE:NIFTY or NSE:BANKNIFTY options can sharpen entry timing during background signals. Indicatore

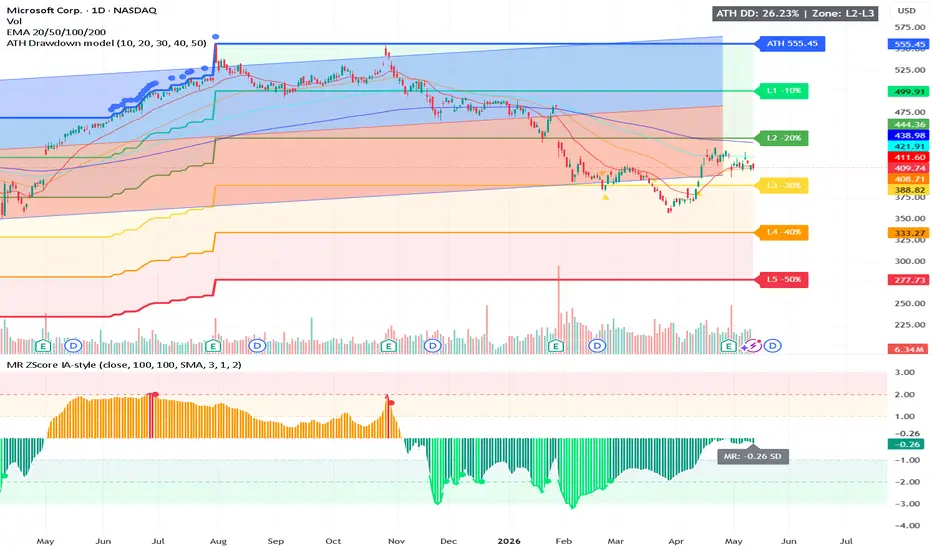
ATH Drawdown modelBest way to use:
On this model, the most useful reclaim alerts are usually L4, L3, and L2, because they often mark recovery from deeper drawdown zones back into improving structure. The cleanest use is on Daily, with 12H or 6H for earlier but still confirmed signals, always based on the completed candle close rather than mid-candle movement.
Clean interpretation:
A simple interpretation rule would be:
>Entered L4/L5: deep drawdown / stress zone.
>Reclaimed L4: early recovery signal.
>Reclaimed L3: stronger improvement in structure.
>Reclaimed L2: recovery gaining real traction
How to interpret “dead” names
Using this model, a name looks more structurally broken when it spends long periods in L4/L5, fails to reclaim those levels on confirmed bar closes, or reclaims them briefly and then loses them again. The Patreon guidance does not define “dead stock” directly, but it does emphasize using confirmed bar-close behavior rather than intrabar noise, so the meaningful signal is not a bounce during the candle — it is whether the level is reclaimed and held at candle close.
Best timeframe
The Patreon post says daily is great, while 12-hour or 6-hour can show direction changes earlier as long as you still confirm on bar close. So a practical setup is daily for your main map, 12H for earlier tactical signals, and 6H only when you want more responsiveness and accept more noise.
NO FINANCIAL ADVICE Indicatore

ATR Volatility Regime [NovaLens]Volatility regime tool built to separate two things ATR alone cannot tell you apart: where volatility currently sits in its own rolling history, and which direction the regime is rotating. Adds a velocity-gated release event on top, so the indicator flags fast coiled-spring releases on the confirmed bar - and refuses to fire on the slow leaks that only look like one.
Most volatility tools collapse one axis. A raw ATR plot tells you the bar range and nothing about whether that range is rare. A percentile-rank histogram tells you the rank but not whether vol is loading or unloading. ATR Volatility Regime separates the two by design:
Tier tracks where volatility sits in its own rolling history (Compression / Quiet / Normal / Elevated).
Phase tracks where volatility is rotating (Rising / Topping / Falling / Bottoming).
A Compression reading is not a breakout signal. It is the market saying "vol is loaded." Whether it actually releases depends on the next move. When a sustained compression actually breaks above mid-rank within a 5-bar velocity window, the indicator prints a Release diamond and pulses the pane background. Slow leaks that drift through Quiet for more than 5 bars are canceled, not reported. That single gate is what separates a real coiled-spring release from a sideways drift.
════════════════════════════════════════════
◉ HOW IT WORKS
The vol input. Wilder ATR over the chosen length, expressed as a percentage of close so the read is comparable across price levels and instruments. Mathematically guarded to stay clean across historical data gaps and unusual price series.
The percentile rank. The current ATR% is ranked against its own rolling lookback window (100 / 200 / 300 bars by Horizon). This is an asset-calibrated percentile - "P75 on BTC" means "vol higher than 75% of the last 200 BTC readings," not a market-wide cutoff. The same indicator works across SPY, BTC, EURUSD, and XAU without retuning. The raw rank drives the state engine; an EMA-smoothed copy drives the visual line so the plot reads calm without numbing event detection. Warm-up is honest: until the lookback fills, the panel shows "Warming up" and refuses to assign a tier. NA never collapses to a fake Normal.
The tier model. Four tiers cut on rawRank (P25, P50, P75) with asymmetric hysteresis: 1 confirmed bar to step up (so a vol breakout is not missed), 3 confirmed bars to step down (so a tier change only confirms when vol has actually died). The ribbon fill and oscillator line both color by tier. Extreme is a signal class, not a tier; it would flicker on and off at the P90 boundary if we colored the ribbon by it.
The phase model. Four phases (Rising / Topping / Falling / Bottoming) read off the rawRank slope. Slow rotations need 2 bars of confirmation to flip; violent moves with |delta rank| > 15 bypass the confirm and flip immediately. Peak and trough detection is plateau-aware: a strict ( greater-than on both sides) check missed the patterns where ATR percentile pins at 100 for multiple bars, so the algorithm uses greater-or-equal on the left side and greater-than on the right.
The events. Three signature events, each with its own gating:
Compression Release : velocity-gated. The Compression tier must run at least 10 bars to load the spring; on exit, rawRank must reach the mid (>= 50) within a 5-bar window. Slow leaks that drift through Quiet for more than 5 bars are canceled. Re-entering Compression also cancels the pending episode.
Extreme Touch : rawRank peaks at >= 90. Re-arm runs through a three-valve cascade (rank drop to <= 75, a higher pivot with a +2 rank headroom so a 98 peak after a 97 cannot re-fire, or 2x lookback time decay) so the same Extreme arc cannot duplicate-fire, but a genuinely higher pivot in the same arc still counts.
Cooling : armed when an Extreme fires; fires on the first confirmed bar after where rawRank falls below 75 within a 10-bar window. Disarms on fire or when the window expires. The armed-latch architecture means fast drops out of an Extreme are tracked after the Extreme event arms Cooling, instead of relying on a single fragile cross check that would miss the drop if the threshold was already crossed on the Extreme bar itself.
The Playbook Lens. Pure interpretation layer. Engine, percentile, tier, phase, and objective events are identical across lenses. The Lens recolors three visual surfaces only: the panel Playbook row text and tone, the Playbook Heatmap Strip at y = -5, and an optional Tint Price Candles by Playbook Fit overlay. Switching the Lens dropdown answers a different question against the same volatility truth: "does this regime align with the workflow I am running?" - context, never a directive.
════════════════════════════════════════════
◈ HOW TO READ IT
The pane shows the smoothed percentile rank line wrapped in a tier-colored ribbon with a Volatility Glow halo that breathes wider in the loaded zones (Compression and Extreme) and tightens in Normal. Threshold lines mark P25, P50, P75, and P90.
Deep blue (Compression): rawRank in [0, 25). Loaded spring.
Light blue (Quiet): rawRank in [25, 50). Below median, not stretched.
Gray (Normal): rawRank in [50, 75). Typical bar ranges.
Orange (Elevated): rawRank in . High vol relative to recent history.
Red (Extreme): event color, not a tier. Drives Extreme Touch markers.
Teal (Release): event color, not a tier. Drives Compression Release markers.
Markers, in order of conviction:
Compression Release (diamond on the line, Release color, with a matching pane background pulse): a >= 10 bar compression run resolved into Normal+ within 5 bars. Non-directional by design - a volatility state change, not a price direction call.
Extreme Touch (small circle anchored to the actual peak bar, Extreme color): rawRank just peaked at or above the 90th percentile of its rolling history. Reads as topping pressure of vol, not a directional reversal call.
Cooling (panel-only event, no chart marker): the first confirmed bar after an Extreme where rawRank fell back below 75 within a 10-bar window. Surfaces in the Last Event row and the Cooling alert.
The info panel synthesizes six rows: Volatility (tier + P-Score), Flow (phase), Age (bars in tier + the per-tier duration percentile so a 200-bar Quiet stretch is compared against historical Quiet stretches, not Elevated), Last Event / Context (state-based decay, no fixed timer), ATR Range (current bar range as % of price, with absolute price-unit ATR in the row tooltip), and Playbook (the Lens context read).
The Last Event row uses state-based decay , not an arbitrary 10-bar timer. A Compression Release stays visible while phase is Rising or tier is Normal+. An Extreme Touch stays visible while tier is Elevated. A Cooling read stays visible while tier is Normal or Elevated. When the event's regime context expires, the row returns to Context and summarizes the current regime instead of resizing or disappearing.
════════════════════════════════════════════
✦ HOW WE USE IT: THE COILED-SPRING ARC
This is the arc the indicator is built to catch - not the only path. Many compressions resolve sideways without a confirmed release, and the velocity gate is what filters those out.
A common pattern on a liquid index or crypto chart, Swing profile (default), Neutral lens: the line drops into Compression and parks there for 15-30 bars. The ribbon turns deep blue, the Glow widens, and the panel Age row may read something like "Mature · 22 bars" or "Extended · 22 bars" - meaning the current run has already lasted longer than most recent Compression stretches on this market. The spring is loaded.
The full arc reads in four panel updates:
Release. rawRank reaches 50+ within the 5-bar velocity window after exiting Compression. A Release diamond prints on the line, the pane background pulses teal for one bar, and the Last Event row reads "Compression Release".
Run. Within a few bars the tier transitions through Normal into Elevated, the phase row flips Rising, and the smoothed line climbs toward the upper distribution.
Touch. If the move keeps loading, rawRank peaks at 92-98 and an Extreme Touch circle prints on the peak bar - the smoothed line is now in the upper edge of its own rolling distribution. The Last Event row updates to "Extreme Touch".
Unwind. Within 10 bars rawRank falls below 75. Cooling fires and the Last Event row updates again.
The Playbook Lens reframes the same arc without changing a number. Flip to Breakout: the Heatmap Strip lights teal during the release window (favorable) and dims toward red as the move stretches into Extreme (less favorable). Flip to Mean Reversion: the strip stays red through the release (vol is the wrong direction for fading) and only lights teal when Cooling confirms and tier drifts back through Normal toward Quiet. Flip to Risk Control: Compression marks calmer bar-range context, Elevated and Extreme mark the wider-bar context. Same volatility truth, different playbook fit. The engine is identical across lenses; only the interpretation layer changes.
════════════════════════════════════════════
✦ OTHER APPLICATIONS
Breakout context : Compression Release diamonds after a loaded quiet regime, optionally combined with the Heatmap Strip reading favorable under the Breakout lens
Trend context : Rising Elevated or Rising Normal volatility as movement context for an external trend plan
Mean-reversion context : quieter or cooling regimes that may be more suitable for contained-range workflows
Volatility risk overlay : Elevated and Extreme states as wider-bar context when reviewing size, stops, or trade frequency
Vol regime classifier : use the Volatility row + Flow row in the panel as a top-down filter for any external trade plan, independent of the Lens
Alert-driven workflow : subscribe to Compression Release + Extreme Touch + Cooling and check the chart only when the volatility regime actually changes, not every bar
════════════════════════════════════════════
⚙ GETTING STARTED
ATR Volatility Regime ships with three pre-tuned Horizon profiles plus a Custom override. Pick a horizon and start reading the regime:
Intraday : ATR 14, lookback 100, smoothing 3. Faster events, lighter hysteresis (1 up / 2 down). Use on 1m through 1H charts.
Swing (default) : ATR 14, lookback 200, smoothing 5. Balanced. Start here on 1H through 1D charts.
Long-Term Hold : ATR 20, lookback 300, smoothing 5. Slower, rarer events, heavier hysteresis (2 up / 3 down). Use on 1D and above.
Custom : full manual control of ATR Period, Lookback Window, and Smoothing.
Core settings:
Horizon : selects the tuning bundle above. Start with Swing.
ATR Period (Custom) : Wilder ATR period for the volatility input, in BARS. 14 is the standard. Shorter = more reactive; longer = smoother. Applies only when Horizon = Custom.
Lookback Window (Custom) : rolling lookback the ATR% is percentile-ranked against. Larger = smoother distribution, fewer extreme reads, slower compression releases. Smaller = sharper, more events.
Smoothing (EMA) (Custom) : EMA bars applied to the percentile-rank for the visual DISPLAY layer (plot, ribbon, panel readouts). The RAW rank still drives tier, phase, and events - smoothing only calms the visual. Set to 1 to disable smoothing.
Playbook Lens:
Neutral (default) : factual regime read, heatmap stays gray. Use this to learn the engine.
Breakout : range-expansion context. Loaded Compression and Compression Release read favorable; already-stretched Elevated or Extreme states shift toward caution.
Trend : directional-movement context. Rising Elevated and Rising Normal regimes read favorable; topping or cooling volatility shifts toward caution.
Mean Reversion : contained-range context. Quiet, Cooling, and Normal/Falling regimes read favorable; Release, Elevated, and Extreme regimes shift toward caution.
Risk Control : stretched-volatility context. Compression reads calm; Elevated and Extreme states warn that bar ranges are wide.
The Lens NEVER changes the engine - same tier, same phase, same Compression Release, same Extreme Touch, same alerts. Only the panel Playbook row text, the Heatmap Strip color, and the optional candle tint move.
Display:
Show Compression Releases (hero): diamond on the line + pane background pulse on release. On by default.
Show Extreme Touches : circle on the peak bar at rawRank >= 90. On by default.
Show Price Chart Markers : mirrors Compression Release diamonds and Extreme bar tints onto the price chart. OFF by default to keep the price chart clean.
Show Raw Rank Line : faint unsmoothed percentile rank line behind the smoothed display line. OFF by default. Toggle on to debug fast vol changes.
Show Volatility Glow : halo that widens at the loaded extremes (Compression and Extreme) and tightens in Normal. On by default.
Show Info Panel : 6-row state panel. On by default.
Panel Position : Top Right (default), Top Left, Bottom Right, Bottom Left, Middle Right.
Theme : Auto (detect chart background), Dark, or Light.
Show Playbook Heatmap Strip : thick band at y = -5 that recolors with the Lens. On by default.
Tint Price Candles by Playbook Fit : paints price-chart candles with the Release / Extreme palette per the active Lens. OFF by default; disabled automatically when Lens = Neutral.
Appearance / Palette (6 color pickers):
Compression, Quiet, Normal, Elevated, Extreme, Release - each on its own line with a state-explainer tooltip. The Display Rank line, Raw Rank, Tier Ribbon fill, Volatility Glow, Heatmap Strip, panel tier text, candle tints, and event markers all reference these inputs so users can adapt the palette (color-blind, light-mode, brand themes) without forking the script.
════════════════════════════════════════════
△ LIMITATIONS
Warm-up : the lookback window must fill before any tier is assigned. On Swing (200) that is 200 bars; on Long-Term Hold (300) that is 300. Until then, the panel shows "Warming up" and the state engine refuses to fake a Normal read.
Visual smoothing lag : the visible line is intentionally calmer than the raw engine. ATR is a backward-looking Wilder-smoothed measure, and the display line is lightly EMA-smoothed on top, so fast volatility expansions can look slightly delayed in the visible plot. The rawRank engine is the sharper layer underneath and is what actually drives the tier, phase, events, and alerts. The smoothed line is the readable copy; do not read a slight visual delay as the event engine being slow.
Percentile is relative, not absolute : a "Compression" read on a chronically quiet asset can still be wider than an "Elevated" read on a chronically loud asset. The indicator compares each asset against ITS OWN history, not across markets.
Regime shifts shrink the window : a structural vol regime change (e.g. a quiet 2-year period followed by a sustained higher-vol regime) takes about one lookback window to fully recalibrate. The first few weeks after a regime shift can read noisier than the steady-state.
Compression Release is non-directional : the diamond and the pane pulse tell you the spring released, not which way price went. Combine with directional context (trend, structure, or a separate momentum tool) for direction.
Extreme Touch is a state read, not a reversal call : rawRank pinning above 90 means vol is rare for this market; it does not mean price is about to reverse. Cooling tells you the unwind has begun, not where the next leg goes.
Playbook Lens is interpretation, not validation : the Heatmap Strip recolors regime context based on the active Lens. It is not a backtested edge - it is a quick visual answer to "does my workflow want this regime?"
════════════════════════════════════════════
🔔 ALERTS
Four alert conditions are built in so you can monitor without checking every bar manually:
Compression Release : a sustained compression (>= 10 bars) confirmed above mid-rank within 5 bars. The hero event.
Extreme Touch : rawRank peaked above P90. Fires on the bar after the actual peak (peak detection requires the next bar to confirm the turn-down).
Cooling : the first confirmed bar after an Extreme where rawRank falls below 75 within 10 bars.
Compression Entry : rawRank dropped below P25 (sustained tier transition into Compression).
All four alerts fire on bar close (gated on barstate.isconfirmed). Each alert message is a pure JSON payload with ticker, price, timeframe, and timestamp fields for webhook routing.
Four alerts by design - concentrated on the signature events. Tier and phase transitions stay visible in the info panel for users who want them on the chart, but they do not fire alerts. Keeping the alert stream lean is what makes "subscribe and let the regime come to you" a useful workflow instead of a notification flood.
════════════════════════════════════════════
⌁ NOTES
Based on the classical ATR percentile-rank construction, with asymmetric hysteresis and a velocity-gated compression-release definition layered on top.
Repaint: intrabar-only. Closed-bar alerts are confirmed; current-bar visuals may update until the bar closes. All alert conditions are gated on barstate.isconfirmed. Peak-confirmed events (Extreme Touch) print on the bar AFTER the actual peak, on a one-bar offset, so the marker aligns with the true peak bar.
References: J. Welles Wilder Jr., New Concepts in Technical Trading Systems (1978), Trend Research; percentile-rank concept widely used across volatility studies.
Open-source under MPL 2.0. Free to use, fork, study.
NovaLens Indicatore

Indicatore

Indicatore

Adaptive Flow II | AnonycryptousAdaptive Flow II | Anonycryptous
Description & user manual
Why this indicator is different
Most trend-following indicators use a fixed moving average. A 50-period EMA moves at the same speed whether the market is trending hard or grinding sideways. It cannot distinguish between a clean directional move and noise. It gives the same weight to a volatile consolidation as it does to a strong impulse. The result is signals that arrive late in trends and fire repeatedly during chop.
Adaptive Flow v2 works differently.
At its core is a Kaufman Adaptive Moving Average — a moving average that measures the efficiency of price movement on every single bar and adjusts its own speed accordingly. When price is moving cleanly in one direction with low noise, the flow line accelerates toward price. When price is churning sideways with high volatility and no direction, the flow line nearly stops moving. It adapts. Automatically. Without requiring any manual intervention.
V2 builds significantly on this foundation. It adds five configurable stop modes, full market structure detection through BOS and CHoCH events, three independent signal filters, dynamic extension bands, a session-anchored VWAP, and an expanded dashboard. The result is a complete adaptive trend and structure system — not just a trend indicator, but a context-aware trading framework.
Important notice
Adaptive Flow v2 generates signals based on technical indicator alignment.
These signals are not financial advice.
They do not predict the future.
They do not guarantee profitability.
All trading decisions are made entirely by the user.
Always manage your own risk. Always apply your own judgment.
1. Overview
Adaptive Flow v2 is an adaptive trend-following indicator built around a Kaufman Adaptive Moving Average with a configurable stop engine and full market structure detection.
What it includes:
- Kaufman Adaptive Moving Average rendered as a neon glow line with four stacked plot layers
- Five stop modes: ATR Trailing, Supertrend, Chandelier, Donchian, and Volatility Pivot
- Cloud fill between the flow line and the stop line, reflecting the current trend state
- Dynamic extension bands above and below the flow line at configurable ATR distance
- BOS and CHoCH structure detection with BOS confirmation filter
- Pivot high and low target lines that change color when broken
- EMA 200 macro trend filter with higher timeframe support
- ADX filter for directional environment confirmation
- Session filter to restrict signals to a configurable trading window
- Signal cooldown to prevent repeated triggering
- Session-anchored VWAP with daily and custom session modes
- Bar coloring reflecting the current trend state
- Three presets: default, fast, and smooth
- Live dashboard with 13 data rows
- Seven alert conditions
2. The flow line — Kaufman Adaptive Moving Average
The flow line is the visual heart of Adaptive Flow. On every bar it calculates an Efficiency Ratio — a measure of how directionally efficient price movement is relative to total volatility over the lookback period.
When the Efficiency Ratio is high — price is moving strongly in one direction with low noise — the flow line accelerates toward price. When the Efficiency Ratio is low — price is ranging with high volatility — the flow line nearly stops moving.
This adaptive behavior means the flow line naturally stays close to price during strong trends and pulls away only during genuine transitions. It is not a lagging average that mechanically follows price at a fixed delay. It responds to market character.
The flow line is rendered with four stacked plot layers — a sharp core at full opacity and three progressively wider, more transparent layers behind it — creating a neon glow effect that makes it visually distinct on any chart.
The noise filter adds an additional gate: KAMA only advances when the price displacement exceeds ATR × threshold. This prevents the flow line from reacting to insignificant micro-movements during low-momentum conditions. Disable it for maximum responsiveness in strong trending environments.
3. Stop engine — five modes
The stop engine calculates a dynamic stop level from the flow line. All five modes use the flow line as their reference point, not raw price. This means the stop inherits KAMA's adaptive smoothing before calculating any distance.
When the flow line crosses the stop level, the trend flips and a signal fires.
3.1 ATR Trailing (default)
The stop trails the flow line at a fixed ATR distance using a ratchet mechanism — it only moves in the direction of the trend and locks in the floor or ceiling. This produces the characteristic smooth, flowing wave that follows the flow line closely. The cloud between the flow line and the stop gives a live view of the trend zone width. Default and recommended for most users.
3.2 Supertrend
ATR band above or below the flow line with ratchet mechanism. Similar to ATR Trailing but calculated differently, producing a more angular step-like stop line. More angular appearance, fewer intermediate flips.
3.3 Chandelier
The stop trails the highest or lowest flow line value over a configurable lookback window, then subtracts or adds ATR × multiplier. Exits when the flow line has sustained a reversal beyond the lookback range. Better for trending markets where you want to trail a historical extreme rather than the current level.
3.4 Donchian
The stop follows the highest or lowest flow line value over a rolling window with no ATR component. Purely range-based. The stop level is exactly the rolling high or low of the flow line — clean, simple, no volatility scaling.
3.5 Volatility Pivot
The stop anchors to the last confirmed pivot high or low of the flow line plus an ATR buffer. Structurally aware — the stop sits at a level where the flow line previously reversed, not at an arbitrary distance. Best for traders who want the stop to respect structure rather than trail at a fixed distance.
4. Extension bands
When enabled, two bands are drawn above and below the flow line at ATR × multiplier distance. They are not stop levels — they are extension context. When price reaches the upper band during a bullish trend, it may indicate an overextended condition. When price compresses back toward the flow line after touching a band, it may indicate a pullback area. The bands move with the flow line and adapt to current volatility.
5. Market structure — BOS and CHoCH
Adaptive Flow v2 includes a full market structure detection engine that runs alongside the adaptive trend engine.
Pivot highs and lows are detected on price using configurable left and right bar lookbacks. When price closes beyond a confirmed swing level, the indicator classifies the event as either a Break of Structure or a Change of Character.
A BOS fires when price closes beyond a swing level in the direction of the existing structural trend — confirming continuation. Drawn as a dashed line
A CHoCH fires when price closes beyond a swing level against the existing structural trend — signaling a potential reversal. Drawn as a solid line.
The BOS confirmation requirement prevents false reversals. When set to 1 (default), at least one BOS must confirm the current structural trend before a CHoCH can flip it. This blocks the common false reversal where a sharp pullback briefly closes beyond a swing level before the trend reasserts.
Pivot target lines are drawn automatically at the last confirmed pivot high and low. They extend to the right and change color when price closes through them.
6. Signal filters
Three optional filters are available. All three can be combined. A signal only fires when all active filters agree.
EMA 200 — always active as a macro filter. Bullish signals only fire above the EMA 200. Bearish signals only below. Set the EMA 200 timeframe to a higher timeframe (1H or 4H) when trading on lower timeframes — the native EMA 200 on a 1-minute chart only covers a few hours and provides no meaningful macro context.
ADX filter — when enabled, signals only fire when ADX is at or above the configured threshold. Below this level the market is typically ranging and directional signals carry less weight. Default threshold of 20 removes the weakest trend environments.
Session filter — when enabled, signals only fire during the configured trading window. Defined in HHMM-HHMM format using exchange timezone. Outside the window the flow line continues calculating but no new signals are generated.
Signal cooldown — minimum bars between two signals in the same direction. Prevents repeated triggering during choppy conditions around the stop level.
7. VWAP
The VWAP provides a volume-weighted price reference that resets at the start of each session. It represents the average price paid weighted by volume — a key reference for intraday value and institutional order flow.
Daily mode resets every calendar day. Custom mode anchors to a specific session defined by start and end times in HHMM-HHMM format. Timezone selection ensures correct boundary alignment.
8. Presets
Three preset configurations are available. Selecting a preset overrides the core KAMA calculation parameters.
Default — balanced for swing trading on 4H and daily charts.
Adaptive length 14 | Fast constant 2 | Slow constant 30 | Noise threshold 0.3.
Fast — built for scalping on 1 to 15 minute charts.
Adaptive length 6 | Fast constant 2 | Slow constant 15 | Noise threshold 0.15.
Shorter lookback for faster momentum shift detection. Lower noise threshold preserves full adaptive speed.
Smooth — designed for position trading on daily and weekly charts.
Adaptive length 21 | Fast constant 3 | Slow constant 40 | Noise threshold 0.5.
Extended lookback demands sustained momentum before accelerating. Aggressive noise filtering for high-conviction reads only.
9. Dashboard
The dashboard displays the live state of all indicator components and updates on every bar.
Rows displayed:
- Adaptive Flow — indicator name with trend-colored header and current timeframe
- Trend — current flow line direction: bullish or bearish
- Stop Mode — active stop mode in use
- Structure — current structural direction from BOS/CHoCH logic
- EMA 200 — whether price is above or below the macro filter
- VWAP — whether price is above or below session value
- ADX — current ADX value with confirmation indicator
- Session — whether the session filter is active and the current bar is inside the window
- Noise Filter — whether the noise gate is active
- Stop Distance — distance from current close to stop level in ATR multiples and as a percentage
- Trend Bars — number of bars the current trend has been active
- BOS Count — number of confirmed BOS events in the current structural direction
- Signal — last signal fired: buy, sell, CHoCH, BOS, or none
10. Settings reference
KAMA & Calculation
- Price Source: input for the flow line calculation
- Adaptive Length: efficiency ratio lookback period
- Fast Constant: smoothing speed during trending conditions
- Slow Constant: smoothing speed during ranging conditions
- Enable Noise Filter: toggle the displacement gate
- Noise Threshold: minimum ATR multiple required to advance the flow line
- Preset: Default, Fast, or Smooth
Stop Engine
- Stop Mode: ATR Trailing, Supertrend, Chandelier, Donchian, or Volatility Pivot
- ATR Length: volatility measurement period
- ATR Multiplier: distance scaling for the stop level
- Stop Lookback: rolling window for Chandelier and Donchian modes
- Pivot Buffer: ATR buffer for Volatility Pivot mode
Market Structure
- Show BOS / CHoCH: toggle structure detection
- Pivot Left / Right Bars: swing confirmation lookback
- Max Structure Levels: maximum lines shown on chart
- BOS Required Before CHoCH Flip: false reversal filter
- Show Pivot Target Lines: toggle automatic target lines
- Target Line Color and Width
Signal Filters
- EMA 200 Timeframe: leave empty for chart timeframe
- Show EMA 200: toggle line and label visibility
- EMA 200 Color
- Enable ADX Filter: toggle directional environment gate
- ADX Length and Threshold
- Enable Session Filter: toggle session-based signal restriction
- Session Window: HHMM-HHMM format
- Signal Cooldown: bars between signals
VWAP
- Session: Daily or Custom
- Timezone: UTC, Exchange, or major financial center timezone
- Session Window: for Custom mode
- Show VWAP: toggle line and label
- VWAP Color
Visuals
- Bull Color and Bear Color
- Cloud Transparency: fill between flow line and stop
- Show Extension Bands: toggle ATR extension bands
- Extension Band Multiplier: distance from flow line
- Show Reversal Signals: toggle triangle markers
- Color Candles: toggle bar coloring
- Candle Transparency
Dashboard
- Show Dashboard
- Size: Tiny, Small, or Normal
- Position: Top Left, Top Right, Bottom Left, or Bottom Right
11. How to use
11.1 Initial setup
Select a preset matching your primary trading style. Set the EMA 200 timeframe to a higher timeframe when trading on lower timeframes — 60 for 1H, 240 for 4H. Set the VWAP to Daily or configure a custom session matching your primary market. Choose a stop mode — ATR Trailing is the default and works well across all timeframes. Enable the session filter and ADX filter if you want stricter signal conditions.
11.2 Reading the chart
The flow line and its glow indicate the current adaptive trend. Green indicates a bullish environment. Red indicates a bearish environment. The cloud between the flow line and the stop shows the trend zone width — a wide cloud indicates strong momentum, a narrowing cloud indicates the flow line is slowing.
The stop line is where the trend flips. A reversal signal fires when the flow line crosses it. Triangle markers appear at the stop line at the signal bar.
Extension bands show how far price has moved from adaptive value. Price at the upper band in a bullish trend may indicate overextension. Price returning toward the flow line after touching a band may offer a pullback reference.
BOS and CHoCH lines show structural context. Use them to understand whether the trend is in a confirmation phase (BOS firing repeatedly) or approaching a potential reversal (flow line slowing while price approaches a structural level).
11.3 Timeframe guide
1 to 5 minutes — Fast preset. EMA 200 timeframe set to 60 or 240. Session filter recommended.
15 to 30 minutes — Fast or Default preset. EMA 200 timeframe 240 or D.
1 hour to 4 hours — Default preset. Native EMA 200 or D timeframe.
Daily and above — Smooth preset. Native EMA 200.
11.4 Stop mode selection guide
ATR Trailing — best for most situations. Smooth, flowing, closely follows the flow line.
Supertrend — fewer flips, more angular. Good for lower timeframe noise reduction.
Chandelier — suited for trending markets where you want to trail a recent high or low.
Donchian — clean range-based stop with no ATR influence. Simple and transparent.
Volatility Pivot — best when you want the stop at a structurally meaningful KAMA level.
11.5 Context
Adaptive Flow v2 identifies adaptive trend direction and market structure. It does not filter by fundamental events, news, or macro calendar. A bullish signal during a risk-off macro event may fail more often than one in a clear trending environment. Always apply your own context and judgment alongside the indicator output.
12. Alerts
Seven alert conditions are available:
- Bull Trend: flow line crosses above the stop level, EMA 200 above, all active filters passed.
- Bear Trend: flow line crosses below the stop level, EMA 200 below, all active filters passed.
- Any Trend Change: fires on either bull or bear trend signal.
- Bull CHoCH: market structure flips to bullish via Change of Character.
- Bear CHoCH: market structure flips to bearish via Change of Character.
- Bull BOS: bullish Break of Structure confirms trend continuation.
- Bear BOS: bearish Break of Structure confirms trend continuation.
All alerts include exchange, ticker, and interval in the message.
13. Disclaimer
This indicator is provided for educational and informational purposes only.
All outputs are based on historical price action calculations and do not guarantee future results.
Trading financial instruments involves significant risk of loss.
Past performance does not indicate future results.
Use at your own discretion.
Indicatore

Indicatore

Volatility Gated Supertrend [BackQuant]Volatility Gated Supertrend
Overview
Volatility Gated Supertrend is a regime-aware trend-following indicator built around a modified Supertrend engine with an integrated volatility filter . Unlike a traditional Supertrend, which flips direction whenever price crosses its trailing bands, this version introduces a gating mechanism that can block trend reversals during low-volatility conditions .
The purpose of the indicator is simple:
Keep the responsiveness and structure of a Supertrend.
Reduce false flips during sideways or compressed conditions.
Allow trend transitions primarily when volatility is expanding enough to justify participation.
The result is a smoother and more selective trend engine designed to suppress whipsaws while still reacting to meaningful directional movement.
The full source structure for the indicator can be referenced here: :contentReference {index=0}
Core idea
Traditional Supertrend indicators work well during directional markets but struggle in compressed environments:
Price repeatedly crosses the trailing bands.
Trend direction flips too frequently.
False reversals appear during chop.
This indicator attempts to solve that problem by asking:
“Is there enough volatility expansion to justify accepting a new trend?”
Instead of blindly allowing every flip, the indicator measures:
Current volatility,
Baseline volatility,
Relative expansion or compression.
Only when volatility conditions are sufficient does the trend engine allow a directional transition.
What the Supertrend is
The Supertrend is a volatility-based trailing trend indicator built from:
ATR (Average True Range)
A central price source
A directional trailing stop structure
The classic logic:
Upper band = price source + ATR × multiplier
Lower band = price source − ATR × multiplier
These bands trail price dynamically:
In bullish conditions, the lower band ratchets upward.
In bearish conditions, the upper band ratchets downward.
When price crosses one of the bands:
The trend flips direction.
This creates a clean directional regime model.
How this version differs
The major difference is the volatility gate .
A normal Supertrend asks:
“Did price cross the band?”
This indicator asks:
“Did price cross the band, and is volatility strong enough to trust the move?”
That additional filter dramatically changes behavior in sideways conditions.
ATR and volatility structure
The indicator uses two ATR measurements:
Fast ATR → current short-term volatility
Slow ATR → baseline long-term volatility
The core ratio:
Volatility Ratio = Fast ATR / Slow ATR
Interpretation:
Ratio above threshold → volatility expansion
Ratio below threshold → volatility compression
This becomes the gate logic.
Volatility Gate Logic
The gate opens only when:
Fast ATR / Slow ATR ≥ Gate Threshold
If volatility is too compressed:
The gate closes.
Trend flips are blocked.
Importantly:
The Supertrend bands still calculate normally.
Price can still cross them.
But the directional state will not update while the gate is closed.
This distinction matters because it means:
The market may technically trigger a reversal,
But the indicator intentionally ignores it if volatility conditions are weak.
Why this helps
Most trend-following systems fail in chop because:
Small meaningless moves trigger directional flips.
There is insufficient range expansion.
The market lacks trend persistence.
By requiring volatility confirmation:
Weak reversals are filtered out.
Trend state becomes more stable.
Noise is reduced.
This makes the indicator particularly useful during:
Low-volatility consolidations,
Mean-reverting conditions,
Slow drifting ranges.
Band construction
The indicator uses:
hl2 as the central source,
ATR for dynamic width,
A configurable multiplier for sensitivity.
Formulas:
Upper Band = hl2 + ATR × multiplier
Lower Band = hl2 − ATR × multiplier
The trailing logic prevents the bands from moving backward unnecessarily:
Bullish lower band only rises.
Bearish upper band only falls.
This creates the staircase-style trailing structure common in Supertrend systems.
Trend state
Trend direction is binary:
1 = bullish
-1 = bearish
A raw bullish flip occurs when:
Close > trailing upper band
A raw bearish flip occurs when:
Close < trailing lower band
However:
The trend only updates if the volatility gate is open.
This is the defining behavior of the script.
Blocked flips
One of the most important features is the visualization of blocked signals .
When:
Price crosses a band,
But volatility is insufficient,
The script:
Plots an X-cross marker,
Keeps the existing trend state,
Refuses the flip.
This gives traders visibility into:
Potential but unconfirmed reversals,
Areas of weak participation,
Fake breakouts or low-energy transitions.
Visual behavior
Trend band
The active trailing band changes color based on trend direction:
Bullish → bullish color
Bearish → bearish color
Gate closed → gated color (dimmed)
Trend fill
The script fills the space between price and the active band:
Bullish fill during bullish regimes
Bearish fill during bearish regimes
This creates a cleaner directional overlay.
Outer glow
An additional glow layer expands slightly beyond the trend band:
Adds directional emphasis,
Improves trend readability,
Visually reinforces active regime.
When the gate closes:
The band and candles dim.
This visually communicates:
“The trend engine is currently suppressing flips.”
Candle coloring
Candles can optionally inherit the trend state:
Bullish regime → bullish candles
Bearish regime → bearish candles
Gate closed → dimmed neutral appearance
This allows the indicator to function as a full-chart regime overlay.
Signal logic
Bullish signal
Occurs when:
Trend flips from bearish to bullish,
AND the gate is open.
Bearish signal
Occurs when:
Trend flips from bullish to bearish,
AND the gate is open.
Blocked signal
Occurs when:
A raw flip condition appears,
BUT volatility ratio is below threshold.
This distinction is important:
A blocked signal is not ignored information.
It is a rejected transition.
How to interpret the gate
Gate open
Volatility is active.
Market expansion is sufficient.
Trend flips are allowed.
Gate closed
Market is compressed.
Conditions are likely choppy.
Trend reversals are suppressed.
This effectively turns the indicator into a:
Trend-following system during expansion,
Trend-holding system during compression.
Why ATR ratio works well
ATR ratio is a powerful regime detector because it measures:
Current volatility relative to normal volatility.
Not just:
“Is volatility high?”
But:
“Is volatility high relative to its recent baseline?”
This adaptive behavior allows the gate to work across:
Different assets,
Different timeframes,
Different volatility environments.
Input guide
ATR Multiplier
Controls band width:
Higher = wider bands, fewer flips
Lower = tighter bands, more sensitivity
ATR Length
Controls volatility calculation for the Supertrend itself.
Fast ATR
Short-term volatility measure.
Slow ATR
Long-term baseline volatility measure.
Gate Threshold
Controls how strict the gate is:
Lower threshold = more permissive
Higher threshold = more restrictive
Example:
0.6 → allows more flips
1.0 → requires current volatility to match baseline
1.2 → requires expansion regime
Strengths
Reduces Supertrend whipsaws in chop.
Adds regime awareness.
Uses adaptive volatility filtering.
Clean trend visualization.
Blocked-signal logic provides extra context.
Limitations
Can delay reversals during early expansion.
Very high thresholds may suppress legitimate transitions.
Still fundamentally a trend-following system.
Not designed for low-volatility mean reversion trading.
Best use case
Volatility Gated Supertrend works best as:
A directional regime filter,
A swing trend overlay,
A volatility-aware trend confirmation tool,
A way to suppress noise during consolidations.
It is particularly useful for traders who:
Like Supertrend logic,
But dislike how often it flips in sideways markets.
Summary
Volatility Gated Supertrend extends the classic Supertrend framework by introducing a volatility-aware gating engine that blocks trend reversals during compressed market conditions. By comparing fast ATR against slow ATR, the script determines whether enough volatility expansion exists to justify a directional transition. The result is a cleaner, more stable trend system that retains the strengths of Supertrend logic while dramatically reducing whipsaws during low-energy market regimes. Indicatore

Relative ATR Volatility IndicatorThis relative volatility regime indicator measures whether current volatility is high, low, or "normal" compared to its own recent historical range.
It calculates ATR, then compares the current ATR reading against a rolling percentile window. By default, it looks back over the last 100 bars and marks:
The upper volatility threshold, based on the 80th percentile of recent ATR readings (red)
The lower volatility threshold, based on the 20th percentile of recent ATR readings (green)
With the default settings of a 100-bar Rolling Window Length, Top Percentile of 80, and Bottom Percentile of 20:
If the white ATR line is above the red line, current volatility is in the highest 20% of recent ATR readings.
If the white ATR line is below the green line, current volatility is in the lowest 20% of recent ATR readings.
In other words, the script ranks current ATR against its own recent history and highlights volatility extremes. This makes it easier to objectively identify whether a market is currently in a high-volatility, low-volatility, or normal-volatility regime.
The indicator is directionally agnostic. A high ATR reading does not mean price is bullish or bearish; it simply means the market is moving more than usual. High ATR can occur during bullish expansion, bearish selloffs, large gaps, or choppy high-range conditions.
The main values are:
White line = current ATR value
Red line = upper ATR percentile threshold
Green line = lower ATR percentile threshold
Grey line = middle 50th percentile (turned off in Style Settings by default)
ATR Ratio Upper = current ATR divided by the upper threshold
ATR Ratio Lower = current ATR divided by the lower threshold
The ATR Ratio values can be used as an input by other scripts or strategies:
ATR Ratio Upper above 1 means ATR is above the upper volatility threshold
ATR Ratio Lower below 1 means ATR is below the lower volatility threshold
This script uses Pine Script's ta.percentile_nearest_rank() function to calculate rolling ATR percentile thresholds.
This is a lagging indicator, like most indicators, but it provides a useful way to classify volatility regimes objectively. Indicatore

Support and Resistance Institutional Zones [FEELS]Trade Volume-Weighted, Actionable Zones.
Many traditional support and resistance tools draw lines at every recent high and low. This script takes a different approach. It waits until price has actually used a level multiple times, weights each touch by how much volume and rejection was behind it, and only then draws a zone. The result is fewer levels on your chart, but the ones that do show up have a real mathematical reason to be there. Coupled with a strict, non-repainting signal engine, this tool is designed for serious Price Action traders.
—
🔥 Why This is Different
100% Non-Repainting Signals: Our signal engine operates strictly in real-time. Once a signal (Break, Bounce, Hold) is printed on a closed candle, it stays there forever, ensuring full historical accuracy for your backtesting.
Liquidity Sweep & "Born-Dead" Protection: Sometimes, algorithmic approaches can print false breakout signals if a zone forms retroactively during a massive price drop. We built a custom "Live Break" memory engine that verifies if the price was actually above/below the zone before the break. Furthermore, deep wicks (liquidity sweeps) do not trigger breaks—only solid candle closes do.
Volume & Rejection Weighting: Not all levels are created equal. Pivots that fired on heavy volume with long wicks weigh significantly more than quiet pokes. Zones with higher volume automatically become more vivid, while low-volume zones fade into the background.
—
⚙️ How It Works Under the Hood
The script collects confirmed pivots – both highs and lows – and groups them into clusters by price proximity. It uses a temporal spacing rule that prevents tight, standard consolidations from artificially inflating a single zone.
Older pivots gradually decay in influence, ensuring the active zones reflect what is actually relevant to current price action. The top zones by weighted strength are kept and ranked relative to each other.
—
📊 Reading the Chart
★ to ★★★ – The relative strength of the zone vs. other zones currently visible.
2× / 4× / 7× – The number of qualifying touches the zone has accumulated.
Vol: 72.19K – The cumulative volume of all pivots that built this zone.
Color intensity – Vividness scales with volume; highly transparent, faded zones are weak levels you can mostly ignore.
—
🎯 Strength Presets
Most users do not want to tune pivot parameters manually. The preset selector handles this in one click:
Local — Short pivots, tight zones. Use on intraday for scalping levels.
Swing (Default) — Balanced. Works incredibly well on most timeframes.
Major — Long pivots, wide zones. Surfaces the macro structure of the asset.
Custom — Full manual control over pivot length, tolerance, and spacing. Note: You can switch presets without losing the chart's other visual settings.
—
🚥 Active vs. Broken vs. Dropped Zones
There are three states a zone can be in:
Active: Currently respected by price. Drawn in your chosen support or resistance color.
Confirmed broken: Price closed through the zone with conviction. (Optional setting).
Dropped: Disappeared from the active list because newer pivots reorganized the cluster set. (Optional setting). Useful when reviewing why a past signal fired.
Both broken types are off by default for a clean chart. Toggle them on to study how zones evolved or to backtest signal context.
—
⚡ Optional Signals
The script can mark four types of price reactions. All are off by default – turn on what fits your style:
Successful test: A circle below or above the bar when price tests an active zone and closes back in the rejection direction.
Retest: A diamond when price returns to a previously broken zone within the retest window and reacts off it. The classic broken-resistance-becomes-support play.
Zone reaction marks: A small diamond when price touches a zone and holds without closing through. Bold Break R / Break S text labels appear only when a zone is genuinely broken on close.
RSI filter: An extra confirmation gate. Bullish signals only fire on RSI oversold; bearish only on overbought. Reduces signals to higher-conviction setups.
—
🔔 Alerts
Eight precise alert conditions are exposed for automated trading or notifications:
Resistance touched / Support touched
Resistance broken / Support broken
Successful support test / Successful resistance test
Bullish retest / Bearish retest
New pivot confirmed
Set them through the standard TradingView alert dialog – the conditions appear directly in the dropdown.
—
💡 Pro Tips
No Volume? No Problem: On low-liquidity assets or indices without volume data, zones still build correctly using the wick and structure components. Volume coloring will be uniform, but everything else works flawlessly.
Clean the Clutter: If the chart looks crowded, lower "Active zones per side" to 3-4, or increase "Hide zones farther than (%)" to filter out distant zones.
Fast Timeframes: On 1m or 5m charts, switch the preset to Local and lower the Cooldown bars if you trade off rapid bounce signals.
Relative Strength: Strength is a relative measure within the visible zones, not an absolute score. ★★★ on a quiet, ranging chart is not the same as ★★★ on a high-volume, trending one.
This script is open-source. If you build something interesting on top of it, please reference where the original idea came from.
Disclaimer: Not financial advice. Always backtest before risking capital. Indicatore