SQZ SCAN & EMA Ride Scanner - AshishShort Description
A dual-mode EMA9/21/50 trend-ride scanner with volume classification and a relative-strength "Grinder Mode" for stocks that trend without ever coiling tight enough to trigger a squeeze. Use alongside its companion, SQZ_SCAN, for momentum timing.
What it does
EMA Ride Scanner V2.a finds stocks in a clean, established uptrend and flags healthy pullback zones to buy — instead of chasing breakouts after the move has happened. Built on ideas from Qullamaggie's Episodic Pivot framework, Stockbee's price-neglect filter, and VCPSwing's 10/20-MA ride philosophy. It checks: EMA9>21>50 stack alignment, minimum ride duration, distance from 52-week low, and volatility contraction. Volume bars are color-coded as EP surges, distribution, or healthy dips.
Two modes (single toggle)
Standard Mode (toggle OFF) — for stocks that coil and release. Flags a 0-5% pullback to EMA9, ideally on light volume. Pair with SQZ_SCAN for the breakout-timing signal.
Grinder Mode (toggle ON) — for stocks that never coil. Some strong trends have such low, steady volatility that they never compress enough to trigger a squeeze — by the time SQZ_SCAN fires, they've already run too far from EMA9 to count as a dip. Grinder Mode drops the squeeze requirement and instead checks: low ATR, long ride above EMA21, and meaningful outperformance vs a benchmark index (momentum begets momentum). If price is also near EMA9/21, it flags a Grinder Setup.
Note: cloud-bounce count is shown for visual reference only, not used as a filter — low-ATR stocks often show very few bounces simply because they ride EMA9 continuously rather than dipping and recovering.
Companion: SQZ_SCAN
SQZ_SCAN (LazyBear Squeeze Momentum, normalized to % of price for cross-stock comparison) shows when volatility compression releases into a confirmed move — WATCH (squeeze building, qualifying bar count reached), EARLY FIRE (momentum just turned positive inside the squeeze), or BUY (squeeze fired + momentum green & rising + volume surge confirmed).
Workflow:
Screen with EMA Ride Scanner (Standard Mode) for clean pullback candidates.
Check SQZ_SCAN on each — prioritize WATCH/EARLY FIRE/BUY.
Separately, screen Grinder Mode for low-volatility names — don't require SQZ confirmation here, it structurally won't fire for this archetype.
Sanity-check on hourly before entry — only to rule out an active breakdown, not as a hard gate. Both indicators are daily-timeframe tools; hourly readings are noisy and shouldn't override a valid daily setup.
What this isn't
A screening tool, not a full trading system — no buy/sell signals, no risk management built in. Combine with your own entry timing, sizing, and stops. Indicatore

EMA Ride Scanner V2.a (Toggle) - AshishShort Description
A dual-mode EMA9/21/50 trend-ride scanner with volume classification and a relative-strength "Grinder Mode" for stocks that trend without ever coiling tight enough to trigger a squeeze. Use alongside its companion, SQZ_SCAN, for momentum timing.
What it does
EMA Ride Scanner V2.a finds stocks in a clean, established uptrend and flags healthy pullback zones to buy — instead of chasing breakouts after the move has happened. Built on ideas from Qullamaggie's Episodic Pivot framework, Stockbee's price-neglect filter, and VCPSwing's 10/20-MA ride philosophy.
It checks: EMA9>21>50 stack alignment, minimum ride duration, distance from 52-week low, and volatility contraction. Volume bars are color-coded as EP surges, distribution, or healthy dips.
Two modes (single toggle)
Standard Mode (toggle OFF) — for stocks that coil and release. Flags a 0-5% pullback to EMA9, ideally on light volume. Pair with SQZ_SCAN for the breakout-timing signal.
Grinder Mode (toggle ON) — for stocks that never coil. Some strong trends have such low, steady volatility that they never compress enough to trigger a squeeze — by the time SQZ_SCAN fires, they've already run too far from EMA9 to count as a dip. Grinder Mode drops the squeeze requirement and instead checks: low ATR, long ride above EMA21, and meaningful outperformance vs a benchmark index (momentum begets momentum). If price is also near EMA9/21, it flags a Grinder Setup.
Note: cloud-bounce count is shown for visual reference only, not used as a filter — low-ATR stocks often show very few bounces simply because they ride EMA9 continuously rather than dipping and recovering.
Companion: SQZ_SCAN
SQZ_SCAN shows when volatility compression releases into a confirmed move — WATCH (squeeze building), EARLY FIRE (just released), or BUY (released + volume confirmed). NOTE: As with most indicators, this is a lagging indicator on a daily timeframe, and accuracy reduces significantly on lower timeframes.
Workflow:
Screen with EMA Ride Scanner (Standard Mode) for clean pullback candidates.
Check SQZ_SCAN on each — prioritize WATCH/EARLY FIRE/BUY.
Separately, screen Grinder Mode for low-volatility names — don't require SQZ confirmation here, it structurally won't fire for this archetype.
Sanity-check on hourly before entry — only to rule out an active breakdown, not as a hard gate. Both indicators are daily-timeframe tools; hourly readings are noisy and shouldn't override a valid daily setup.
What this isn't
A screening tool, not a full trading system — no buy/sell signals, no risk management built in. Combine with your own entry timing, sizing, and stops. Indicatore

5 Advanced MAs MTF🔵 OVERVIEW
5 Advanced MAs MTF is a professional moving averages indicator designed for traders who need to see multiple trend layers on a single chart simultaneously, each one with its own independent configuration and — above all — its own timeframe.
Unlike typical "ribbon" or "multi-MA" indicators on the market, which display several averages all computed on the active chart's timeframe, this indicator allows each of the 5 averages to have its own timeframe. You can have your EMA 8 on the 15-minute chart, your EMA 20 on the 1-hour, your EMA 50 on the 4-hour, and your SMA 200 on the daily, all plotted on the same 15-minute chart. That turns the indicator into a complete multi-timeframe control panel without needing to open four separate charts or saturate your installed indicators list.
🔶 KEY FEATURES
• 5 fully independent moving averages — each one configured separately and enabled or disabled individually.
• True multi-timeframe per MA — the core differentiator. Each MA can read its value from a higher, lower, or equal timeframe relative to the active chart. Leave it empty to use the chart's current timeframe.
• 9 moving average types — SMA, EMA, WMA, RMA, HMA, VWMA, TEMA, KAMA, and JMA. The last three (TEMA, KAMA, JMA) are implemented with their original formulas, no shortcuts. JMA uses Mark Jurik's standard defaults (Phase = 50, Power = 2).
• Configurable source per MA — Close, Open, High, Low, hl2, hlc3, ohlc4.
• Full visual styling per MA — color, width (1 to 10), and line style (solid, dashed, or dotted).
• Smart labels — each MA can show its label directly on the line, with configurable content (type, length, timeframe, or any combination of the three). Adjustable horizontal bar offset and text size.
• Interactive summary table — placed at any of the 9 chart anchors, displaying color column, type, length, timeframe, and price distance from each MA (in percentage and absolute value). Toggle to include or exclude hidden MAs.
• 22-alert system — 10 for Price↔MA crosses (bullish and bearish for each MA), 10 for MA↔MA crosses across 5 configurable slots (you pick which MA pairs to monitor), and 2 wildcard "any cross detected" alerts. All compatible with webhooks and automation.
• Works on any market and any timeframe — equities, futures, crypto, forex, commodities. From tick charts to monthly charts.
🔹 USE CASES BY TRADER STYLE
▪️ Day trader / scalper
Configure the first 3 MAs as short EMAs (8, 20, 50) on the chart's timeframe (5m or 15m) and leave MAs 4 and 5 as SMA 200 and VWMA 100 but reading them from a higher timeframe (1H, 4H, or daily). Result: you see your fast entry signals and the higher-timeframe bias at the same time without switching charts.
▪️ Swing trader
Recommended setup: EMA 20 and EMA 50 on the active chart (1H or 4H) + SMA 200 read from daily + VWMA 100 read from weekly. This lets you watch pullbacks against the EMA 20 on your operative timeframe with immediate confirmation that the higher-timeframe bias is aligned, plus the weekly VWMA as a volume-weighted "fair price" reference.
▪️ Position trader / long-term
Enable all 5 MAs on daily or weekly to build a complete structural map of the asset. The default configuration (EMA 8, EMA 20, EMA 50, SMA 200, and VWMA 100, all on daily) covers everything from fast momentum to the institutional level, combining pure-price references (SMA 200) with volume-weighted references (VWMA 100). The summary table shows the exact distance of price from each one.
▪️ Systematic crossover trader
The MA↔MA alert slots let you configure up to 5 specific crossovers simultaneously. Classic Golden Cross / Death Cross setup: Slot 1 with MA 3 (EMA 50) crossing MA 4 (SMA 200) on daily, with an automatic alert sent to your bot's webhook or notification system.
▪️ Multi-timeframe confluence trader
The most differentiating use case. Assign each MA to a different timeframe: MA 1 on 5m, MA 2 on 15m, MA 3 on 1H, MA 4 on 4H, MA 5 on daily or weekly. The summary table shows you in real time the distance of current price from the key level of each of those timeframes. When several MAs from different timeframes converge on the same price zone, that zone becomes a high-density structural level — one of the most-used concepts among institutional traders.
⚙️ INPUTS & CUSTOMIZATION
The entire indicator is 100% configurable from the Inputs panel. Each MA has its own expandable group with 14 controls. The summary table is also fully customizable (position, text size, background/border/text colors). The JMA global parameters (Phase and Power) live in their own section so advanced users can adjust them without cluttering the individual groups.
By default, all 5 MAs are enabled with a configuration tailored for daily and swing use: EMA 8 (blue, 1D), EMA 20 (red, 1D), EMA 50 (yellow, 1D), SMA 200 (green dashed, 1D), and VWMA 100 (pink dotted, 1D). The user can modify any of the parameters or reassign the MAs to other timeframes at any moment.
🔔 ALERTS
The indicator ships with 22 precompiled alerts ready to use:
• 5 alerts "Price crosses above MA N"
• 5 alerts "Price crosses below MA N"
• 10 alerts across 5 configurable slots for MA↔MA crossovers (bullish and bearish per slot)
• 2 wildcard alerts "any cross detected"
All messages include the {{ticker}} and {{close}} placeholders so they are directly parseable by webhooks, bots, and automation systems.
❓ FAQ
Does the indicator repaint?
No. The moving averages are computed on confirmed historical data. Cross alerts fire on the bar of the cross and values are not modified retroactively. To avoid signals that appear and disappear intra-bar, set the alerts to "Once per bar close".
Does it work on any timeframe?
Yes. From tick charts to monthly. In addition, each MA can have its own higher, lower, or equal timeframe relative to the active chart. The default timeframe is the current chart's timeframe.
Why 9 MA types?
Because each type behaves differently. SMA is the pure average; EMA weights recent bars more; HMA virtually eliminates lag; KAMA adapts to volatility; JMA is the smoothest while staying responsive; VWMA weights by volume. Having all of them available lets you use the right tool for each analysis without installing several separate indicators.
What are the 5 MA↔MA alert slots for?
They let you configure specific crossovers between any pair of MAs without having to create all possible combinations. In each slot you pick the fast MA and slow MA from dropdowns and receive alerts for the bullish and bearish crossovers of that pair. Example: Slot 1 = MA 3 crosses MA 4 (classic Golden Cross / Death Cross when MA 3 = EMA 50 and MA 4 = SMA 200).
What is the best MA combination?
There is no single "best" — it depends on the trading style and the asset. The Use Cases section above includes recommended configurations for the 5 most common profiles.
Is it compatible with webhooks and automation?
Yes. The 22 alerts use {{ticker}} and {{close}} placeholders in their messages, making them directly compatible with TradingView Webhooks, copy-trading platforms, Telegram/Discord bots, and any system that parses JSON.
Is it free to use?
Yes. Open-source indicator under the Mozilla Public License 2.0. You can review the full code, use it freely on TradingView, and create derivative copies while respecting the license terms.
⚠️ DISCLAIMER
This indicator is a technical analysis tool provided solely for educational and informational purposes. It does not constitute financial advice, an investment recommendation, or an invitation to trade any instrument. Moving averages are reactive (not predictive) indicators: they are based on historical data and, by their nature, can produce delayed signals in markets with sharp trend changes. In ranging or low-volatility market contexts, crossovers can be frequent and not particularly informative. Every trading decision is the sole responsibility of the trader. Past performance does not guarantee future results.
© 2026 Lic. Farias Foresi, Leandro M. — License: Mozilla Public License 2.0
Indicatore

Day Trade Trend Watchlist# 10-Stock Premarket Breakout + EMA/VWAP Day Trade Trend Watchlist
Before you start:
Extended Hours must be turned on.
Mark your Pre Market Levels or find a Indicator does that for you.
## Overview
This indicator turns any chart into a live screening dashboard for up to 10 stocks at once. It tracks each ticker's premarket high and low, flags the moment price breaks out of that range, and reads trend from EMA alignment — all from one customizable table, without needing to open 10 separate charts. A VWAP and 8/21/200 EMA are also plotted directly on your chart for the symbol you're currently viewing.
## What it does
- **Premarket High/Low (PMH/PML) tracking** — automatically calculates each ticker's premarket range (default 4:00–9:30 AM ET, adjustable session and timezone) and resets it fresh every trading day. Pulls real extended-hours data regardless of your own chart's display settings.
- **Breakout detection** — once premarket ends, the script flags the moment price crosses above the premarket high or below the premarket low, both in the table and with an on-chart arrow label naming the ticker.
- **Trend column (8/21/200 EMA stack)** — each ticker's trend is read from EMA alignment: price stacked above all three EMAs shows UP, the reverse shows DOWN, anything in between shows MIXED.
- **Daily inside/outside bar column** — classifies whether each ticker's current daily candle is still contained inside yesterday's range, or has broken outside it (up, down, or both).
- **On-chart EMA + VWAP** — the 8, 21, and 200 EMA plus a session VWAP are plotted directly on whatever symbol/timeframe your chart is showing, for standard visual trend and fair-value context.
- **Customizable dashboard** — choose exactly which columns appear (Last Price, PM High/Low, Breakout Status, Trend, Daily Bar), set text size, table position, and recolor every part of the table to match your own chart theme. Default view is a clean, minimal Ticker + Last price layout.
- **Built-in alerts** — get notified the moment any of your 10 tickers breaks its premarket high or low, with an option to only fire once per level per day.
## How to use it
1. Add the indicator to any chart — the chart's own symbol doesn't need to match your watchlist.
2. Open Settings → "Watchlist" group → enter up to 10 tickers. Leave any slot blank to skip it.
3. Adjust the premarket session window and timezone if you trade a market other than US equities.
4. Use the "Columns to Show" group to pick exactly what information you want visible.
5. Right-click the chart → Add Alert → select this indicator to receive breakout notifications.
## Notes
- Premarket tracking, EMAs, and trend classification all run on the 10-minute timeframe internally for consistency across all 10 tickers, regardless of your chart's own timeframe.
- This is a discretionary screening tool, not a standalone signal generator — use it alongside your own market structure, volume, and risk management approach.
- If a ticker shows "n/a," double check the symbol is entered correctly or that premarket data is available for that instrument.
Indicatore

Boshmann's Volatility HistBoshmann's Volatility Hist
The theory behind tracking normalized volatility is that market movement is highly cyclical, constantly alternating between periods of tight contraction and explosive expansion. Using raw volatility measures (like a flat Average True Range value) is flawed because the meaning of those points changes drastically as an asset's price scales up or down over time. By applying a statistical Z-Score to the ATR, we normalize the volatility relative to the asset's own historical baseline, allowing traders to objectively identify when price action is anomalously quiet (predicting a breakout) or unsustainably aggressive (predicting exhaustion or mean-reversion).
How the Script Works: The script calculates a standard 14-period Average True Range (ATR) to measure current price movement. It then runs a 250-period lookback to compute the rolling mean and standard deviation of that ATR, ultimately calculating a real-time Z-Score. This Z-Score is plotted as an oscillating histogram below the chart. The script uses fixed thresholds to color the histogram bars: Green for "Quiet" (Z-score < -0.5), Yellow for "Normal" (Z-score between -0.5 and 0.5), and Red for "Volatile" (Z-score > 0.5). It also plots dotted threshold lines so you can instantly see when volatility crosses into extreme territory.
Why You Should Use It: This script is the final pillar of the Boshmann's suite, engineered to be used in strict combination with the Regime Counters and the Market Direction Hist .
While the Regime Counter gives you the structural trend and the Direction Hist gives you the momentum conviction, this Volatility Hist reveals the energy state of the market. You should use this indicator because knowing the market's speed dictates your risk management and strategy timing. For example, if you spot a long string of "Quiet" (green) volatility bars while the Regime Counter just flipped to Bullish, you have found an optimal, low-risk entry before an explosive breakout. Conversely, if you are riding a trend and this histogram spikes deep into the "Volatile" (red) zone, it serves as a mathematical warning that the market is overextended, signaling that you should tighten stops or take profits before the inevitable pullback. Indicatore

Boshmann's Market Direction HistBoshmann's Market Direction Hist
The theory behind a directional histogram is to visually quantify not just the direction of a trend, but its underlying momentum and the distance between moving averages. While identifying a trend regime categorizes the market into a fixed state (bull, bear, or sideways), measuring the spread between a fast and slow moving average reveals whether that trend is accelerating, decelerating, or reaching exhaustion. By projecting this spread as an oscillator around a zero line, traders can easily spot momentum divergences and gauge the true strength of a directional move.
How the Script Works: The script calculates the raw distance between a short-term moving average (20-period SMA) and a long-term moving average (100-period SMA). To ensure the indicator works seamlessly across any asset class or timeframe—whether a stock is trading at $5 or $50,000—it normalizes this distance as a percentage of the current price. It then plots this normalized momentum as a histogram. Finally, the histogram bars are painted using the exact same logic as the Regime Counters script: Green for Strong Bull, Red for Strong Bear, and Yellow for Sideways.
Why You Should Use It: This script is explicitly designed to be used in combination with the Regime Counters and Volatility Histogram scripts to form a complete, three-dimensional view of the market.
A user should use this histogram because while the Regime Counter tells you what state the market is in, the Direction Histogram tells you how strong that state is. For example, if the Regime Counter classifies the market as "Bullish" but you see the green bars on this histogram steadily shrinking toward the zero line, it is a leading indicator that upward momentum is dying long before the official regime flips. Together, the three scripts allow you to trade systematically: the Regime Counter dictates your directional bias, the Volatility script warns you of price expansion, and the Direction Histogram measures the real-time conviction pushing the trend. Indicatore

Boshmann's Regime CountersSummary of Boshmann's Regime Counters
At its core, this indicator is designed to remove human subjectivity from chart reading by translating market behavior into purely objective, mathematically defined states. Rather than relying on discretionary trendlines or "gut feelings" about market speed, it uses robust statistical baselines to continuously classify the market into discrete Trend and Volatility regimes.
For TradingView users, this provides an immediate, systematic context of the market environment, which is crucial because trading strategies (like mean-reversion vs. trend-following) only perform well when aligned with the correct market state.
1. Trend Regime Classification (Directional Bias)
The indicator evaluates moving average alignments to determine the structural trend. It requires both price position and momentum to agree before declaring a strong trend:
Bull: The closing price is strictly above a long-term baseline (200 SMA) AND short-term momentum (20 SMA) is leading the medium-term momentum (100 SMA).
Bear: The closing price is below the 200 SMA AND the 20 SMA has crossed below the 100 SMA.
Sideways: Any state where the price and moving averages are in conflict or tangled.
Visuals: The chart bars are painted dynamically (Green for Bull, Red for Bear, Golden for Sideways) so the current regime is instantly visible.
2. Volatility Regime Classification (Market Speed)
Instead of using fixed point values to measure volatility (which break down across different timeframes and assets), the indicator uses an Adaptive Z-Score of the Average True Range (ATR). By looking back over a large sample size (250 periods), it calculates a rolling mean and standard deviation of the ATR. This normalizes volatility into a universal metric:
Quiet (Z-Score < -0.5): The market is contracting and experiencing significantly below-average movement.
Normal (Z-Score -0.5 to 0.5): The market is operating within its standard, expected historical variance.
Volatile (Z-Score > 0.5): The market is expanding, experiencing statistically significant, out-sized movement.
3. The Statistics Dashboard
The script anchors a real-time statistical dashboard to the chart. It tallies the exact number of bars—and calculates the overall historical percentage—spent in each specific trend and volatility regime.
What this does for TradingView users:
Strategy Alignment: By quantifying exactly how much time an asset spends trending versus chopping sideways, traders can objectively decide whether to deploy a trend-following system or a range-bound strategy on that specific asset.
Contextual Awareness: The adaptive Z-score prevents users from being caught off guard by volatility expansion, giving them a mathematical warning when the market shifts from "Quiet" accumulation into "Volatile" distribution.
Backtesting Validation: The on-chart percentages give quantitative traders immediate insight into the asset's structural personality over the loaded history (e.g., realizing an asset is only in a "Strong Bull" state 25% of the time helps set realistic win-rate expectations). Indicatore

Indicatore

TELAY Algo AlphaTELAY Algo Alpha
A long-only trade map built on a directional trend model: one entry, a fixed stop, and three scaling targets — all confirmed on bar close.
Based on AlgoAlpha's open-source "Trend Targets". When price confirms an uptrend, the script marks a single long setup: entry at the flip, a fixed stop at low − ATR×5 (it does not trail, so normal pullbacks don't shake the trade out), and three targets registered by touch. Full carry; the position closes at the final target, or earlier on a close below the stop or a bearish flip.
A persistent panel keeps the setup visible through the whole uptrend — entry, stop, live return, the three targets with hit status, trend, and trade state — with a marker at each target. Signals confirm on bar close (no repaint); one position at a time.
Arabic UI — key: الدخول = Entry · الوقف = Stop · السعر/العائد = Price/Return · هدف 1/2/3 = Target 1/2/3 · الاتجاه = Trend (صاعد Up / هابط Down) · صفقة مفتوحة = Open · بلغ الهدف الأخير = Final target reached · ضرب الوقف = Stopped · مراقبة = Monitoring.
Credits: trend logic adapted from the open-source "Trend Targets" by AlgoAlpha. Management, stop, panel, and alerts are original. Published open-source.
For education and research only — not financial advice, and no result is guaranteed. Indicatore

Indicatore

Indicatore

Indicatore

Indicatore

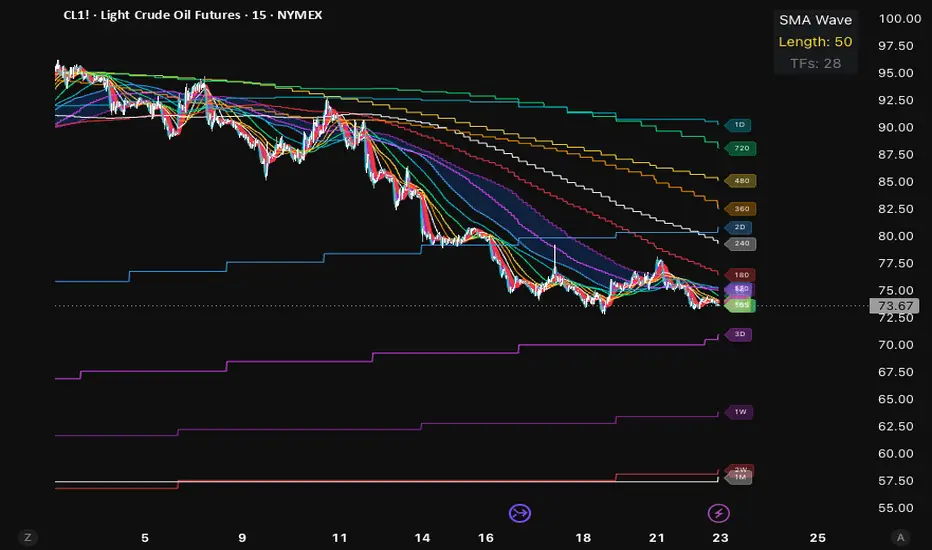
Multi-Timeframe SMA WaveThis is a powerful multi-timeframe Simple Moving Average (SMA) visualizer that plots up to 28 different timeframes of the same SMA length simultaneously on your current chart.Instead of looking at one SMA on one timeframe, you see a "wave" or "fan" of SMAs from very fast (1-second) all the way to very slow (1-month). This creates a visual hierarchy of trend strength across different scales.
Key Features: 28 Timeframes covered: 1S, 5S, 10S, 15S, 30S, 1m, 2m, 3m, 5m, 10m, 15m, 20m, 30m, 45m, 60m, 90m, 120m, 180m, 240m, 360m, 480m, 720m, 1D, 2D, 3D, 1W, 2W, 1M.
Color-coded lines with increasing thickness on important timeframes (e.g., 5m is thicker).
Dynamic labels on the right side showing which line belongs to which timeframe (updates on the last bar).
Fill zones between certain groups (1-3m and 60-120m) for visual emphasis.
Info table in top-right showing SMA length and number of timeframes.
Uses request.security() with proper gaps/lookahead settings for clean data.
Trading Interpretation TipsBullish Setup: Price above most SMAs + wave sloping upward + fast TFs above slow TFs.
Bearish Setup: Price below most SMAs + wave sloping downward + fast TFs below slow TFs.
Compression / Breakout Setup: When the "wave" squeezes tightly together → often precedes strong moves.
Divergence: If price makes new highs but the higher-timeframe SMAs are flattening/turning down → warning sign.
Customization IdeasChange SMA len (default 5) — smaller = more reactive, larger = smoother.
Enable/disable fill zones.
Add more plots if you need even more timeframes.
Modify colors and line thickness for better visibility.
Summary:
This indicator is excellent for traders who use multi-timeframe analysis but hate switching between charts. It condenses a huge amount of information into one clean visual "wave," making it much easier to see alignment (or lack thereof) across timeframes. Very useful for day traders, swing traders, and discretionary price action traders who want contextual awareness.
Indicatore

Indicatore

Indicatore
Indicatore

Indicatore

Multi-EMA Future Trajectory Projector [20/50/100/200]Multi-EMA Future Trajectory Projector DescriptionThe Multi-EMA Future Trajectory Projector solves a fundamental limitation of traditional moving averages: lag. Because Exponential Moving Averages (EMAs) are backward-looking mathematical averages, traders are often left guessing how long or how far a price must move before a trend crossover occurs.
This script eliminates the guesswork by calculating the exact mathematical decay of the 20, 50, 100, and 200 EMAs into the unprinted, blank future space of your chart. Rather than predicting where the market will go, this tool acts as a "What-If" simulator , plotting the precise trajectory curves the EMAs will take based on your own expected price targets.
Unlike standard indicators, this script gives you complete visual control over the lookahead vectors directly inside the Inputs tab, allowing you to custom-style your future projection lines.
How it Works (The Math)
An EMA weighs the most recent price closing data heavier using a fixed smoothing multiplier: Multiplier = 2 / (Length + 1)
Because future price bars do not exist yet, this indicator runs a recursive loop algorithm starting from the real-time live price bar. It uses a chain-link calculation where every forward step is derived from the previous step’s projected EMA value using your selected price source as the fixed focal target.
Core Features & Settings
Custom Lookahead Depth: Adjust the Number of Extensions to project anywhere from 1 to 500 bars into the future blank space. Simulate Multiple Scenarios: Change the Price Source input to simulate different environments. For example, setting it to Close calculates the path if the price completely flatlines.
Complete Input Styling: TradingView natively restricts code-generated future lines from appearing in the "Style" tab. This script bypasses that limitation by moving all color, thickness, and line style (Solid, Dashed, Dotted) settings directly into the Inputs panel for individual EMAs.
How to Use This in Your Trading
1. Anticipating Trend Crossovers (EMA Crosses)Instead of waiting hours or days for a 20/50 EMA cross to print historically, look at the projected slopes. If the 20 EMA trajectory curve is bending aggressively toward the 50 EMA, you can visually measure exactly how many bars are required at the current price level for a crossover to trigger.
2. Identifying Extensions & Mean Reversion Shorter moving averages (like the 20 EMA) react rapidly to spot prices and curve sharply, while longer ones (like the 200 EMA) plot flat trajectories. Use the gap between the short-term and long-term future lines to judge if an asset is overextended and likely to experience a mean-reversion pullback.
3. Support & Resistance Confluence Projected curves map out where key historical moving averages will form dynamic support or resistance on upcoming bars. Use the future line coordinates to plan precise, front-run take-profit limits or stop-loss placements.
Indicatore

Indicatore

Indicatore

MA Length to Time Table"MA Length to Time Table" is a simple but very practical Pine Script indicator that displays a clean table converting Moving Average lengths into approximate real-world time (seconds, minutes, hours, or days) based on the current chart timeframe.It starts from a Base Length (default 32) and doubles it each row:32 → 64 → 128 → 256 → 512 → 1024 → 2048 → 4096
For each length, it shows: The MA period (number of bars)
The equivalent time duration on the current timeframe
Main Use CasesUse Case
Why It's Useful
Choosing the right MA length
Quickly see that a 200 MA on a 5m chart ≈ 16.7 hours, or on a 1H chart ≈ 8.3 days
Multi-timeframe awareness
Understand how "long-term" an MA really is on your current chart
Strategy building & backtesting
Match MA periods to meaningful time horizons (e.g. 1-week, 1-month, quarterly)
Swing & Position Trading
Find MA lengths that represent 1 week, 1 month, 3 months, etc.
Educational / Learning
Helps new traders grasp the real temporal meaning behind MA periods
Quick reference
No need to manually calculate length × timeframe every time
Practical ExamplesOn 5-minute chart: 256 MA ≈ 21.3 hours (almost one full trading day)
On 1-hour chart: 168 MA ≈ 7 days (one week)
On Daily chart: 90 MA ≈ 3 months
This indicator is especially loved by traders who use multiple moving averages or want to align their indicators with actual calendar time rather than just bar counts.Very lightweight and useful as a supporting tool on any chart.
Indicatore

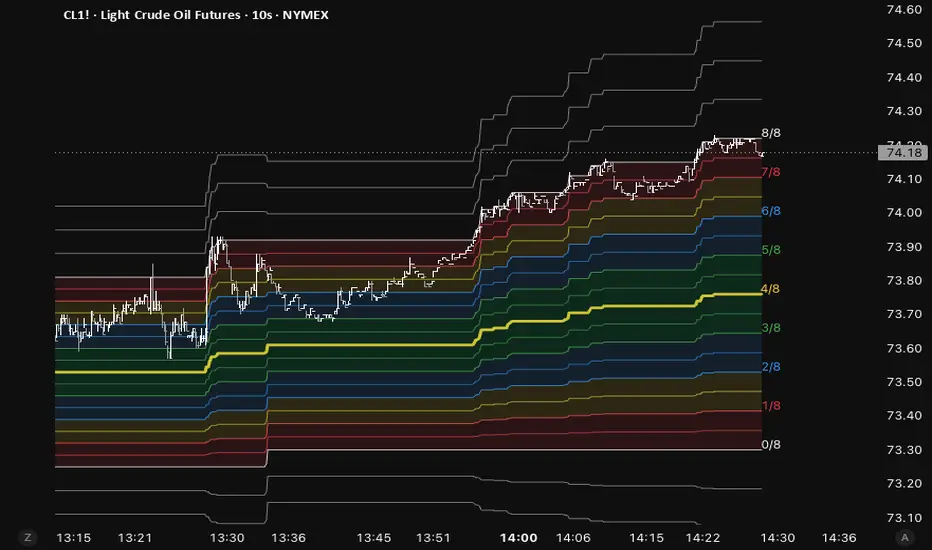
Auto8 3.0Auto8 3.0 is an automatic Fibonacci 1/8th Levels indicator (also known as Murrey Math Lines style). It dynamically calculates the highest high and lowest low over a user-defined lookback period (Fib Length, default 4096 bars), then divides that range into 8 equal parts. The script plots:
The 9 main levels (8/8 down to 0/8)
Several 1/16th intermediate lines
Upper and lower extensions (beyond the range)
Beautiful colored fills between each 1/8th zone
Clean right-side labels for every major level
It is fully automatic — it constantly updates as new highs/lows are made within the lookback window.
Main Use Cases:
High-Probability Support & Resistance
The 1/8th levels (especially 0/8, 2/8, 4/8, 6/8, 8/8) act as major psychological and institutional zones where price frequently reacts.
Market Structure & Bias Determination Price trading above 4/8 → Bullish structure
Price trading below 4/8 → Bearish structure
4/8 level often acts as a strong magnet (mean reversion point).
Zone Trading
Traders use the colored zones for:Buying in lower zones (1/8 – 3/8)
Selling in upper zones (5/8 – 7/8)
Breakout confirmation when price decisively breaks and holds a level
Very popular among Forex, Index, and Commodity traders on Daily, Weekly, and Monthly timeframes.
Key Strengths: Clean, visually appealing zone fills
Automatic — no manual drawing needed
Works on all instruments and timeframes
Good for identifying overextended moves (price at 8/8 or 0/8)
Typical Trading Style:
Swing trading, positional trading, and ICT/SMC traders who love Fair Value Gaps + Order Blocks + Fibonacci/Murrey levels.
Indicatore