Indicatore
Supporto e resistenza

Liquidity Areas (MTF)Liquidity Areas (MTF)
Maps the price levels on up to three higher timeframes where stop orders are most likely clustered, plotted as filled zones. Levels above swing highs are buy-side liquidity (BSL) — short sellers' stops sit there. Levels below swing lows are sell-side liquidity (SSL) — long holders' stops sit there. When two adjacent swings line up within a tight tolerance, they're labeled EQH (equal highs) or EQL (equal lows): a denser stop cluster and historically a stronger magnet.
When
Indicatore

Automatic Fibonacci Retracement Levels (MTF)Automatic Fibonacci Retracement Levels (MTF)
Auto-anchored Fibonacci retracement levels drawn between the most recent confirmed swing high and swing low, replicated across up to three higher timeframes. As new pivots form on each timeframe, the levels reanchor automatically — no manual redrawing every time the swing range changes.
The point is to see Fibonacci structure across multiple horizons on a single chart, without juggling drawing tools.
How it works
For each of the three configured t
Indicatore

Adaptive S/R Reversal - RSI Divergence + DCA + BE Stop (5m)Adaptive S/R Reversal - RSI Divergence + DCA + BE Stop (5m)
DESIGNED FOR: BTCUSDT perpetual · 5-minute timeframe · ONLY.
Other symbols and timeframes have not been validated. The script enforces 5m and warns on any other TF.
A 5-minute mean-reversion strategy for BTCUSDT perpetual futures. Fades touches of yesterday's high/low when momentum confirms via fresh RSI divergence. Averages down once if price moves further against, exits at yesterday's midpoint pre-DCA or a fixed % from first entry p
Strategia

MTF Support / Resistance ChannelsMTF Support / Resistance Channels
Filled support and resistance zones built from confirmed pivots across up to three user-selected timeframes, plotted on the chart. Channel thickness is ATR-derived, so zones scale automatically with volatility — no fiddling with absolute pip/dollar widths when you switch instruments. A proximity filter hides distant zones to keep things readable.
The point is to put hourly, daily, and weekly structure on a single chart without stacking three windows or losing
Indicatore

Round Number Rejection Planner [AGPro Series]# Round Number Rejection Planner
🧠 Core Idea
Is the round number acting as rejection, magnet, or failed reference?
📌 Overview / What it does
Round Number Rejection Planner is a psychological price level decision-support script built to evaluate how price reacts around nearby round numbers.
The script maps adaptive round-number bands, detects wick-based rejection behavior, separates rejection from magnet conditions, scores the context from 0 to 100, and summarizes the current state inside
Indicatore

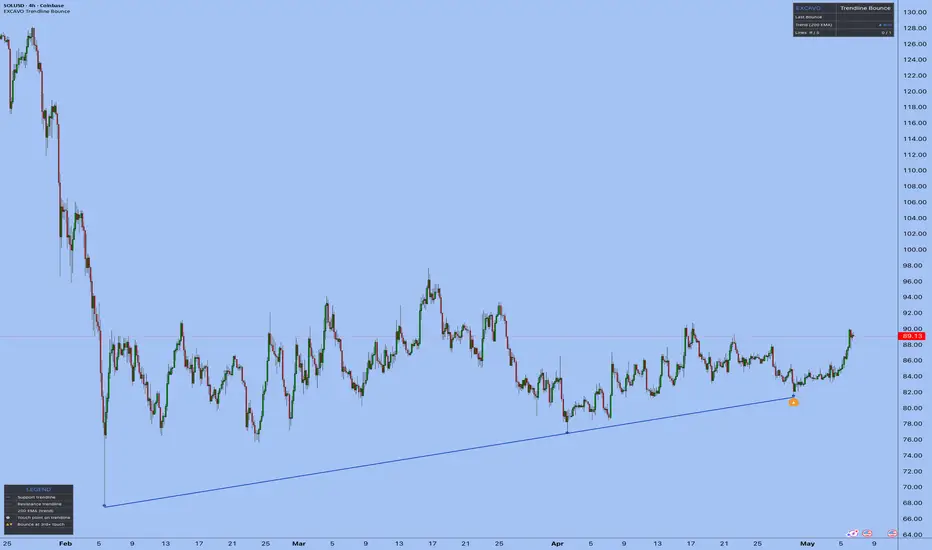
Trendline Bounce [EXCAVO]Automatic Trendline Detection with Multi-Stage Bounce Detection and Quality Filters
The Trendline Bounce automatically identifies support and resistance trendlines
validated by three or more confirmed pivot touches. When price returns to an established
line, the indicator places a directional bounce arrow and triggers the alert. A dual-
lookback architecture fires earlier than traditional pivot-confirmation methods, while
span, regime, and trend filters eliminate structurally weak or contextu
Indicatore
Svopex S&D ScanSvopex S&D Scan
Multi-symbol Supply & Demand zone scanner that displays the status of up to 40 instruments in a single table. Built on the same detection logic as Svopex Supply
Indicatore

Pymander's EZ Key LevelsHey everyone! Pymander here. I’m excited to share EZ Key Levels, a tool I built to solve one of the biggest problems we face as intraday traders: chart clutter.
We all know that "levels are king," but when your screen is a spiderweb of Daily, Weekly, and Session lines, it’s easy to get lost in the noise. This indicator is designed to give you total clarity so you can focus on execution.
What is EZ Key Levels?
At its core, this is a hybrid indicator. It combines High Timeframe (HTF) logic with
Indicatore

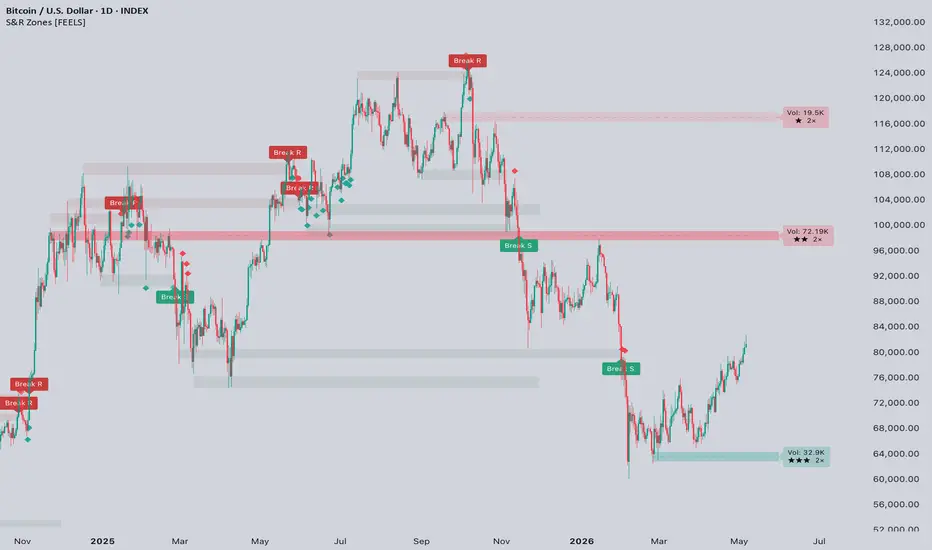
Support and Resistance Institutional Zones [FEELS]Trade Volume-Weighted, Actionable Zones.
Many traditional support and resistance tools draw lines at every recent high and low. This script takes a different approach. It waits until price has actually used a level multiple times, weights each touch by how much volume and rejection was behind it, and only then draws a zone. The result is fewer levels on your chart, but the ones that do show up have a real mathematical reason to be there. Coupled with a strict, non-repainting signal engine, thi
Indicatore
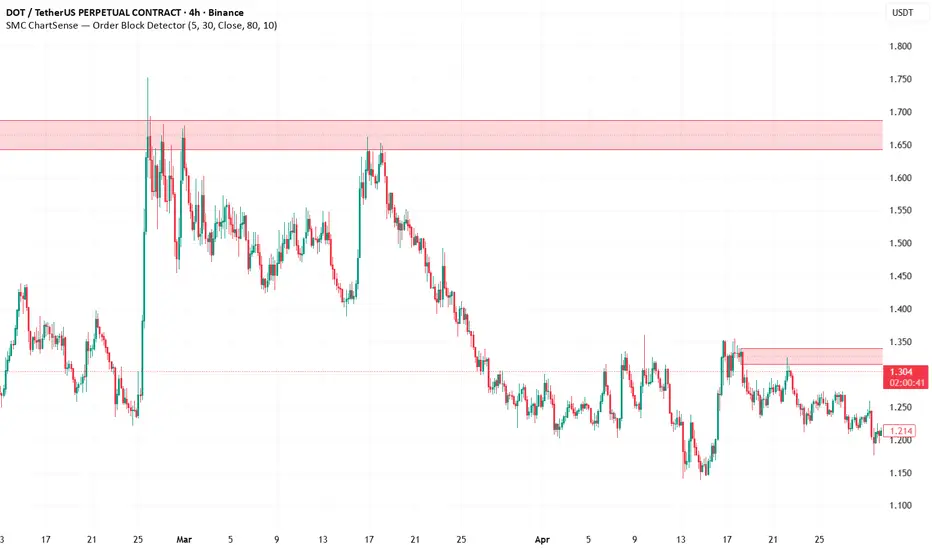
Order Block Detector [SMC ChartSense]# SMC ChartSense — Order Block Detector
**Order block detection with mandatory FVG (Fair Value Gap) confirmation.** Each zone marked must have a 3-bar FVG at the anchor candle — institutional displacement that left a literal gap in price. Most basic OB scripts flag every breakout candle as an order block; this script filters to only the zones that came with displacement footprint, producing a cleaner chart with fewer but more meaningful zones.
## How it works
The script tracks swing pivots at
Indicatore
Market Sessions [Crypto Imperija]Market Sessions is a clean session-mapping indicator designed for crypto traders who want to better understand how price behaves during different parts of the trading day.
The indicator highlights the main market sessions directly on the chart using customizable boxes, session names, session times, completed session high/low levels, sweep detection, reclaim detection and alerts.
It is especially useful for traders who work with liquidity concepts, session ranges, intraday market structure, a
Indicatore

Flat VWMA Highs 3The Flat VWMA High3 is a short-term resistance detection indicator based on the Volume-Weighted Moving Average (VWMA) applied to the high prices of candles. By default, it uses a length of 3, averaging the last three highs while weighting them according to traded volume.
Because higher-volume candles have a greater influence on the calculation, the indicator is designed to highlight areas where significant selling pressure or price rejection may be occurring. When the VWMA of highs becomes near
Indicatore

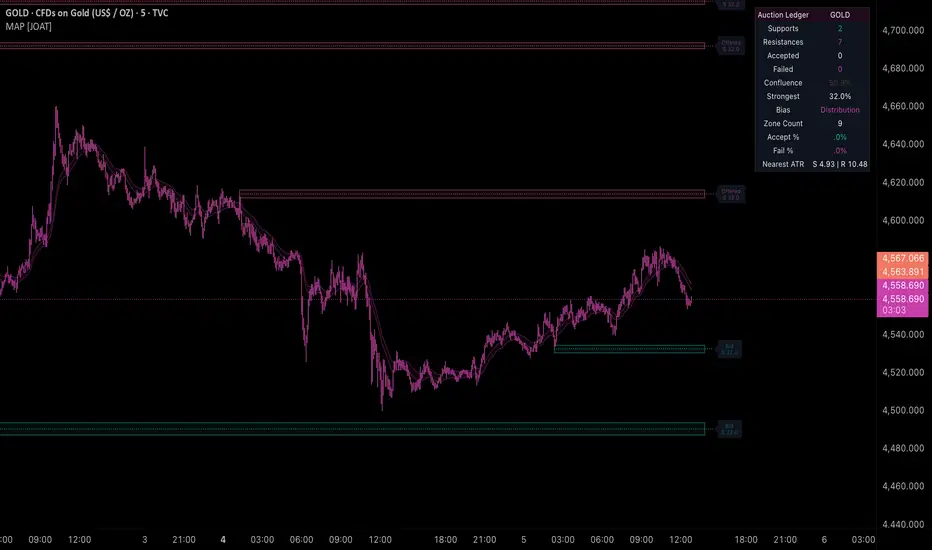
Auction Structure Ledger [JOAT]Auction Structure Ledger
Introduction
Auction Structure Ledger is an open-source Pine Script v6 indicator that transforms confirmed pivot behavior into structured auction zones. Instead of treating every swing high and swing low as equally important, the script looks for clustered defended pivots, measures how much volume-confluence exists at those prices, and converts the result into support and resistance shelves that persist, update, and eventually retire as price accepts or fails them.
Indicatore
HTF Context Overlay [EmpArchitect]█ OVERVIEW
HTF Context Overlay draws clean higher-timeframe reference levels directly on your chart: previous day/week/month highs and lows, daily open, midnight open, and key session opens.
It is designed as a passive context layer for ICT, SMC, and price-action workflows.
No signals.
No entries.
No stop losses.
No take profits.
No predictions.
This tool answers one simple question:
Where is price trading relative to the important higher-timeframe reference levels?
█ LEVELS INCLUDED
Dail
Indicatore

Hull Market Structure [BOSWaves]Hull Market Structure - Hull-Filtered Break of Structure Detection with Integrated Position Planning
Overview
Hull Market Structure is a structure-based trend identification system that detects Break of Structure and Change of Character events through swing pivot analysis filtered by Hull Moving Average trend direction, where signal validity, structural level plotting, and position tool generation are governed by the alignment between confirmed swing breaks and the underlying Hull trend
Indicatore

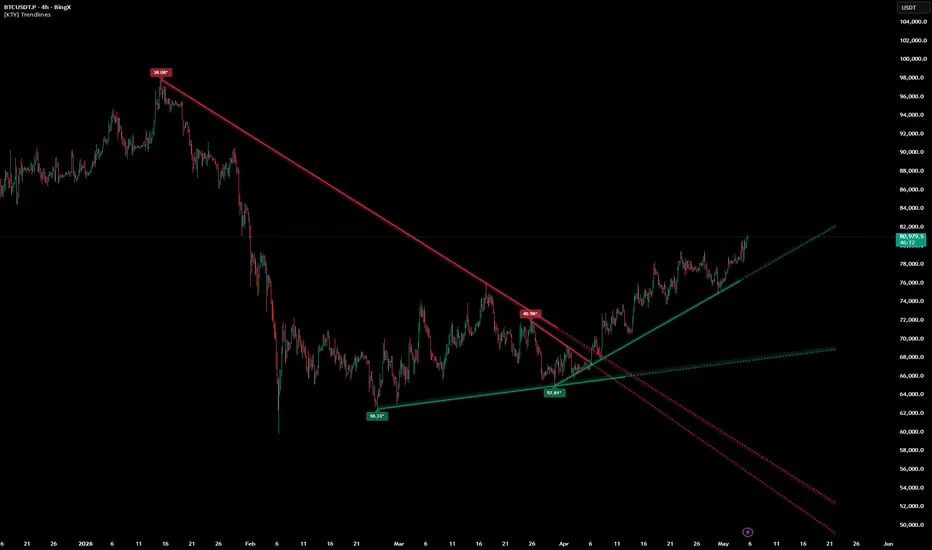
[KTY] Auto Trendlines Auto Trendlines
Automatically detects and draws diagonal trendlines
based on pivot highs and lows.
━━━━━━━━━━━━━━━━━━━━━━━━━━━━━━━
🔑 Key Features
━━━━━━━━━━━━━━━━━━━━━━━━━━━━━━━
✅ Auto Trendline Detection
Scans recent price action and plots dynamic trendlines
that adapt to ongoing market structure.
Bullish (Green): Connects ascending lows — acts as dynamic support
Bearish (Red): Connects descending highs — acts as dynamic resistance
Each trendline includes a soft glow background
for
Indicatore
ES/SPX/SPY & HSI Future/Cash Index Realtime converter + GEXThis script is designed for traders who monitor Gamma Exposure (GEX) levels on cash indices (SPX, HSI) but execute trades on their respective Futures (ES, HSI!) or ETFs (SPY).
Because of the "Basis" (the price difference caused by interest rates and dividends), cash levels and futures prices do not align perfectly. This indicator solves that problem by calculating the real-time basis and automatically mapping your GEX levels to your current chart.
🚀 Key Features
Real-Time Basis Calculatio
Indicatore

IFVG + Suspension Blocks + Extended Inside Bar + IDM/PullbacksThis indicator combines multiple independent market-structure tools into one script while keeping each logic separate and individually controllable.
Features include:
IFVG / BPR detection
ICT Suspension Blocks
Extended Inside Bar range highlighting
Internal and External Pullback markers
IDM line detection
Each module can be enabled or disabled from the indicator settings, allowing traders to focus only on the tools they want visible on the chart.
Designed by : SQT (ShadowQuant Trader)
Credit
Indicatore

Bias Engine ICT ConceptBias Engine - ICT Concept
Bias Engine is a market context tool built around ICT (Inner Circle
Trader) methodology. It reads directional bias, identifies draw
targets, and tracks key liquidity levels across multiple timeframes all displayed in a single compact panel.
Most ICT traders manage 4 to 6 separate tools to get the same
picture. This indicator consolidates that context into one place.
WEEKLY AND DAILY LEVELS
Tracks the previous week high/low (PWH/PWL) and previous day
high/low (PDH
Indicatore

Session Killzones ICT ConceptSession Killzones - ICT Concept
Session Killzones plots the four standard ICT killzone sessions
(Asia, London, NY AM, NY PM) in New York time. It tracks unswept
session highs and lows in real time, fires alerts on sweeps, and
displays a compact session info panel with countdown.
Built for ICT traders who need to know which session levels are
still active and which have already been taken.
SESSIONS
Draws session boxes and boundary lines for each killzone in New
York time with automatic DST
Indicatore

Cross Structure Levels (CSL)Cross Structure Levels (CSL)
Cross Structure Levels (CSL) is a structural tool designed to help visualize moving average crosses in a more practical way.
In many trading environments, moving average crosses are used as a confirmation of directional bias. However, these events are often missed in real time, and the subsequent price movement develops after the initial cross.
This script transforms those crosses into horizontal levels, allowing traders to track how price interacts with them ove
Indicatore

T2 PD & PM HLPrevious Day High and Low (Regular Hours) and Pre-Market High and Low (4am ET to 9:29ET). Resets each day.
Indicatore

Order Block Zone Study + ConfirmationOrder Block Zone Study + Confirmation marks support and resistance order-block zones, then helps users judge whether price is only reaching a zone or reacting with confirmation.
It is designed to answer three simple questions:
Where is the order-block zone?
How strong is the zone based on the model?
Is price only touching it, or is confirmation also active?
The goal is not to give automatic trade calls. The goal is to make order-block zones easier to read, compare, and monitor.
==
Indicatore
