

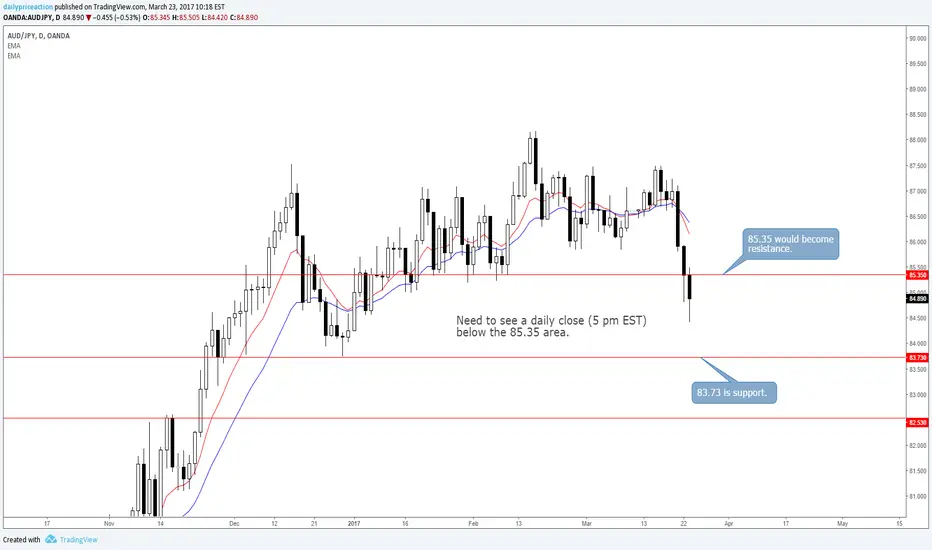
The AUDJPY appears to have broken a key support level. The 85.35 handle has been a critical factor for the pair since the start of 2017 and yesterday’s close at 85.32 should continue to attract selling pressure.
But as you may well know, what we sometimes think are precise levels are instead areas of support or resistance. So yesterday’s close being just 3 pips below 85.35 leaves me too skeptical to do anything at the moment.
Also, the yen cross is now 140 pips below the mean as measured by the 10 and 20 EMAs. With this in mind, I’d rather wait for a more convincing close below 85.35 followed by a retest of the area as new resistance.
The next key support level comes in at the December 29th low of 83.73. This area also attracted a bid in late November and early December of last year. A close below 83.73 would expose the mid-November highs at 82.50.
Right now the technical landscape for the AUDJPY is favorable, to say the least. The pair has been respecting the key levels mentioned above, and the recent breakdown presents a potential selling opportunity.
But perhaps even more favorable than the levels is the fact that other risk-sensitive pairs are showing signs of weakness. Some of the best trades can occur when the yen pairs begin to move in tandem.
Look no further than the rally that ensued from the November 9th U.S. elections.
But as you may well know, what we sometimes think are precise levels are instead areas of support or resistance. So yesterday’s close being just 3 pips below 85.35 leaves me too skeptical to do anything at the moment.
Also, the yen cross is now 140 pips below the mean as measured by the 10 and 20 EMAs. With this in mind, I’d rather wait for a more convincing close below 85.35 followed by a retest of the area as new resistance.
The next key support level comes in at the December 29th low of 83.73. This area also attracted a bid in late November and early December of last year. A close below 83.73 would expose the mid-November highs at 82.50.
Right now the technical landscape for the AUDJPY is favorable, to say the least. The pair has been respecting the key levels mentioned above, and the recent breakdown presents a potential selling opportunity.
But perhaps even more favorable than the levels is the fact that other risk-sensitive pairs are showing signs of weakness. Some of the best trades can occur when the yen pairs begin to move in tandem.
Look no further than the rally that ensued from the November 9th U.S. elections.

I post my chart setups here on TradingView.
For full breakdowns, videos, and daily lessons, visit Daily Price Action.
For full breakdowns, videos, and daily lessons, visit Daily Price Action.
免責事項
これらの情報および投稿は、TradingViewが提供または承認する金融、投資、取引、またはその他の種類の助言もしくは推奨であることを意図したものではなく、またこれらに該当するものでもありません。詳細は利用規約をご覧ください。
I post my chart setups here on TradingView.
For full breakdowns, videos, and daily lessons, visit Daily Price Action.
For full breakdowns, videos, and daily lessons, visit Daily Price Action.
免責事項
これらの情報および投稿は、TradingViewが提供または承認する金融、投資、取引、またはその他の種類の助言もしくは推奨であることを意図したものではなく、またこれらに該当するものでもありません。詳細は利用規約をご覧ください。