

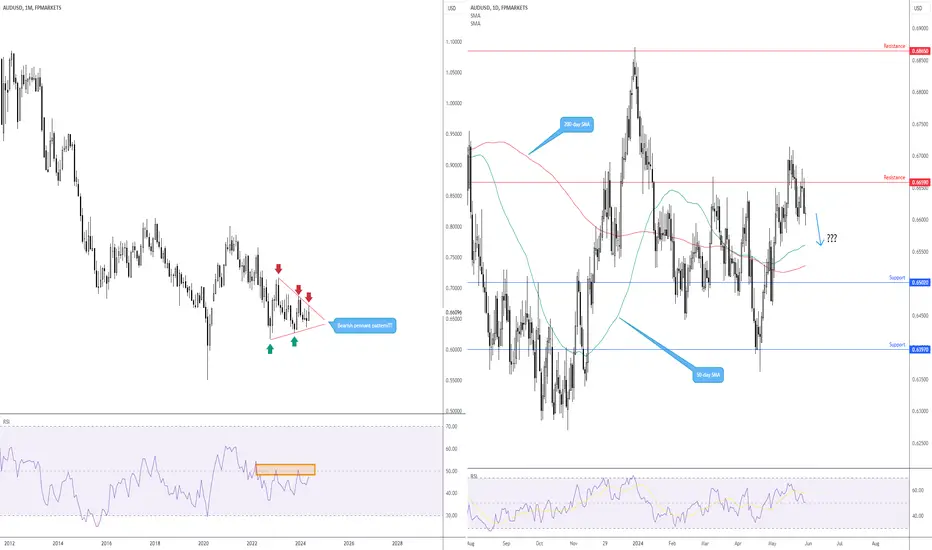
While the AUD/USD shows signs of trending higher on the daily chart – a series of higher highs and higher lows have been seen since $0.6362 – the unit recently connected with resistance at $0.6659, a move bolstered by the monthly chart linking with the upper boundary of a potential bearish pennant formation, drawn from a high of $0.7158 and a low of $0.6170.
Coupled with the above analysis and the Relative Strength Index (RSI) holding south of the 50.00 centreline on the monthly chart and daily flow also poised to break through the 50.00 centreline, this could prompt further selling in the currency pair towards the 200-day and 50-day SMA combination between $0.6528 and $0.6560.
Coupled with the above analysis and the Relative Strength Index (RSI) holding south of the 50.00 centreline on the monthly chart and daily flow also poised to break through the 50.00 centreline, this could prompt further selling in the currency pair towards the 200-day and 50-day SMA combination between $0.6528 and $0.6560.

関連の投稿
免責事項
これらの情報および投稿は、TradingViewが提供または承認する金融、投資、取引、またはその他の種類の助言もしくは推奨であることを意図したものではなく、またこれらに該当するものでもありません。詳細は利用規約をご覧ください。
免責事項
これらの情報および投稿は、TradingViewが提供または承認する金融、投資、取引、またはその他の種類の助言もしくは推奨であることを意図したものではなく、またこれらに該当するものでもありません。詳細は利用規約をご覧ください。