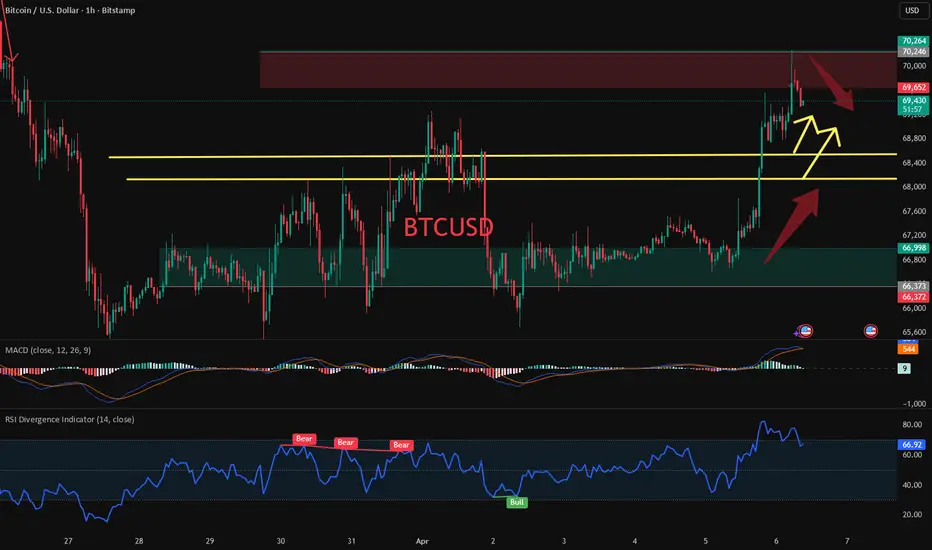
After a period of consolidation last week, Bitcoin broke through the $69,000 mark in early Asian trading, reaching a 24-hour high of $70,264 before slightly retracing its gains. The current price is consolidating around $69,500.
The core drivers of this rebound are twofold: first, signs of easing geopolitical tensions, with rumors of ceasefire negotiations between the US and Iran boosting risk asset sentiment; second, the price increase triggered a massive short squeeze, forcing the liquidation of bearish positions.
The RSI (14) is 73.49, the CCI is 226.64, and the Williams %R is -14.13, all in overbought territory.
The MA7 (69,628) > MA30 (69,225) > MA120 (67,897), indicating a complete bullish alignment of moving averages. The ADX is at 48.66, indicating a strong trend, but the CCI has entered overbought territory (122.68), so caution is advised regarding the risk of chasing the price higher.
The 8-hour chart shows three consecutive bullish RSI divergence signals (price making new lows but RSI lows rising). The first divergence triggered a 4.83% rebound, the second only 1.47%, and the third has generated approximately 4.24% so far. However, all three rebounds have failed to hold above $69,182 – this ceiling remains unbroken.
The current price is in overbought territory, but the 4-hour and 15-minute overbought indicators are not absolute sell signals. A short-term upward move followed by a pullback is possible. Shorting at the current level is not recommended. A more prudent approach is to wait for the price to test the $70,000-$70,300 area before entering a short position.
Long positions can be initiated when the price retraces to the key support zone of $66,600–$67,500. Aggressive traders: Consider entering the market on a pullback to $68,000–$68,500.
In the short term, BTC is at a critical juncture in the battle between bulls and bears. On one hand, the MACD daily golden cross and double bottom pattern provide a technical basis for a reversal, while the expectation of a geopolitical ceasefire provides support on the sentiment side. On the other hand, the bearish alignment of daily moving averages, continuous selling by whales, weak institutional demand, and extreme market fear all constrain further upward price movement.
 BTCUSD BTCUSD BTCUSD BTCUSD BTCUSD
The core drivers of this rebound are twofold: first, signs of easing geopolitical tensions, with rumors of ceasefire negotiations between the US and Iran boosting risk asset sentiment; second, the price increase triggered a massive short squeeze, forcing the liquidation of bearish positions.
The RSI (14) is 73.49, the CCI is 226.64, and the Williams %R is -14.13, all in overbought territory.
The MA7 (69,628) > MA30 (69,225) > MA120 (67,897), indicating a complete bullish alignment of moving averages. The ADX is at 48.66, indicating a strong trend, but the CCI has entered overbought territory (122.68), so caution is advised regarding the risk of chasing the price higher.
The 8-hour chart shows three consecutive bullish RSI divergence signals (price making new lows but RSI lows rising). The first divergence triggered a 4.83% rebound, the second only 1.47%, and the third has generated approximately 4.24% so far. However, all three rebounds have failed to hold above $69,182 – this ceiling remains unbroken.
The current price is in overbought territory, but the 4-hour and 15-minute overbought indicators are not absolute sell signals. A short-term upward move followed by a pullback is possible. Shorting at the current level is not recommended. A more prudent approach is to wait for the price to test the $70,000-$70,300 area before entering a short position.
Long positions can be initiated when the price retraces to the key support zone of $66,600–$67,500. Aggressive traders: Consider entering the market on a pullback to $68,000–$68,500.
In the short term, BTC is at a critical juncture in the battle between bulls and bears. On one hand, the MACD daily golden cross and double bottom pattern provide a technical basis for a reversal, while the expectation of a geopolitical ceasefire provides support on the sentiment side. On the other hand, the bearish alignment of daily moving averages, continuous selling by whales, weak institutional demand, and extreme market fear all constrain further upward price movement.
BTCUSD BTCUSD BTCUSD BTCUSD BTCUSD トレード稼働中
The current price is $70,100, and it's time to short. I will post the latest updates in my trading circle in real time.トレード終了: 利益確定目標に到達
With a perfect prediction of the trend, we can now close the order and retain profits.I will post the latest updates in my trading circle in real time.
免責事項
これらの情報および投稿は、TradingViewが提供または承認する金融、投資、取引、またはその他の種類の助言もしくは推奨であることを意図したものではなく、またこれらに該当するものでもありません。詳細は利用規約をご覧ください。
免責事項
これらの情報および投稿は、TradingViewが提供または承認する金融、投資、取引、またはその他の種類の助言もしくは推奨であることを意図したものではなく、またこれらに該当するものでもありません。詳細は利用規約をご覧ください。