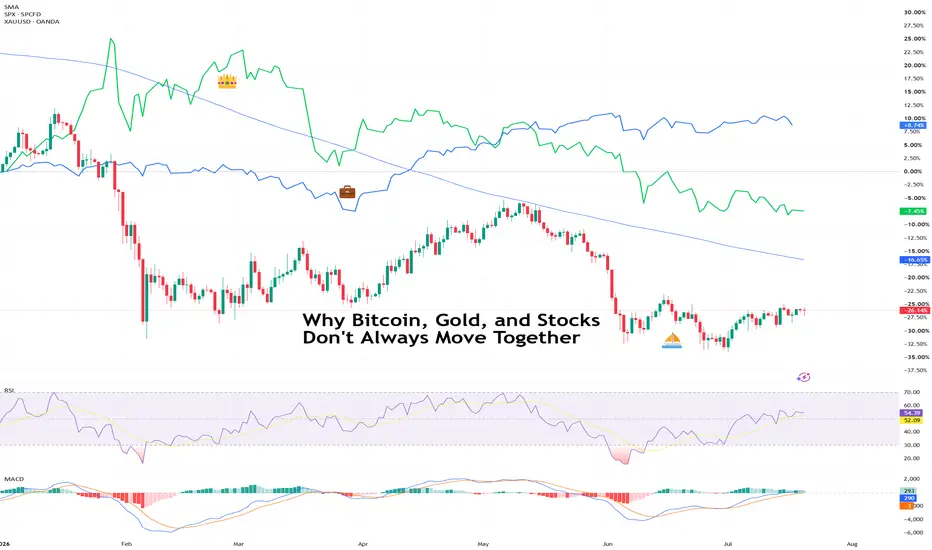
Why Bitcoin, Gold, and Stocks Don't Always Move TogetherThree markets walk into a bar…
Imagine Bitcoin BITSTAMP:BTCUSD , gold OANDA:XAUUSD and the S&P 500 SPCFD:SPX sitting at the same table.
Sometimes they're celebrating together. Other times they're arguing over the bill. And every so often, one storms out while the other two barely notice.
Th
Compare with BTC/USD
Key facts today
BTCUSD slipped after U.S. spot Bitcoin ETFs posted roughly $225M net outflows Thursday, led by about $203M from the iShares Bitcoin Trust, signaling short-term selling pressure. 1
BTCUSD spot CFD: long-term holder SOPR under 1 for 50+ days; June supply in loss >50%; demand mixed—weak spot interest but some institutional allocations; historical bear bottoms noted. 1
BTCUSD one-year realized volatility ~42% at end of Q2 2026, near multi-year lows per ARK. Historically, low volatility periods preceded sharp moves after catalysts. 1
Key stats
Details
Bitcoin is the world’s most traded cryptocurrency, and represents the largest piece of the crypto market pie. It was the first digital coin and as such, remains the most famous and widely-adopted cryptocurrency in the world. It's the original gangster in whose footsteps all other coins follow. The birth of Bitcoin was the genesis of an entirely new asset class, and a huge step away from traditional, centrally controlled money. Today, many advocates believe Bitcoin will facilitate the next stage for the global financial system, although this — of course — remains to be seen.
Open interest
Liquidations
Long
Short
Price
BTCUSD – Bearish Rejection & Downside Continuation Setup📊 BTCUSD – Bearish Rejection & Downside Continuation Setup
🔍 Market Overview
Bitcoin is facing renewed selling pressure after rejecting a major resistance zone aligned with a rising trendline. The recent bullish recovery failed to sustain above resistance, suggesting that sellers remain active and
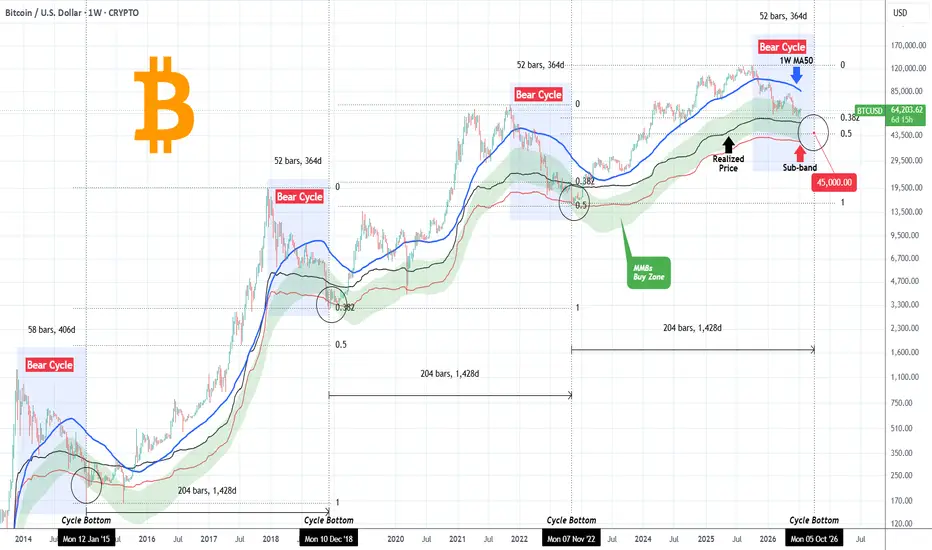
BITCOIN Three Indicators. One Cycle Bottom around $45000.Bitcoin (BTCUSD) gets closer every day to the final Selling Sequence that should technically price the Bear Cycle bottom, which according to the 4-year Cycle Model, is expected to be in by the week of October 05 2026.
Three key macro indicators point towards the same expected bottom. BTC has alread
Bitcoin Distribution AheadBitcoin has already swept daily buy-side liquidity and is now trading beneath a major Daily Fair Value Gap. Unless buyers reclaim this premium zone with conviction, the current structure favors a distribution phase before any meaningful continuation higher.
Liquidity has been taken. Now watch where
BTC/USD Bearish Rejection from Rising ChannelBTC/USD is showing signs of weakness after facing rejection near the upper boundary of the rising channel. Following a strong bullish rally, price failed to sustain higher levels and has started pulling back while trading around the Ichimoku Cloud resistance. The highlighted demand zone near **63,65
The Market Moves Differently When Nobody Is WatchingSome of the cleanest price action develops during periods when public attention is low.
This seems counterintuitive because most traders associate opportunity with activity. They expect the best setups to appear when social media is active, news is flowing, and everyone is focused on the same chart.
BTCUSD About To Break The Cross Resistance: Expecting 70k SoonBTCUSD continues to trade within a bullish market structure after reclaiming higher prices from the major demand zone. The chart shows sustained buying pressure, with price now testing a key psychological resistance area around $65,500. From a Smart Money Concepts (SMC) perspective, buyers remain in
BTC/USD Bullish Breakout Eyes Major Resistance**
🎯 **65,500**
BTC/USD is showing renewed bullish momentum after reclaiming key support and holding above the Ichimoku Cloud. Price has successfully broken the recent **Break of Structure (BOS)** and is forming higher highs and higher lows, signaling that buyers remain in control. As long as the pri
BITCOIN Short-term 'break or make' moment. $67250 or $63500?Bitcoin (BTCUSD) just hit the top of its 2-week Channel Up, closing the latest 4H candle exactly on its Top (Higher Highs trend-line). This opens up an technical break-out or rejection scenario for BTC.
If it closes a 4H candle above the Channel Up, we will have a bullish break-out, potentially tar
B T C : ($64 181 Take Profit)The (Scalp Trade) towards the (Upside Direction) has held very well and managed to hit the (Take Profit) as we were simply just (Capitalizing) on the(1H Time Frame) while using the momentum provided by the (Bulls)
The (Entry Price) was ($64 181) and the (Stop Loss) price is ($63 221) with a (Take P
See all ideas
Summarizing what the indicators are suggesting.
Oscillators
Neutral
SellBuy
Strong sellStrong buy
Strong sellSellNeutralBuyStrong buy
Oscillators
Neutral
SellBuy
Strong sellStrong buy
Strong sellSellNeutralBuyStrong buy
Summary
Neutral
SellBuy
Strong sellStrong buy
Strong sellSellNeutralBuyStrong buy
Summary
Neutral
SellBuy
Strong sellStrong buy
Strong sellSellNeutralBuyStrong buy
Summary
Neutral
SellBuy
Strong sellStrong buy
Strong sellSellNeutralBuyStrong buy
Moving Averages
Neutral
SellBuy
Strong sellStrong buy
Strong sellSellNeutralBuyStrong buy
Moving Averages
Neutral
SellBuy
Strong sellStrong buy
Strong sellSellNeutralBuyStrong buy
Displays a symbol's price movements over previous years to identify recurring trends.
Discover funds exposed to Bitcoin and find another way to access the coin.
Frequently asked questions
The current price of Bitcoin (BTC) is 63,930.00 USD — it has fallen −1.97% in the past 24 hours. Try placing this info into the context by checking out what coins are also gaining and losing at the moment and seeing BTC price chart.
The current market capitalization of Bitcoin (BTC) is 1.28 T USD. To see this number in a context check out our list of crypto coins ranked by their market caps or see crypto market cap charts.
Bitcoin (BTC) trading volume in 24 hours is 24.42 B USD. See how often other coins are traded in this list.
Bitcoin price has fallen by −0.01% over the last week, its month performance shows a 1.78% increase, and as for the last year, Bitcoin has decreased by −45.99%. See more dynamics on BTC price chart.
Keep track of coins' changes with our Crypto Coins Heatmap.
Bitcoin (BTC) reached its highest price on Oct 6, 2025 — it amounted to 126,327.15 USD. Find more insights on the BTC price chart.
See the list of crypto gainers and choose what best fits your strategy.
Bitcoin (BTC) reached the lowest price of 456.36 USD on Aug 2, 2016. View more Bitcoin dynamics on the price chart.
See the list of crypto losers to find unexpected opportunities.
The current circulating supply of Bitcoin (BTC) is 20.06 M USD. To get a wider picture you can check out our list of coins with the highest circulating supply, as well as the ones with the lowest number of tokens in circulation.
Bitcoin has the limit of 21.00 M coins. No matter how the currency evolves, no new coins will be released after this number is reached.
The safest choice when buying BTC is to go to a well-known crypto exchange. Some of the popular names are Binance, Coinbase, Kraken. But you'll have to find a reliable broker and create an account first. You can trade BTC right from TradingView charts — just choose a broker and connect to your account.
Crypto markets are famous for their volatility, so one should study all the available stats before adding crypto assets to their portfolio. Very often it's technical analysis that comes in handy. We prepared technical ratings for Bitcoin (BTC): today its technical analysis shows the sell signal, and according to the 1 week rating BTC shows the sell signal. And you'd better dig deeper and study 1 month rating too — it's sell. Find inspiration in Bitcoin trading ideas and keep track of what's moving crypto markets with our crypto news feed.
Bitcoin (BTC) is just as reliable as any other crypto asset — this corner of the world market is highly volatile. Today, for instance, Bitcoin is estimated as 0.38% volatile. The only thing it means is that you must prepare and examine all available information before making a decision. And if you're not sure about Bitcoin, you can find more inspiration in our curated watchlists.
You can discuss Bitcoin (BTC) with other users in our public chats, Minds or in the comments to Ideas.