
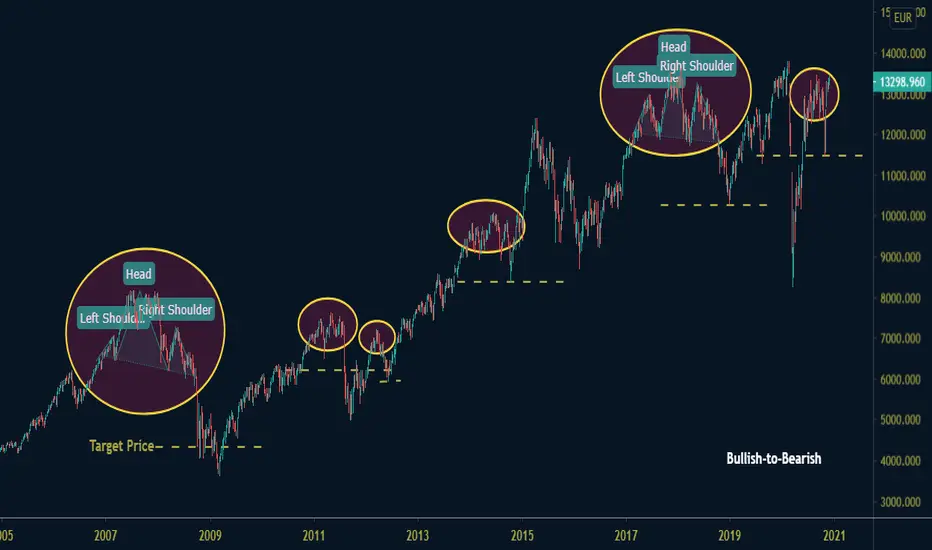
A Head and Shoulders pattern is a chart formation that appears as a baseline with three peaks, the outside two are close in height and the middle is highest. In Technical Analysis, it describes a specific chart formation that predicts a trend reversal. The head and shoulders pattern is one of the most used reversal patterns because of its good reliability.
Here the example of the DAX index, where the pattern has been effective 6 times in the last 13 years (Bullish-to-Bearish case).
Here the example of the DAX index, where the pattern has been effective 6 times in the last 13 years (Bullish-to-Bearish case).

免責事項
これらの情報および投稿は、TradingViewが提供または承認する金融、投資、取引、またはその他の種類の助言もしくは推奨であることを意図したものではなく、またこれらに該当するものでもありません。詳細は利用規約をご覧ください。
免責事項
これらの情報および投稿は、TradingViewが提供または承認する金融、投資、取引、またはその他の種類の助言もしくは推奨であることを意図したものではなく、またこれらに該当するものでもありません。詳細は利用規約をご覧ください。