
DJI CMP 33876
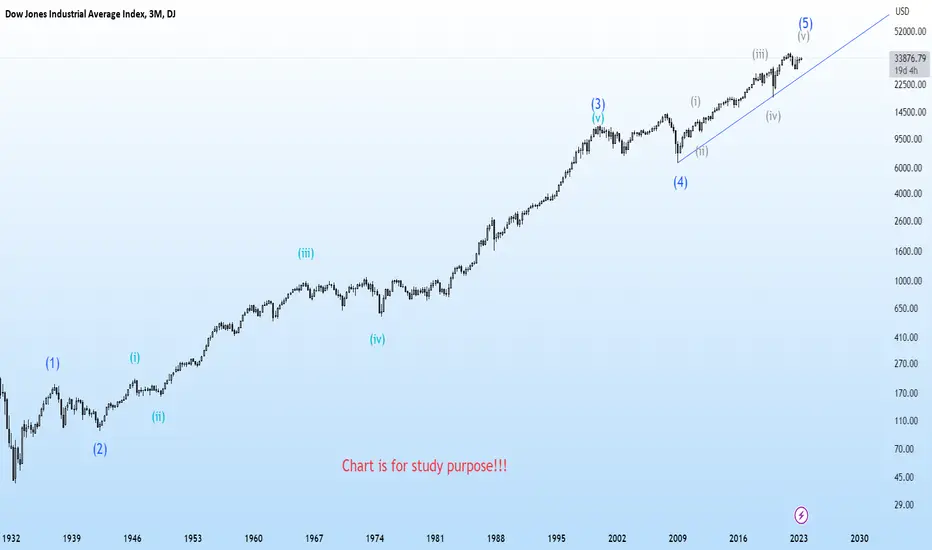
This is Quarterly chart of DJI,
There is Wave counts right from the Great Depression low
looking at the charts ,
one can see that we are in wave 5 (blue)
the internal counts (grey) shows subwave
whenever this superwave gets completed....
one can expect markets to correct for next few yrs...
Just a View!!
Vedang :)
Chart is for study purpose only!!!

免責事項
これらの情報および投稿は、TradingViewが提供または承認する金融、投資、取引、またはその他の種類の助言もしくは推奨であることを意図したものではなく、またこれらに該当するものでもありません。詳細は利用規約をご覧ください。
免責事項
これらの情報および投稿は、TradingViewが提供または承認する金融、投資、取引、またはその他の種類の助言もしくは推奨であることを意図したものではなく、またこれらに該当するものでもありません。詳細は利用規約をご覧ください。