
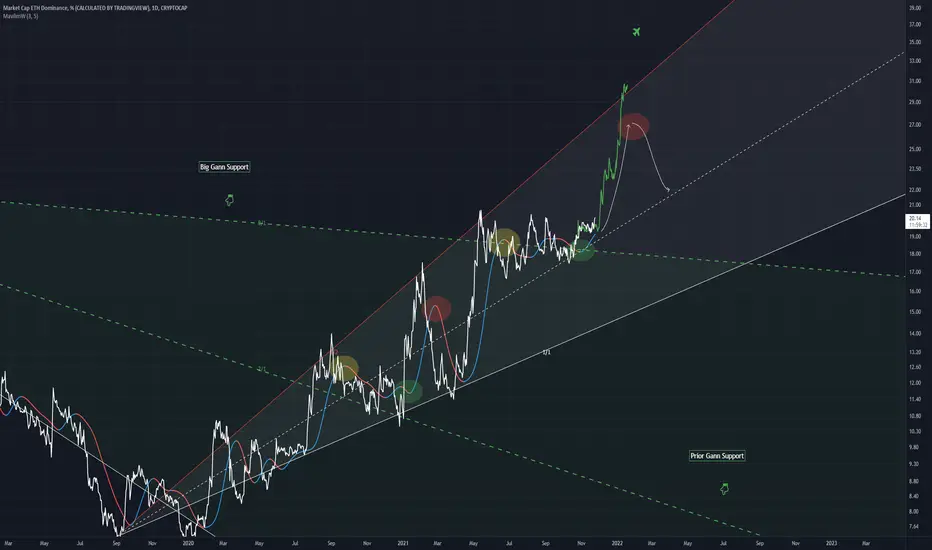
A Gann Fan analysis
Using the downtrend we can plot two points of Gann (2/1) and (8/1) both can be seen to be support points for the price
The uptrend Gann fan shows continually hitting of the top (1/2) seeing this we can assume that pressure is building up at this resistance point, and the bullflag that has formed above the (8/1) Gann line will smash this resistance
The indicator (MavilimW) I have tried to show a comparison to the (2/1) Gann level, possible repeating pattern on the indicator (green, yellow and red ovals)
Basically I expect ETH dominance to increase dramatically

免責事項
これらの情報および投稿は、TradingViewが提供または承認する金融、投資、取引、またはその他の種類の助言もしくは推奨であることを意図したものではなく、またこれらに該当するものでもありません。詳細は利用規約をご覧ください。
免責事項
これらの情報および投稿は、TradingViewが提供または承認する金融、投資、取引、またはその他の種類の助言もしくは推奨であることを意図したものではなく、またこれらに該当するものでもありません。詳細は利用規約をご覧ください。