

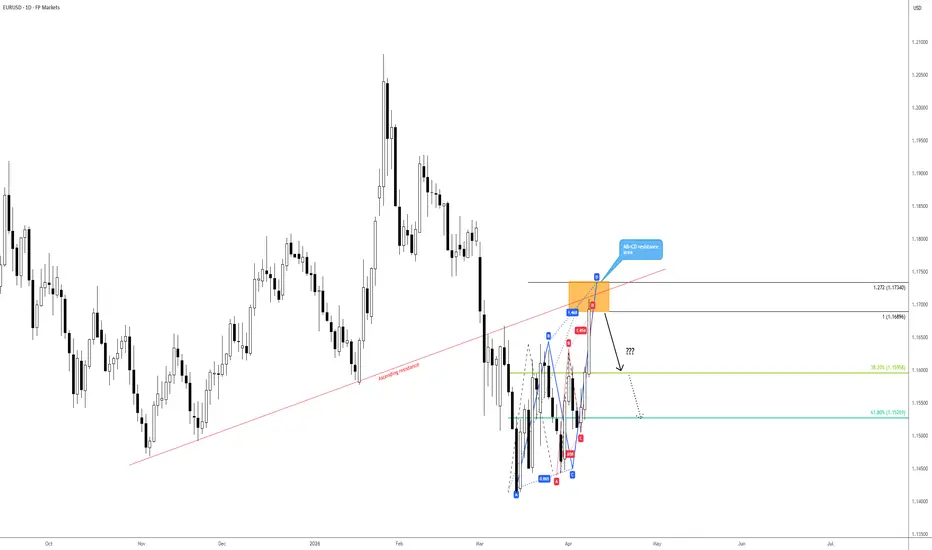
From the daily chart of the EUR/USD, the pair gained traction today amid a broad-based USD sell-off following the recent US-Iran ceasefire.
Technically, the unit is now shaking hands with a resistance zone between US$1.1734 and US$1.1690 – a base made up of a 1.272% Fibonacci projection and a 100% projection (AB=CD resistance levels). Complementing this area is an ascending resistance, taken from the low of US$1.1468.
Current AB=CD sellers will likely target the 38.2% and 61.8% Fibonacci retracements at US$1.1596 and US$1.1527, respectively, derived from legs A-D of the larger AB=CD pattern.
Written by FP Markets Chief Market Analyst Aaron Hill
Technically, the unit is now shaking hands with a resistance zone between US$1.1734 and US$1.1690 – a base made up of a 1.272% Fibonacci projection and a 100% projection (AB=CD resistance levels). Complementing this area is an ascending resistance, taken from the low of US$1.1468.
Current AB=CD sellers will likely target the 38.2% and 61.8% Fibonacci retracements at US$1.1596 and US$1.1527, respectively, derived from legs A-D of the larger AB=CD pattern.
Written by FP Markets Chief Market Analyst Aaron Hill

免責事項
これらの情報および投稿は、TradingViewが提供または承認する金融、投資、取引、またはその他の種類の助言もしくは推奨であることを意図したものではなく、またこれらに該当するものでもありません。詳細は利用規約をご覧ください。
免責事項
これらの情報および投稿は、TradingViewが提供または承認する金融、投資、取引、またはその他の種類の助言もしくは推奨であることを意図したものではなく、またこれらに該当するものでもありません。詳細は利用規約をご覧ください。