
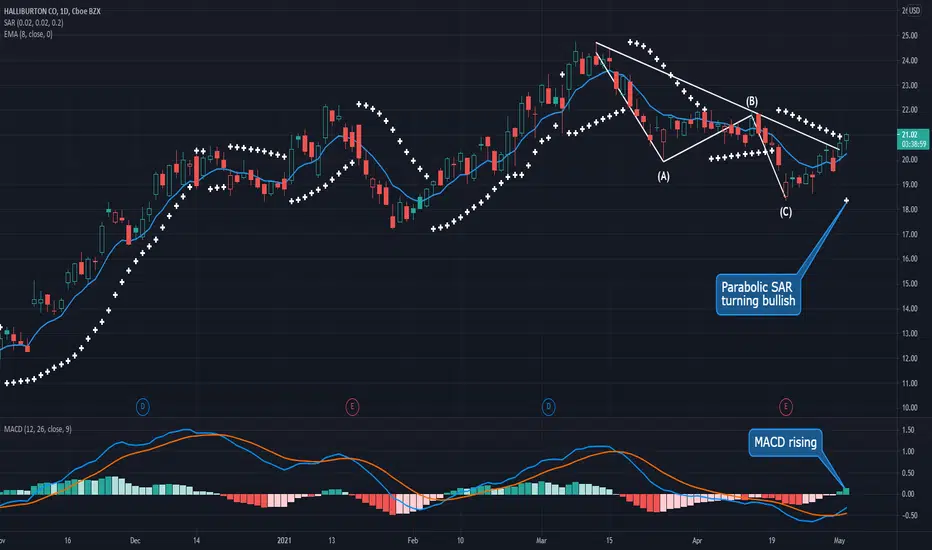
Energy is coming to life again as the economy reopens. Let’s take a look at oil-field service provider Halliburton, which has a few interesting chart patterns.
First is the downward-sloping trendline running along the highs of March and April. HAL closed above that resistance yesterday for the first time.
Second notice the tight range on the weekly chart, with a bullish inside candle last week, which it’s now escaping.

Next, HAL’s MACD crossed to positive yesterday.
Finally, consider how the stock has completed an ABC correction since March.
TradeStation is a pioneer in the trading industry, providing access to stocks, options, futures and cryptocurrencies. See our Overview for more.
First is the downward-sloping trendline running along the highs of March and April. HAL closed above that resistance yesterday for the first time.
Second notice the tight range on the weekly chart, with a bullish inside candle last week, which it’s now escaping.
Next, HAL’s MACD crossed to positive yesterday.
Finally, consider how the stock has completed an ABC correction since March.
TradeStation is a pioneer in the trading industry, providing access to stocks, options, futures and cryptocurrencies. See our Overview for more.

関連の投稿
免責事項
これらの情報および投稿は、TradingViewが提供または承認する金融、投資、取引、またはその他の種類の助言もしくは推奨であることを意図したものではなく、またこれらに該当するものでもありません。詳細は利用規約をご覧ください。
免責事項
これらの情報および投稿は、TradingViewが提供または承認する金融、投資、取引、またはその他の種類の助言もしくは推奨であることを意図したものではなく、またこれらに該当するものでもありません。詳細は利用規約をご覧ください。