
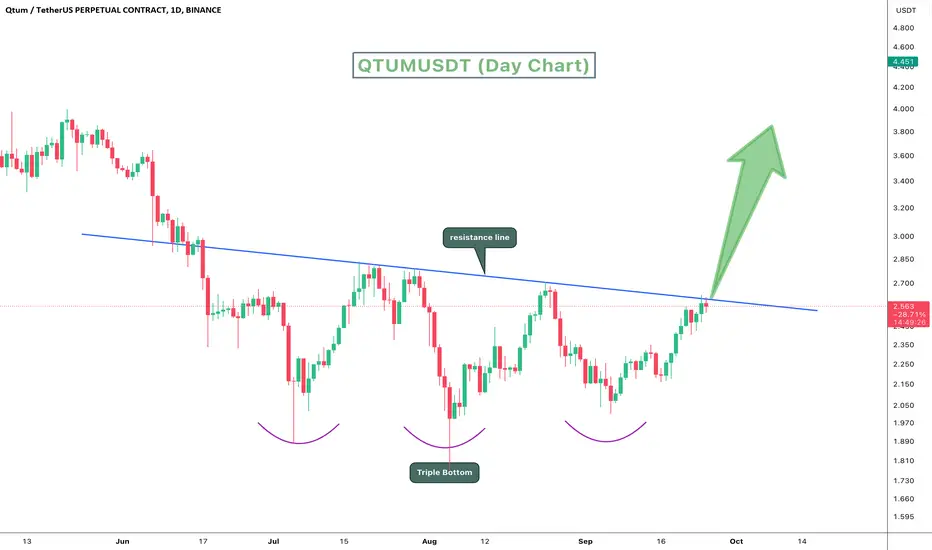
QTUMUSDT Technical analysis update.
QTUM has formed a triple bottom on the daily chart and is currently trading below the neckline resistance. Once a breakout is confirmed on the daily chart, we could see a strong bullish move in QTUM.
Buy level: After Breakout.
QTUM has formed a triple bottom on the daily chart and is currently trading below the neckline resistance. Once a breakout is confirmed on the daily chart, we could see a strong bullish move in QTUM.
Buy level: After Breakout.

🚀Telegram : t.me/hexatrades
🌐Website: hexatrades.io/
🗣️Twitter(X): twitter.com/HexaTrades
🌐Website: hexatrades.io/
🗣️Twitter(X): twitter.com/HexaTrades
関連の投稿
免責事項
これらの情報および投稿は、TradingViewが提供または承認する金融、投資、取引、またはその他の種類の助言もしくは推奨であることを意図したものではなく、またこれらに該当するものでもありません。詳細は利用規約をご覧ください。
🚀Telegram : t.me/hexatrades
🌐Website: hexatrades.io/
🗣️Twitter(X): twitter.com/HexaTrades
🌐Website: hexatrades.io/
🗣️Twitter(X): twitter.com/HexaTrades
関連の投稿
免責事項
これらの情報および投稿は、TradingViewが提供または承認する金融、投資、取引、またはその他の種類の助言もしくは推奨であることを意図したものではなく、またこれらに該当するものでもありません。詳細は利用規約をご覧ください。