QTUM USDT SHORT SIGNAL#5 QTUM/USDT – Trade Setup (SHORT)
📈 Position Type: SHORT
🕒 Timeframe: 1H
📊 Market: Futures
💰 Entry Zone:
0.7512
0.7665
🛑 Stop-Loss:
0.7780
🎯 Take-Profit Targets:
• TP1: 0.7362
• TP2: 0.7175
• TP3: 0.6997
• TP4: 0.6815
⚙️ Leverage:
5 *10
▫️ After TP1, move SL to Entry + 0.2%.
▪️ Exi
QTUM/USDT (4h) Testing a Breakout From a Symmetrical TriangleQTUM/USDT is testing the descending resistance of a large symmetrical triangle on the 4H chart after bouncing from rising support.
A confirmed close above the upper trendline could support a move toward 0.80–0.86 USDT. Rejection back inside the triangle would weaken the breakout, while a loss of th
QTUMUSDT 1D#QTUM is moving above the broken trendline and the daily SMA100. To continue its bullish movement, it needs to break above the resistance zone. If that happens, the potential upside targets are:
🎯 $1.095
🎯 $1.186
🎯 $1.276
🎯 $1.405
🎯 $1.570
⚠️ Always remember to use a tight stop-loss and maintain p
QTUMUSDT Breakout — Bullish Reversal in PlayQTUM is showing early signs of a trend shift on the 12H timeframe after a prolonged downtrend. Price has successfully broken above a descending trendline, indicating a potential bullish reversal.
Currently, price is attempting to hold above the breakout zone (1.00), which aligns with a high-volume
QTUM Descending Channel Breakout AttemptQTUM is showing its first serious breakout attempt after months inside a major descending channel.
Price has pushed above the local compression range and is now testing the broken structure around 0.91–0.92. This area is important because holding above it would confirm strength and keep the bullish
QTUM/USDT — Long at Range Base, Previous Sell ExhaustedQTUMUSDT Perpetual
Context:
QTUM has been trading in a defined range between 0.88 and 0.97 for over two weeks. The chart tells a clear story — a Sell signal fired at 0.93 back on April 9th and delivered a full move to the range low. Now, after sellers have done their work, a Buy signal has fired at
QTUMUSDT Forming Falling WedgeQTUMUSDT is forming a clear falling wedge pattern, a classic bullish reversal signal that often indicates an upcoming breakout. The price has been consolidating within a narrowing range, suggesting that selling pressure is weakening while buyers are beginning to regain control. With consistent volum
#QTUM/USDT — Descending Triangle at Demand Zone!#QTUM
The price is moving within a descending channel on the hourly timeframe. It has reached the lower boundary and is trending towards a bounce. A retest of this boundary is expected.
The Relative Strength Index (RSI) indicates a downward trend, and this trend is likely to continue due to the ov
Qtum, the Altcoins Market & Long-Term GrowthOne week of bullish action deletes seven weeks of bearish action, after a higher low. This is easy chart reading.
The full green candle this week on QTUMUSDT is breaking out of a falling wedge, a bullish reversal pattern.
Early reversal signals are everywhere, and many that are not so early. The a
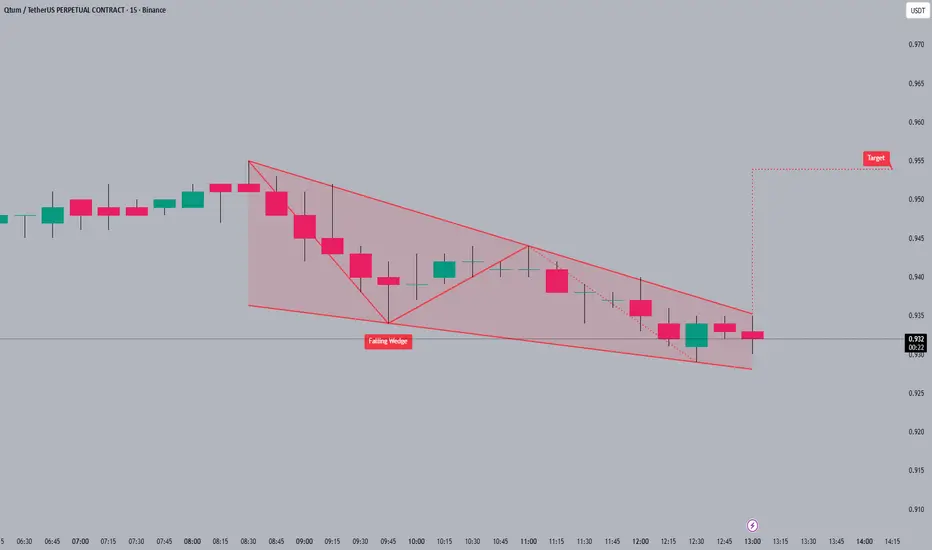
#QTUM#QTUM is currently trading within a falling wedge 📉 pattern, indicating a potential for a bullish reversal. The price action is consolidating 🧘 near the lower trendline of the wedge, which often precedes a breakout. If #QTUM breaks upward from this wedge, the next target is around 0.955 🎯.
When spo
See all ideas
Summarizing what the indicators are suggesting.
Oscillators
Neutral
SellBuy
Strong sellStrong buy
Strong sellSellNeutralBuyStrong buy
Oscillators
Neutral
SellBuy
Strong sellStrong buy
Strong sellSellNeutralBuyStrong buy
Summary
Neutral
SellBuy
Strong sellStrong buy
Strong sellSellNeutralBuyStrong buy
Summary
Neutral
SellBuy
Strong sellStrong buy
Strong sellSellNeutralBuyStrong buy
Summary
Neutral
SellBuy
Strong sellStrong buy
Strong sellSellNeutralBuyStrong buy
Moving Averages
Neutral
SellBuy
Strong sellStrong buy
Strong sellSellNeutralBuyStrong buy
Moving Averages
Neutral
SellBuy
Strong sellStrong buy
Strong sellSellNeutralBuyStrong buy
Displays a symbol's price movements over previous years to identify recurring trends.