
Bias: Bearish
Timeframe: Weekly / 4H
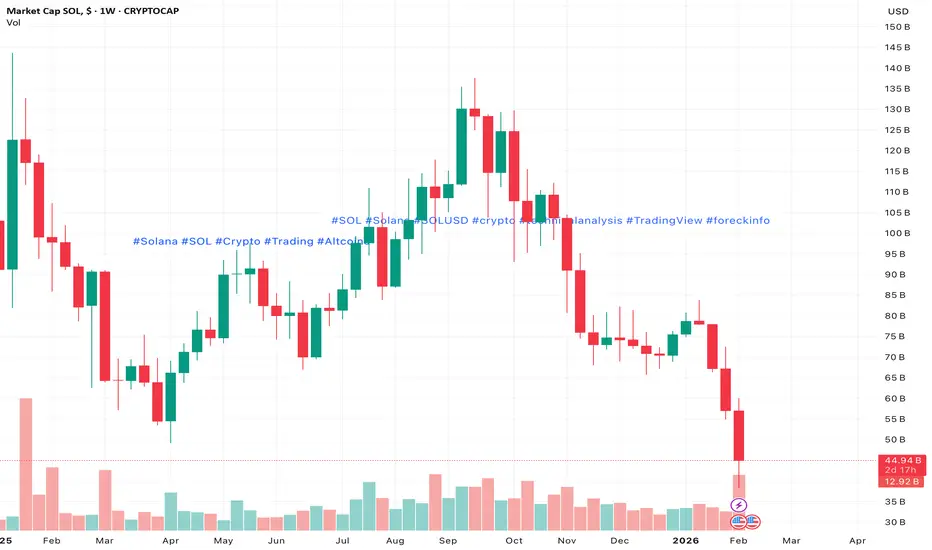
SOL has been declining for the third straight week and printed a January 2024 low near 89.20. The broader structure remains bearish, and momentum indicators confirm downside pressure.
⸻
Technical Picture
• Bollinger Bands: Sloping downward
• MACD: Expanding in negative territory
• Stochastic: Back in oversold zone
• Weekly structure: Bearish flag continuation
⸻
Key Levels
• Resistance: 125.00 → 150.00 → 162.50
• Support: 87.50 → 62.50
⸻
Primary Scenario — Bearish Continuation
• Trigger: Consolidation below 87.50
• Entry: 86.90 (SELL STOP)
• Target: 62.50
• Stop-loss: 100.00
• Horizon: 5–7 days
Rationale:
Break below Murray [–2/8] keeps the bearish flag active and opens the way toward the weekly target at 62.50.
⸻
Alternative Scenario — Bullish Reversal
• Trigger: Break and hold above 125.00
• Entry: 127.00 (BUY STOP)
• Targets: 150.00 → 162.50
• Stop-loss: 110.00
Rationale:
Reclaim of the BB midline and Murray [4/8] would invalidate the bearish setup and signal trend reversal.
⸻
Conclusion:
As long as SOL trades below 125.00, downside risks dominate. A confirmed move under 87.50 likely accelerates selling toward 62.50.
Timeframe: Weekly / 4H
SOL has been declining for the third straight week and printed a January 2024 low near 89.20. The broader structure remains bearish, and momentum indicators confirm downside pressure.
⸻
Technical Picture
• Bollinger Bands: Sloping downward
• MACD: Expanding in negative territory
• Stochastic: Back in oversold zone
• Weekly structure: Bearish flag continuation
⸻
Key Levels
• Resistance: 125.00 → 150.00 → 162.50
• Support: 87.50 → 62.50
⸻
Primary Scenario — Bearish Continuation
• Trigger: Consolidation below 87.50
• Entry: 86.90 (SELL STOP)
• Target: 62.50
• Stop-loss: 100.00
• Horizon: 5–7 days
Rationale:
Break below Murray [–2/8] keeps the bearish flag active and opens the way toward the weekly target at 62.50.
⸻
Alternative Scenario — Bullish Reversal
• Trigger: Break and hold above 125.00
• Entry: 127.00 (BUY STOP)
• Targets: 150.00 → 162.50
• Stop-loss: 110.00
Rationale:
Reclaim of the BB midline and Murray [4/8] would invalidate the bearish setup and signal trend reversal.
⸻
Conclusion:
As long as SOL trades below 125.00, downside risks dominate. A confirmed move under 87.50 likely accelerates selling toward 62.50.

免責事項
これらの情報および投稿は、TradingViewが提供または承認する金融、投資、取引、またはその他の種類の助言もしくは推奨であることを意図したものではなく、またこれらに該当するものでもありません。詳細は利用規約をご覧ください。
免責事項
これらの情報および投稿は、TradingViewが提供または承認する金融、投資、取引、またはその他の種類の助言もしくは推奨であることを意図したものではなく、またこれらに該当するものでもありません。詳細は利用規約をご覧ください。