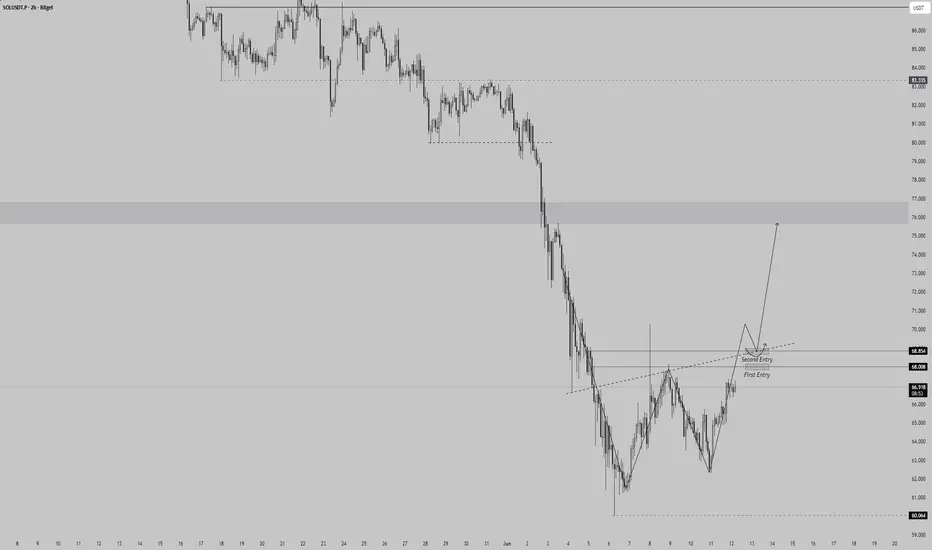
Monitoring Solana on the 2H timeframe. After a significant bearish move, we are seeing the formation of a potential W-pattern (double bottom) structure at the lows.
As illustrated in the chart, the price is coiling up, and I am watching for a clean breakout of the resistance levels highlighted as "First Entry" and "Second Entry."
The Trade Plan:
- The Trigger: I am waiting for a clean break and retest of the $68 zone.
- The Logic: The arrow shows my expected path. However, I am strictly following my rules: No trigger, no trade.
- Execution: Given the primary downtrend, this is a risky trade. If the setup confirms, I plan to scale into the position using the two entry points marked on the chart to manage risk effectively.
Disclaimer: This is a setup based on current price action. Always maintain your own risk management.
As illustrated in the chart, the price is coiling up, and I am watching for a clean breakout of the resistance levels highlighted as "First Entry" and "Second Entry."
The Trade Plan:
- The Trigger: I am waiting for a clean break and retest of the $68 zone.
- The Logic: The arrow shows my expected path. However, I am strictly following my rules: No trigger, no trade.
- Execution: Given the primary downtrend, this is a risky trade. If the setup confirms, I plan to scale into the position using the two entry points marked on the chart to manage risk effectively.
Disclaimer: This is a setup based on current price action. Always maintain your own risk management.
ノート
I longed  SOL here
Invalidation: H1 candle close below
TPs: Scale out on the way up
ノート
Another view for my Solana swing long to confirm my biasFlipped resistance into support, retested, and now looking for the bounce
It's a clean setup
トレード終了: 利益確定目標に到達
Unfortunately, I got stopped out on my perp position during that deviation.I've been accumulating spot throughout the entire drop, and I'm looking to sell at $200+ (likely in the coming months / by the end of the year)

関連の投稿
免責事項
これらの情報および投稿は、TradingViewが提供または承認する金融、投資、取引、またはその他の種類の助言もしくは推奨であることを意図したものではなく、またこれらに該当するものでもありません。詳細は利用規約をご覧ください。
関連の投稿
免責事項
これらの情報および投稿は、TradingViewが提供または承認する金融、投資、取引、またはその他の種類の助言もしくは推奨であることを意図したものではなく、またこれらに該当するものでもありません。詳細は利用規約をご覧ください。