
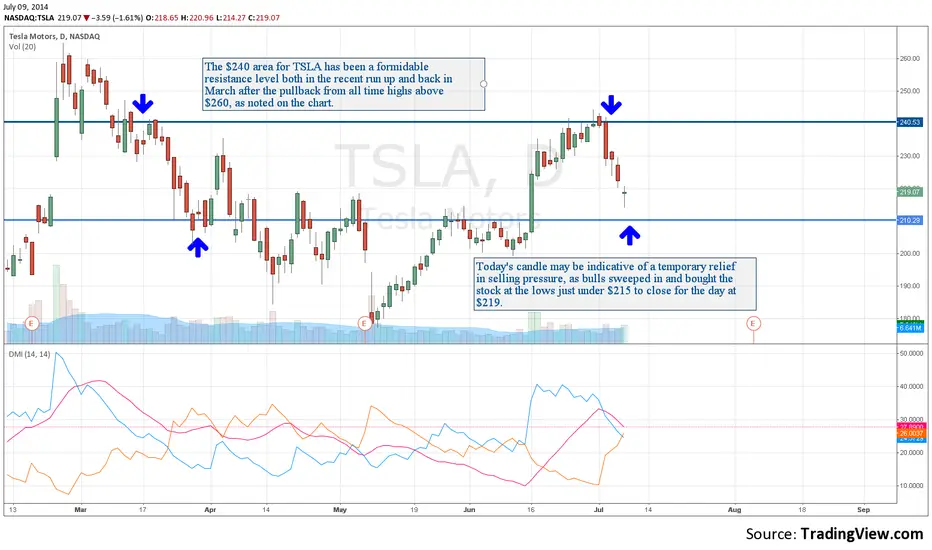
The $240 area for TSLA has been a formidable resistance level both in the recent run up as well as back in March after the pullback from all time highs above $260, as noted on the chart.
Today's candle may be indicative of a temporary relief in selling pressure, as bulls swept in and bought the stock at the lows just under $215 to close for the day at $219.
If the overall markets continue to pullback, it will be interesting to see if the stock can hold the $210 area, as this was the breakout level for June run up.
Blog post dated: 07/08/2014: syncubate.com/blog/2014/7/8/tsla-resistance-overhead
Today's candle may be indicative of a temporary relief in selling pressure, as bulls swept in and bought the stock at the lows just under $215 to close for the day at $219.
If the overall markets continue to pullback, it will be interesting to see if the stock can hold the $210 area, as this was the breakout level for June run up.
Blog post dated: 07/08/2014: syncubate.com/blog/2014/7/8/tsla-resistance-overhead

免責事項
これらの情報および投稿は、TradingViewが提供または承認する金融、投資、取引、またはその他の種類の助言もしくは推奨であることを意図したものではなく、またこれらに該当するものでもありません。詳細は利用規約をご覧ください。
免責事項
これらの情報および投稿は、TradingViewが提供または承認する金融、投資、取引、またはその他の種類の助言もしくは推奨であることを意図したものではなく、またこれらに該当するものでもありません。詳細は利用規約をご覧ください。