
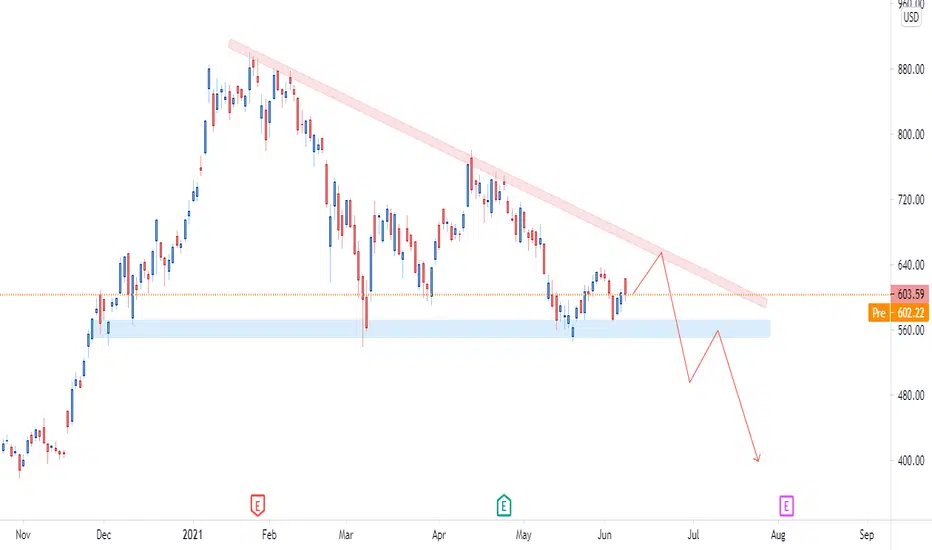
Here is our weekly outlook for Tesla stock. We can notice the descending triangle pattern right away from the first glance. The descending triangles usually indicate a bullish breakout. In our case the price is expected to hit down to 500$; however, this is most likely to be followed by a retest/correction at 550$. Overall, long-term our bias stays bullish on Tesla as they continue to open more factories; however, this doesn’t mean that we don’t monitor the market for better entries to our portfolio. If you’re looking to secure some profits and re-enter the trade a little further this is your sign to do so.

免責事項
これらの情報および投稿は、TradingViewが提供または承認する金融、投資、取引、またはその他の種類の助言もしくは推奨であることを意図したものではなく、またこれらに該当するものでもありません。詳細は利用規約をご覧ください。
免責事項
これらの情報および投稿は、TradingViewが提供または承認する金融、投資、取引、またはその他の種類の助言もしくは推奨であることを意図したものではなく、またこれらに該当するものでもありません。詳細は利用規約をご覧ください。