
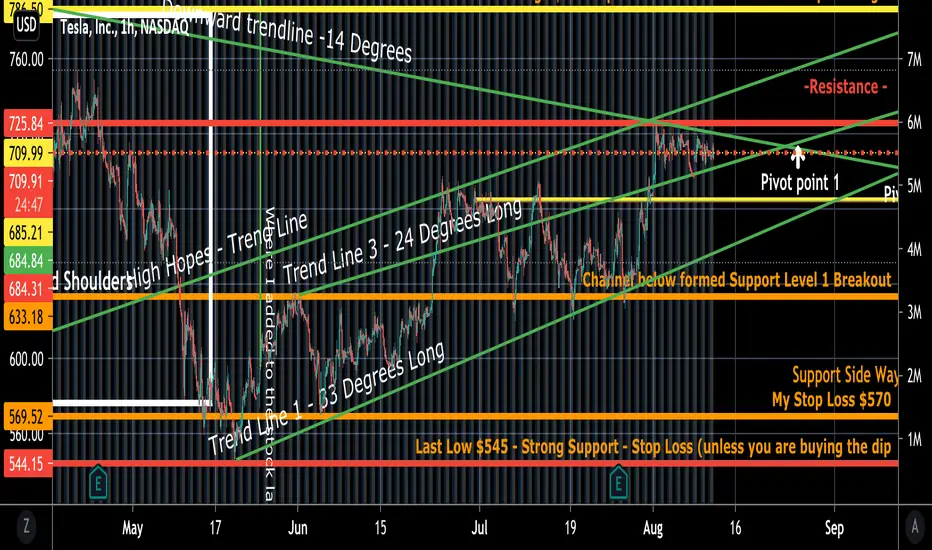
I entered the trade as shown on graph. From technical analysis we can see the neck and shoulders pattern directly before the price shot up. Using some graph theory maths I came to the following trendlines to fit data. Trendline 1 and 2 is both active lines over the medium term and looking at where they meet up, it looks like we hit that pivot point today but lets look if the momentum can be sustained so that the price is as close to pivot point 1 and 2 if not higher.
My Stop loss is indicated at $570 Personally , the lowest it should be is $545 and we are looking at taking profit above both trendlines at. $784
However if you don't mind risk and patience, I'm sure tesla will be over $1000 in probably less than a year.
Please view full graph for all levels and line explanations. With the last few days move on crypto you could expect Tesla shares to start showing the correlation more soon.
My Stop loss is indicated at $570 Personally , the lowest it should be is $545 and we are looking at taking profit above both trendlines at. $784
However if you don't mind risk and patience, I'm sure tesla will be over $1000 in probably less than a year.
Please view full graph for all levels and line explanations. With the last few days move on crypto you could expect Tesla shares to start showing the correlation more soon.

免責事項
これらの情報および投稿は、TradingViewが提供または承認する金融、投資、取引、またはその他の種類の助言もしくは推奨であることを意図したものではなく、またこれらに該当するものでもありません。詳細は利用規約をご覧ください。
免責事項
これらの情報および投稿は、TradingViewが提供または承認する金融、投資、取引、またはその他の種類の助言もしくは推奨であることを意図したものではなく、またこれらに該当するものでもありません。詳細は利用規約をご覧ください。