
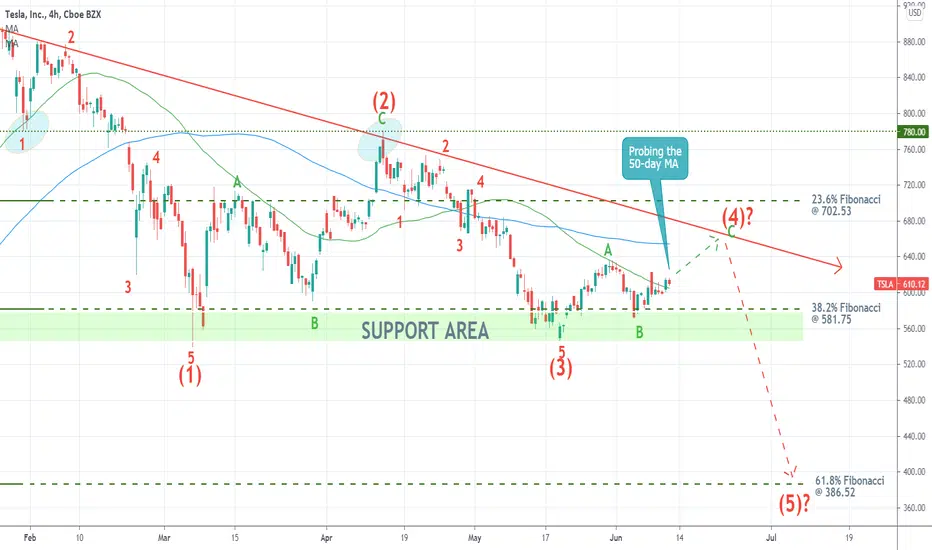
Tesla's shares are currently consolidating above the 38.2 per cent Fibonacci retracement level at 581.75.
Given the expectations of the Elliott Wave Theory, the price action could establish another upswing towards the descending trend line (in red). This would represent the second retracement leg (3-4) of the broader pattern.
A potential reversal from the trend line could entail a likely dropdown towards the 61.8 per cent Fibonacci retracement at 386.52. This would manifest the final impulse leg (4-5).
Given the expectations of the Elliott Wave Theory, the price action could establish another upswing towards the descending trend line (in red). This would represent the second retracement leg (3-4) of the broader pattern.
A potential reversal from the trend line could entail a likely dropdown towards the 61.8 per cent Fibonacci retracement at 386.52. This would manifest the final impulse leg (4-5).

関連の投稿
免責事項
これらの情報および投稿は、TradingViewが提供または承認する金融、投資、取引、またはその他の種類の助言もしくは推奨であることを意図したものではなく、またこれらに該当するものでもありません。詳細は利用規約をご覧ください。
免責事項
これらの情報および投稿は、TradingViewが提供または承認する金融、投資、取引、またはその他の種類の助言もしくは推奨であることを意図したものではなく、またこれらに該当するものでもありません。詳細は利用規約をご覧ください。