
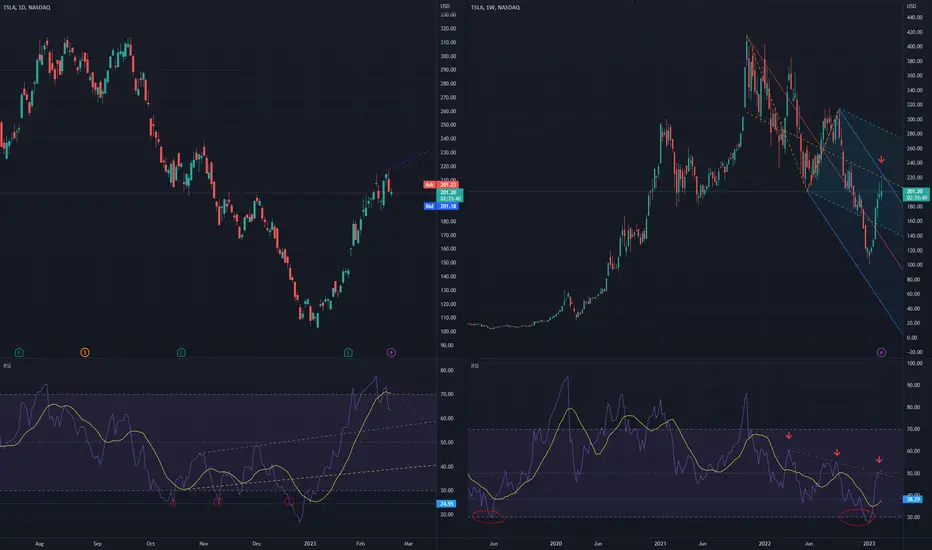
On weekly chart the price (almost) reached both the solid blue top pitchfork line and the middle orange pitchfork lines. Additionally, weekly RSI reached the dotted green resistance trendline. These are all bearish signs.
On daily chart, RSI has a bearish head-and-shoulders pattern and there is also a divergence between RSI (with purple trendline pointing downwards) and the PRICE (the purple trendline poingint upwards). Again, these are bearsih signs.
My previous TSLA idea was bullish and it went up 54% (from 137.80 to 212.11 when I gave the close signal), see related idea.
On daily chart, RSI has a bearish head-and-shoulders pattern and there is also a divergence between RSI (with purple trendline pointing downwards) and the PRICE (the purple trendline poingint upwards). Again, these are bearsih signs.
My previous TSLA idea was bullish and it went up 54% (from 137.80 to 212.11 when I gave the close signal), see related idea.
トレード終了: 利益確定目標に到達
TSLA went down 16% (from 201.20 to 173.50). Now it seems ready to go up again, see related idea.
Join free discord.gg/wDTkRnS or t.me/TradersForecast
関連の投稿
免責事項
これらの情報および投稿は、TradingViewが提供または承認する金融、投資、取引、またはその他の種類の助言もしくは推奨であることを意図したものではなく、またこれらに該当するものでもありません。詳細は利用規約をご覧ください。
Join free discord.gg/wDTkRnS or t.me/TradersForecast
関連の投稿
免責事項
これらの情報および投稿は、TradingViewが提供または承認する金融、投資、取引、またはその他の種類の助言もしくは推奨であることを意図したものではなく、またこれらに該当するものでもありません。詳細は利用規約をご覧ください。