
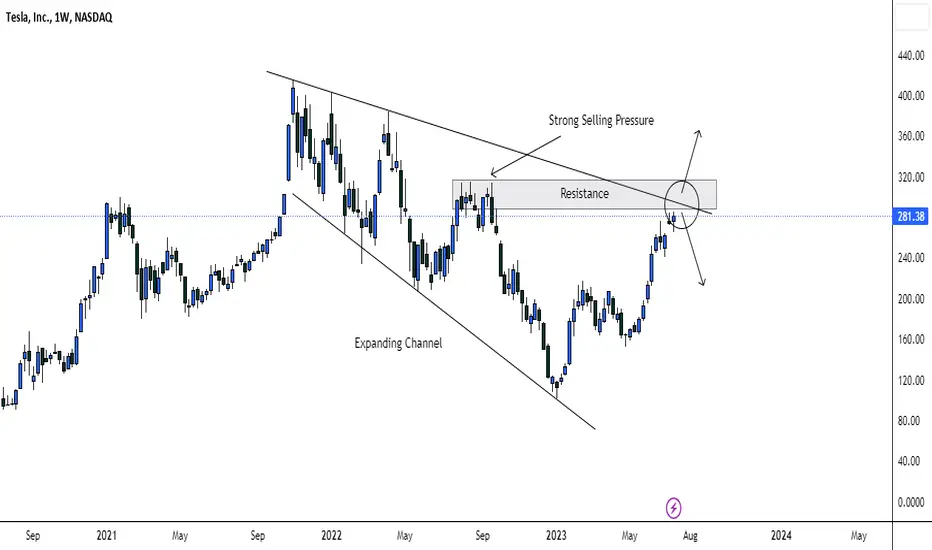
TSLA is currently exhibiting a prominent expanding channel on the weekly timeframe. The price is nearing the weekly resistance, which also coincides with the upper boundary of the expanding channel. At this juncture, two scenarios are possible. Firstly, if the price adheres to the resistance level and the upper boundary, we can anticipate a downward movement, leading to a potential market downturn. Conversely, should the price exhibit a bullish breakout above the resistance and upper boundary, we can expect the rally to continue with renewed momentum.

関連の投稿
免責事項
これらの情報および投稿は、TradingViewが提供または承認する金融、投資、取引、またはその他の種類の助言もしくは推奨であることを意図したものではなく、またこれらに該当するものでもありません。詳細は利用規約をご覧ください。
免責事項
これらの情報および投稿は、TradingViewが提供または承認する金融、投資、取引、またはその他の種類の助言もしくは推奨であることを意図したものではなく、またこれらに該当するものでもありません。詳細は利用規約をご覧ください。