
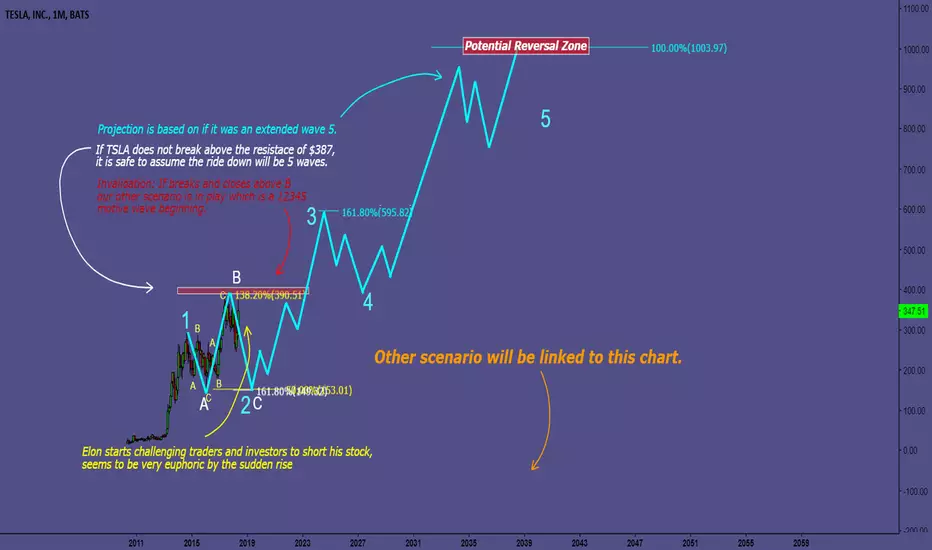
Elliot Wave analysis of TSLA stock pt.1, this chart is based solely on technicals and not fundamentals (Besides me noting that Elon is getting euphoric)
It seems we might be in a Expanding flat correction, where B wave goes above A wave by 1.236 - 1.382%, the substructure for this is a bit hard to count since it stopped at 1.618x of the preceding impulse wave, however this can either be a zig-zag to the upside (5-3-5) or a (2) of 3 (5-3-5). We are at a decision point on the monthly so price action should show us the right direction fairly soon, if we fail to break and close above the 1.382% this scenario is more likely; especially if we start to make New Structure Lows and Lower Highs. You can start counting along if you are familiar in EWT - This would be a 5 wave descent (3-3-5). Our target zone would be somewhere in the area of $150.
Entry: $340-$390
S/L: $420
T/P: $150
It seems we might be in a Expanding flat correction, where B wave goes above A wave by 1.236 - 1.382%, the substructure for this is a bit hard to count since it stopped at 1.618x of the preceding impulse wave, however this can either be a zig-zag to the upside (5-3-5) or a (2) of 3 (5-3-5). We are at a decision point on the monthly so price action should show us the right direction fairly soon, if we fail to break and close above the 1.382% this scenario is more likely; especially if we start to make New Structure Lows and Lower Highs. You can start counting along if you are familiar in EWT - This would be a 5 wave descent (3-3-5). Our target zone would be somewhere in the area of $150.
Entry: $340-$390
S/L: $420
T/P: $150
ノート
pt.2: 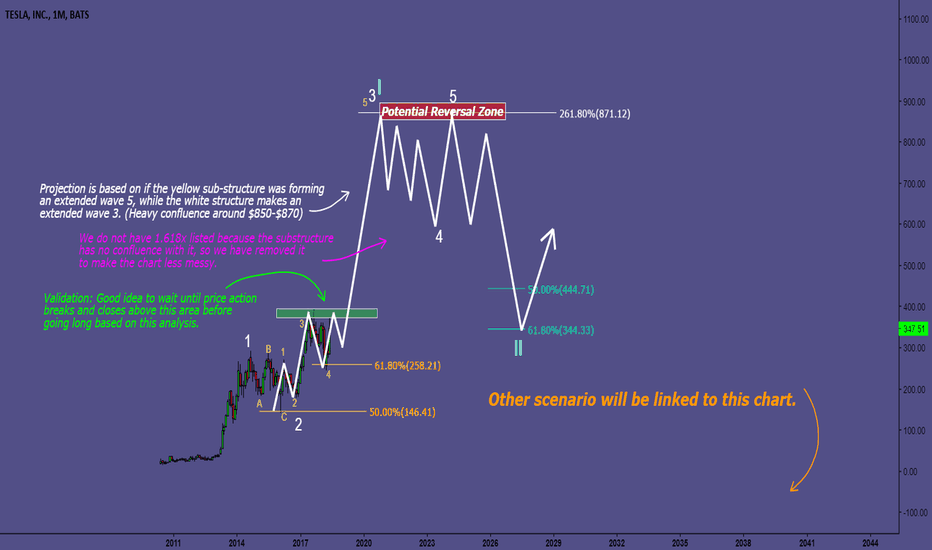
トレード稼働中
トレード稼働中
Still targeting $150.
免責事項
これらの情報および投稿は、TradingViewが提供または承認する金融、投資、取引、またはその他の種類の助言もしくは推奨であることを意図したものではなく、またこれらに該当するものでもありません。詳細は利用規約をご覧ください。
免責事項
これらの情報および投稿は、TradingViewが提供または承認する金融、投資、取引、またはその他の種類の助言もしくは推奨であることを意図したものではなく、またこれらに該当するものでもありません。詳細は利用規約をご覧ください。