
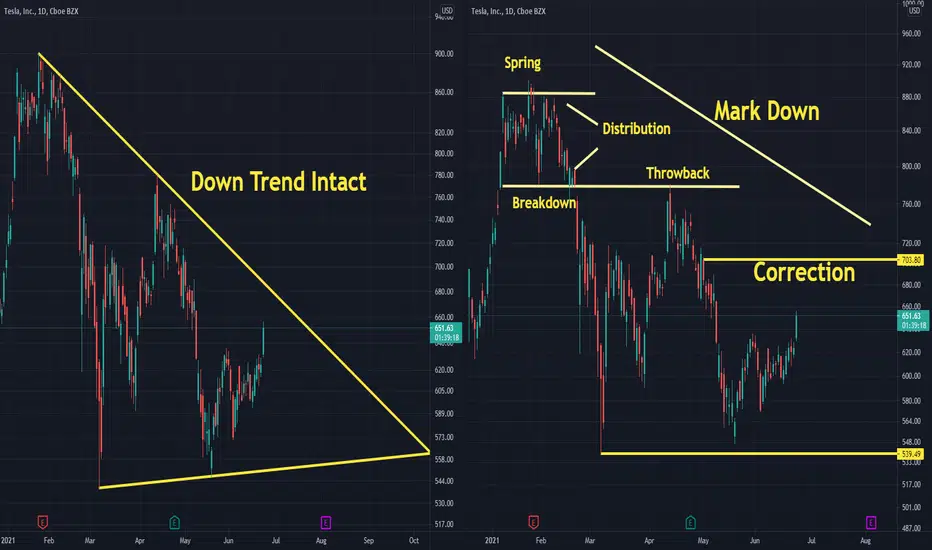
I have nothing to say, just read the article and see how many similarities exist.
I think the Tesla chart is Identical to the example chart in the article: Making Money The Wyckoff Way (CSC, DNR)
Link: https://www.investopedia.com/articles/active-trading/070715/making-money-wyckoff-way.asp
I will not surprised if tesla tests 690-700 and experience another leg down.
Moshkelgosha
I think the Tesla chart is Identical to the example chart in the article: Making Money The Wyckoff Way (CSC, DNR)
Link: https://www.investopedia.com/articles/active-trading/070715/making-money-wyckoff-way.asp
I will not surprised if tesla tests 690-700 and experience another leg down.
Moshkelgosha

Use the following link to access trading ideas: patreon.com/SniperTraderStocks?utm_medium=unknown&utm_source=join_link&utm_campaign=creatorshare_creator&utm_content=copyLink
免責事項
これらの情報および投稿は、TradingViewが提供または承認する金融、投資、取引、またはその他の種類の助言もしくは推奨であることを意図したものではなく、またこれらに該当するものでもありません。詳細は利用規約をご覧ください。
Use the following link to access trading ideas: patreon.com/SniperTraderStocks?utm_medium=unknown&utm_source=join_link&utm_campaign=creatorshare_creator&utm_content=copyLink
免責事項
これらの情報および投稿は、TradingViewが提供または承認する金融、投資、取引、またはその他の種類の助言もしくは推奨であることを意図したものではなく、またこれらに該当するものでもありません。詳細は利用規約をご覧ください。