
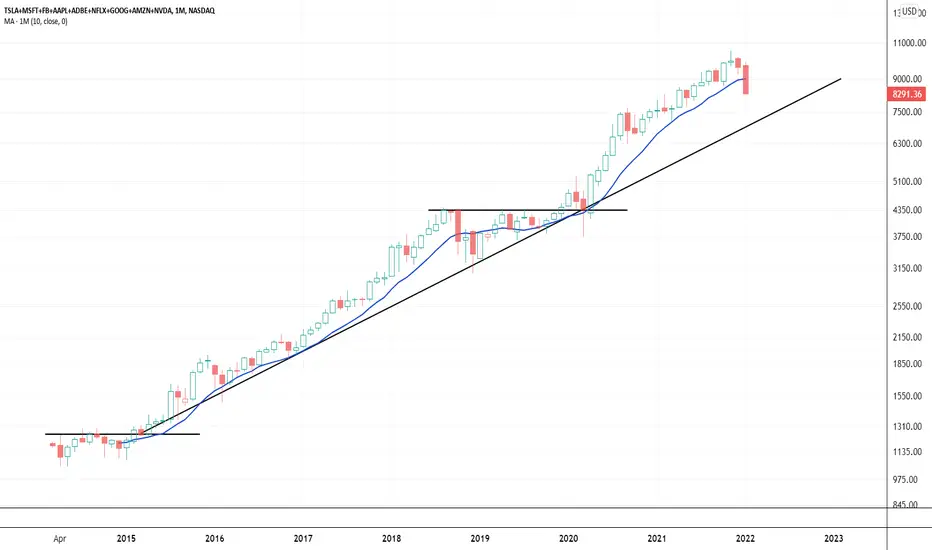
This is a monthly candle chart of the FANG complex. The last time the group had a monthly close below it's 10 Month moving average it traded back down towards its trend line. The stocks traded down for about 5 months and consolidated for another 8 months, when looking at them as a group. If you have a 401K, IRA, and 529 plans consider how much exposure you have to this mix. The complex could fall quite a bit and not break the long term up trend. Considering the month isn't over quite yet this chart is premature. I figured it was an interesting look none the less.
Thoughts, feelings, ideas?
Here's the link to the watch list:
tradingview.com/watchlists/62522214/
Thoughts, feelings, ideas?
Here's the link to the watch list:
tradingview.com/watchlists/62522214/

免責事項
これらの情報および投稿は、TradingViewが提供または承認する金融、投資、取引、またはその他の種類の助言もしくは推奨であることを意図したものではなく、またこれらに該当するものでもありません。詳細は利用規約をご覧ください。
免責事項
これらの情報および投稿は、TradingViewが提供または承認する金融、投資、取引、またはその他の種類の助言もしくは推奨であることを意図したものではなく、またこれらに該当するものでもありません。詳細は利用規約をご覧ください。