
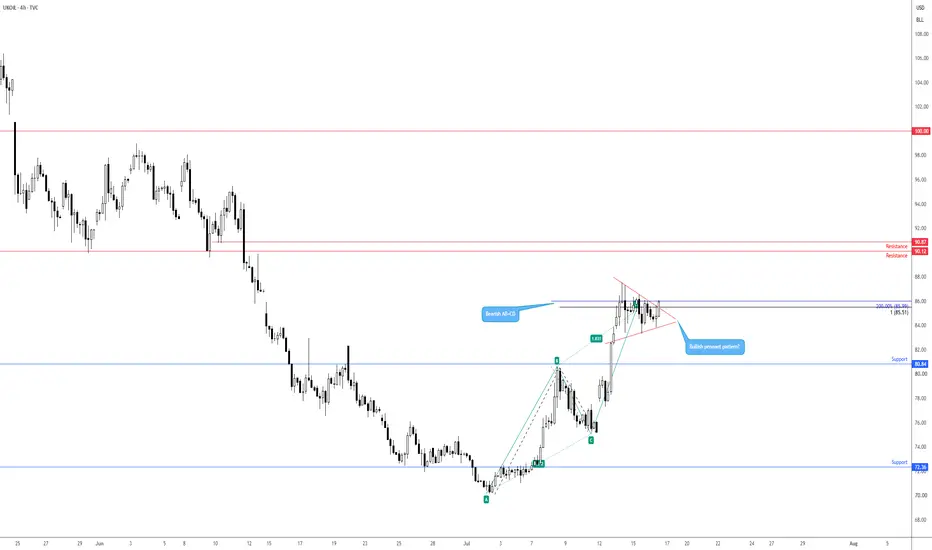
With Middle East flare-ups still front and centre and geopolitical risk premium being priced into oil, the technical picture on Brent crude right now shows a potential breakout brewing.
As shown in the chart, between US$87.55 and US$83.32, we have seen price build out a pennant pattern, with the unit not far from the formation’s apex and looking about ready to burst. Price is now on the verge of breaking out higher, perhaps clearing the path for a run towards a resistance zone between US$90.87 and US$90.12.
I do want to note that while the pennant formation is considered a bullish continuation pattern, we also have a bearish AB=CD configuration around US$85.50. However, sellers have been reluctant to commit here so far, adding weight to a breakout north.
Written by FP Markets Chief Market Analyst Aaron Hill
As shown in the chart, between US$87.55 and US$83.32, we have seen price build out a pennant pattern, with the unit not far from the formation’s apex and looking about ready to burst. Price is now on the verge of breaking out higher, perhaps clearing the path for a run towards a resistance zone between US$90.87 and US$90.12.
I do want to note that while the pennant formation is considered a bullish continuation pattern, we also have a bearish AB=CD configuration around US$85.50. However, sellers have been reluctant to commit here so far, adding weight to a breakout north.
Written by FP Markets Chief Market Analyst Aaron Hill
ノート
Price breaking out to the upside at the apex - AH
免責事項
これらの情報および投稿は、TradingViewが提供または承認する金融、投資、取引、またはその他の種類の助言もしくは推奨であることを意図したものではなく、またこれらに該当するものでもありません。詳細は利用規約をご覧ください。
免責事項
これらの情報および投稿は、TradingViewが提供または承認する金融、投資、取引、またはその他の種類の助言もしくは推奨であることを意図したものではなく、またこれらに該当するものでもありません。詳細は利用規約をご覧ください。