
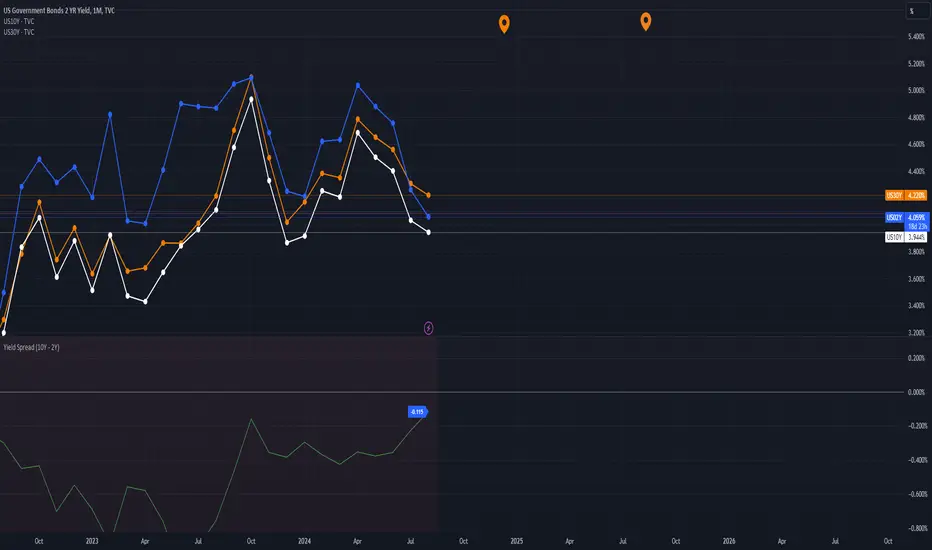
This chart tracks U.S. Treasury yields for 2-year (blue), 10-year (white), and 30-year (orange) bonds, along with the yield spread (green) between the 10-year and 2-year bonds. A positive spread suggests a normal yield curve and economic growth, while a negative spread (inversion) often signals a potential recession.

免責事項
これらの情報および投稿は、TradingViewが提供または承認する金融、投資、取引、またはその他の種類の助言もしくは推奨であることを意図したものではなく、またこれらに該当するものでもありません。詳細は利用規約をご覧ください。
免責事項
これらの情報および投稿は、TradingViewが提供または承認する金融、投資、取引、またはその他の種類の助言もしくは推奨であることを意図したものではなく、またこれらに該当するものでもありません。詳細は利用規約をご覧ください。