USDCHF - Supply Zone in FocusUSDCHF is currently trading around a strong supply zone, where sellers have previously stepped in and rejected higher prices. 📉
Price is now testing this key resistance area while still trading above the last minor low marked in blue.
📌 As long as the supply zone continues to hold, we will be looking for trend-following short setups.
However, for the bears to fully take control and activate the sell scenario, a break below the last minor low marked in blue is needed. Such a breakdown would confirm bearish momentum and increase the probability of a deeper decline.
As always, rather than selling blindly into resistance, we will wait for bearish confirmation before considering any short positions.
Will sellers defend this supply zone and regain control, or will buyers force another breakout? 🤔
⚠️ Disclaimer: This is not financial advice. Always do your own research and manage risk properly.
📚 Stick to your trading plan regarding entries, risk, and management.
Good luck! 🍀
All Strategies Are Good; If Managed Properly!
~Richard Nasr
Bearish Patterns
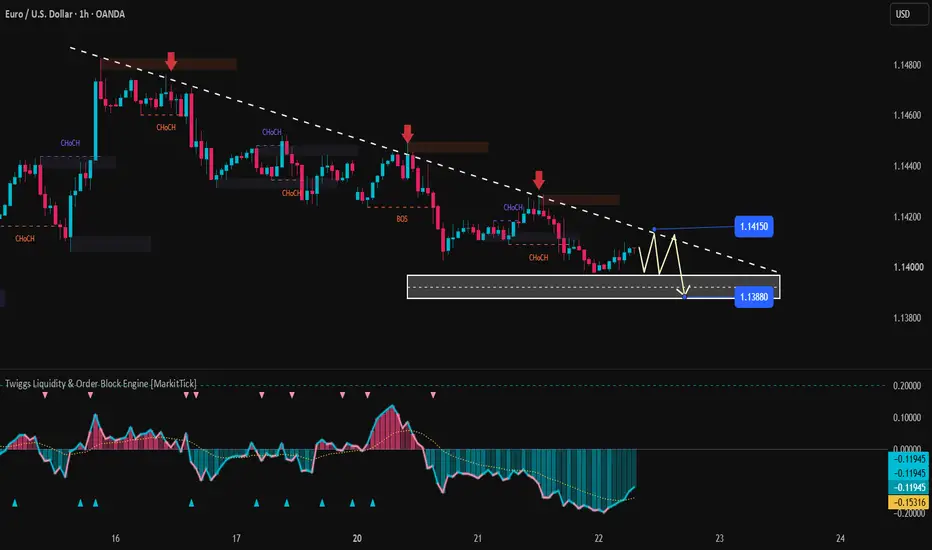
EURUSD: Sellers Continue to Defend the 1.1415 LevelEURUSD maintains a bearish trend on the H1 timeframe, consistently forming lower highs beneath the downtrend line. Selling pressure emerges quickly whenever the price rallies toward the 1.1415 zone, indicating that this area remains a key resistance level and that sellers retain the upper hand.
Fundamentally, the US dollar remains supported by expectations that the Fed will keep interest rates high, while the market awaits the outcome of the ECB meeting. Divergent monetary policy expectations continue to weigh on the euro, suggesting that current rallies are likely merely corrective moves within the broader downtrend.
The preferred scenario is to wait for the price to retest the 1.1415 level and show a clear signal of rejection. If sellers successfully defend this area, EURUSD could decline toward the 1.1388 support zone, where buying interest is expected to emerge.
Strategy: Prioritize selling (short positions) if a bearish reversal signal appears at 1.1415, targeting 1.1388. The bearish scenario would be invalidated if the price closes above 1.1415 on the H1 timeframe.
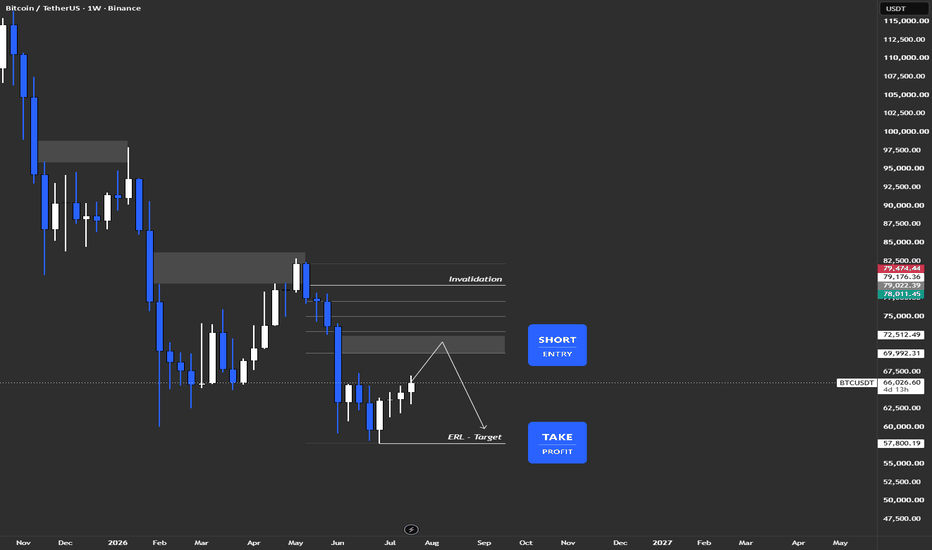
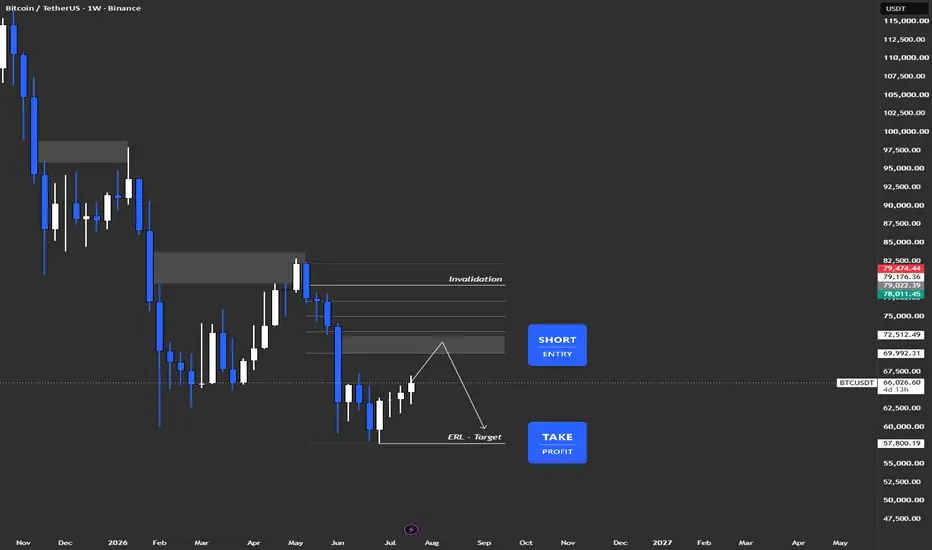
Bitcoin - Weekly - Higher Time Frame TargetSellers own this range.
Price is trading below the May distribution. Every rally since has been sold into a lower high.
The zone at 70,000–72,500 is unmitigated. That is where I want to be short.
The trade
Short into 70,000–72,500.
Invalidation above 79,474.
ERL target at 57,800.
The logic
The low at 57,800 is untouched liquidity. It is the obvious draw.
A retrace into the supply zone is the entry, not a reason to turn bullish.
If price accepts above 79,474, this idea is wrong and I stand down.
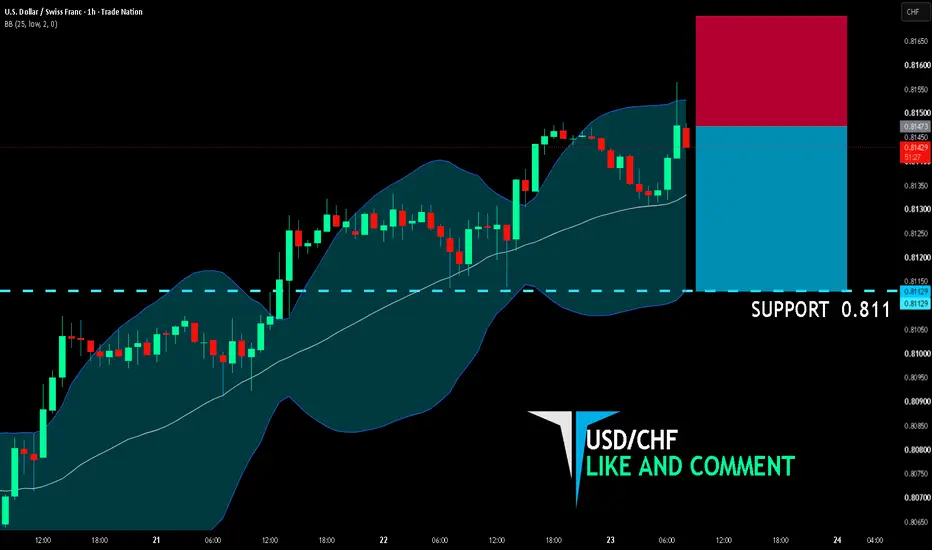
USD/CHF SELLERS WILL DOMINATE THE MARKET|SHORT
USD/CHF SIGNAL
Trade Direction: short
Entry Level: 0.814
Target Level: 0.811
Stop Loss: 0.817
RISK PROFILE
Risk level: medium
Suggested risk: 1%
Timeframe: 1h
Disclosure: I am part of Trade Nation's Influencer program and receive a monthly fee for using their TradingView charts in my analysis.
✅LIKE AND COMMENT MY IDEAS✅
USD/CAD BEARS ARE GAINING STRENGTH|SHORT
Hello, Friends!
USD/CAD is trending down which is evident from the red colour of the previous weekly candle. However, the price has locally surged into the overbought territory. Which can be told from its proximity to the BB upper band. Which presents a beautiful trend following opportunity for a short trade from the resistance line above towards the demand level of 1.399.
Disclosure: I am part of Trade Nation's Influencer program and receive a monthly fee for using their TradingView charts in my analysis.
✅LIKE AND COMMENT MY IDEAS✅
EUR/USD SHORT FROM RESISTANCE
EUR/USD SIGNAL
Trade Direction: short
Entry Level: 1.140
Target Level: 1.139
Stop Loss: 1.142
RISK PROFILE
Risk level: medium
Suggested risk: 1%
Timeframe: 1h
Disclosure: I am part of Trade Nation's Influencer program and receive a monthly fee for using their TradingView charts in my analysis.
✅LIKE AND COMMENT MY IDEAS✅
AUD/CAD BEARS WILL DOMINATE THE MARKET|SHORT
Hello, Friends!
We are targeting the 0.981 level area with our short trade on AUD/CAD which is based on the fact that the pair is overbought on the BB band scale and is also approaching a resistance line above thus going us a good entry option.
Disclosure: I am part of Trade Nation's Influencer program and receive a monthly fee for using their TradingView charts in my analysis.
✅LIKE AND COMMENT MY IDEAS✅
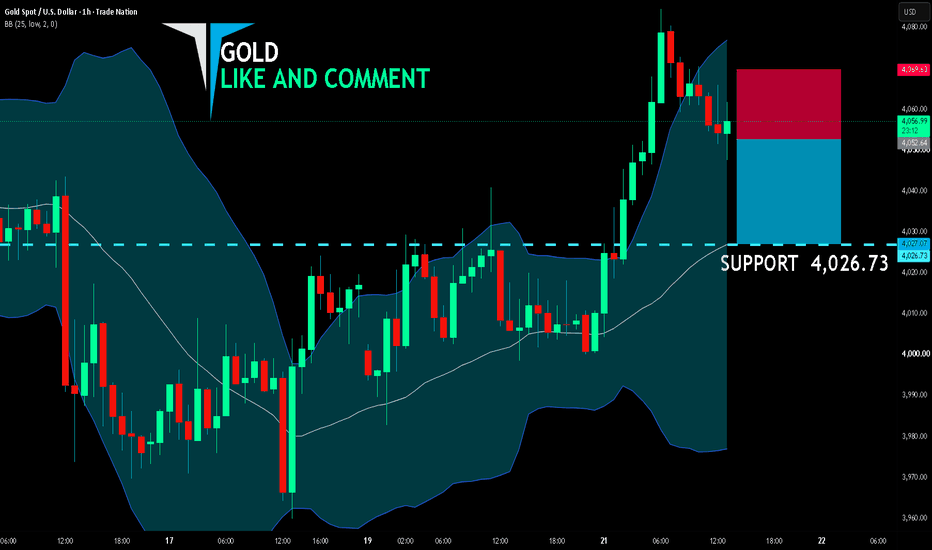
GOLD SENDS CLEAR BEARISH SIGNALS|SHORT
GOLD SIGNAL
Trade Direction: short
Entry Level: 4,052.64
Target Level: 4,026.73
Stop Loss: 4,069.63
RISK PROFILE
Risk level: medium
Suggested risk: 1%
Timeframe: 1h
Disclosure: I am part of Trade Nation's Influencer program and receive a monthly fee for using their TradingView charts in my analysis.
✅LIKE AND COMMENT MY IDEAS✅
GBP/JPY BEARS WILL DOMINATE THE MARKET|SHORT
Hello, Friends!
Previous week’s green candle means that for us the GBP/JPY pair is in the uptrend. And the current movement leg was also up but the resistance line will be hit soon and upper BB band proximity will signal an overbought condition so we will go for a counter-trend short trade with the target being at 217.678.
Disclosure: I am part of Trade Nation's Influencer program and receive a monthly fee for using their TradingView charts in my analysis.
✅LIKE AND COMMENT MY IDEAS✅
Palantir (PLTR) more downside. "Palantir isn't broken fundamentally—but technically it's still trapped in a bearish channel. Until buyers reclaim the upper trendline, every rally looks like a lower high. The chart is pointing toward one final flush into the $90 support zone, where risk-reward could become much more attractive for long-term investors.
AUD/USD BEARISH BIAS RIGHT NOW| SHORT
Hello, Friends!
AUD/USD pair is in the uptrend because previous week’s candle is green, while the price is obviously rising on the 4H timeframe. And after the retest of the resistance line above I believe we will see a move down towards the target below at 0.696 because the pair overbought due to its proximity to the upper BB band and a bearish correction is likely.
Disclosure: I am part of Trade Nation's Influencer program and receive a monthly fee for using their TradingView charts in my analysis.
✅LIKE AND COMMENT MY IDEAS✅
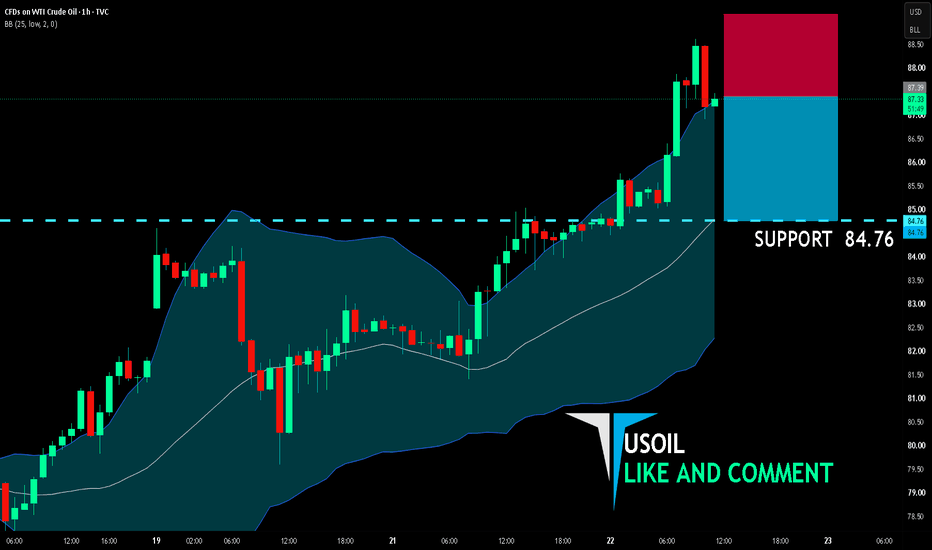
USOIL BEST PLACE TO SELL FROM|SHORT
USOIL SIGNAL
Trade Direction: short
Entry Level: 87.39
Target Level: 84.76
Stop Loss: 89.13
RISK PROFILE
Risk level: medium
Suggested risk: 1%
Timeframe: 1h
Disclosure: I am part of Trade Nation's Influencer program and receive a monthly fee for using their TradingView charts in my analysis.
✅LIKE AND COMMENT MY IDEAS✅
AUD/CHF BEARS ARE STRONG HERE|SHORT
Hello, Friends!
AUD/CHF pair is trading in a local uptrend which we know by looking at the previous 1W candle which is green. On the 4H timeframe the pair is going up too. The pair is overbought because the price is close to the upper band of the BB indicator. So we are looking to sell the pair with the upper BB line acting as resistance. The next target is 0.565 area.
Disclosure: I am part of Trade Nation's Influencer program and receive a monthly fee for using their TradingView charts in my analysis.
✅LIKE AND COMMENT MY IDEAS✅
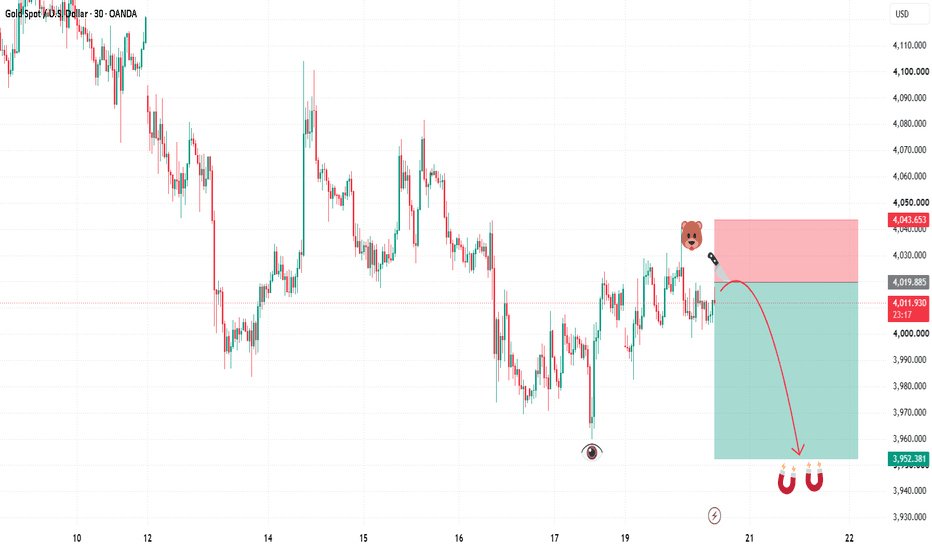
XAUUSD H1 | SMC Sell Setup | Premium Zone RejectionGold remains in a bearish market structure on the H1 timeframe after rejecting a key premium supply zone. Price has swept liquidity above previous highs and is now approaching a bearish order block, where sellers may regain control.
This analysis is based on Smart Money Concepts (SMC), combining market structure, liquidity, order blocks, Fair Value Gap (FVG), and EMA trend confirmation. A bearish continuation becomes more probable if price rejects the highlighted resistance area and confirms with a Change of Character (CHoCH) followed by a Break of Structure (BOS).
Trading Plan
Bias: Bearish
Entry: Rejection from the Bearish Order Block / FVG
Invalidation (SL): Above the Premium Supply Zone
TP1: First support level
TP2: Previous swing low
TP3: Major demand zone
This analysis is shared for educational purposes and reflects my personal market view. Always wait for confirmation before entering a trade and follow proper risk management. Markets are probabilistic, not guaranteed.
If you found this analysis helpful, don't forget to Boost 👍, leave a comment, and follow SadaChartLab for more professional SMC trade ideas and educational market analysis.
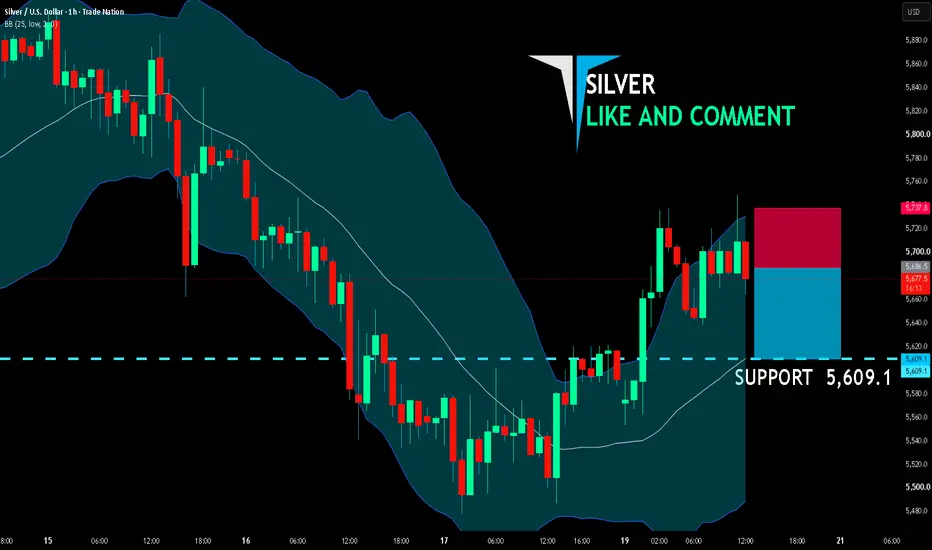
SILVER BEST PLACE TO SELL FROM|SHORT
SILVER SIGNAL
Trade Direction: short
Entry Level: 5,686.5
Target Level: 5,609.1
Stop Loss: 5,737.8
RISK PROFILE
Risk level: medium
Suggested risk: 1%
Timeframe: 1h
Disclosure: I am part of Trade Nation's Influencer program and receive a monthly fee for using their TradingView charts in my analysis.
✅LIKE AND COMMENT MY IDEAS✅
NZDCAD - Major Resistance Back in FocusNZDCAD is approaching a high-confluence resistance area, where multiple technical factors are coming together. 📊
Price is currently retesting the intersection of:
• The upper bound of the rising red triangle.
• The previous major highs, which have repeatedly acted as resistance.
📌 As long as this confluence continues to hold, we will be looking for trend-following short setups, anticipating another rejection from this key resistance area.
As always, rather than selling blindly into resistance, we will wait for bearish confirmation before considering any short positions.
Will sellers defend this confluence once again and trigger the next move lower? 🤔
⚠️ Disclaimer: This is not financial advice. Always do your own research and manage risk properly.
📚 Stick to your trading plan regarding entries, risk, and management.
Good luck! 🍀
All Strategies Are Good; If Managed Properly!
~Richard Nasr
AUD/USD BEARS ARE STRONG HERE|SHORT
Hello, Friends!
Previous week’s green candle means that for us the AUD/USD pair is in the uptrend. And the current movement leg was also up but the resistance line will be hit soon and upper BB band proximity will signal an overbought condition so we will go for a counter-trend short trade with the target being at 0.694.
Disclosure: I am part of Trade Nation's Influencer program and receive a monthly fee for using their TradingView charts in my analysis.
✅LIKE AND COMMENT MY IDEAS✅
NZD/USD SHORT FROM RESISTANCE
NZD/USD SIGNAL
Trade Direction: short
Entry Level: 0.584
Target Level: 0.583
Stop Loss: 0.585
RISK PROFILE
Risk level: medium
Suggested risk: 1%
Timeframe: 1h
Disclosure: I am part of Trade Nation's Influencer program and receive a monthly fee for using their TradingView charts in my analysis.
✅LIKE AND COMMENT MY IDEAS✅
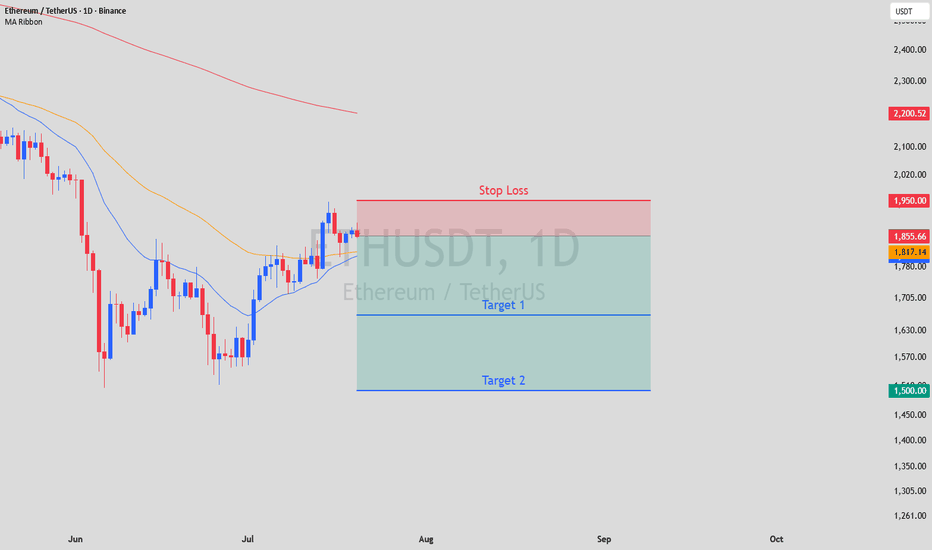
Bullish EMA Cross Trapped Under the 200: Fading the Bear RallyBINANCE:ETHUSDT
The 20 EMA just crossed above the 50 EMA on the daily — normally a bullish signal. But context kills it. Price is printing this crossover ~17% below the 200 EMA ($2,200), deep inside a macro downtrend that's been in control since late April.
This is a bear rally, not a trend reversal.
📍 Setup:
After dropping from $2,700 to $1,500 in May–June, ETH bounced sharply. The 20/50 crossover confirms short-term momentum — but it's happening under heavy overhead resistance with the 200 EMA acting as a ceiling miles above.
📍 Entry: $1,855 (current price, rejection zone)
🛑 Stop Loss: $1,950 (above recent swing high)
🎯 TP1: $1,665 (2:1 R:R)
🎯 TP2: $1,500 (June lows retest)
📊 Risk-to-Reward: 1:2 — 1:3.7
Why I'm bearish despite the crossover:
The 200 EMA at $2,200 is the trend filter — price isn't even close. The June bounce recovered 50% of the drop but stalled at $1,900 resistance. Volume is thinning on the push higher. Bullish crossovers under the 200 EMA have a high failure rate in macro downtrends — they trap longs before the next leg down.
Key support to watch: $1,750 (consolidation) → $1,500 (June low) → $1,380 if the floor breaks.
What's your read — relief rally or genuine reversal? Drop your analysis below. 👇
⚠️ Not financial advice. Always manage your risk.
EUR/USD SENDS CLEAR BEARISH SIGNALS|SHORT
Hello, Friends!
EUR-USD uptrend evident from the last 1W green candle makes short trades more risky, but the current set-up targeting 1.137 area still presents a good opportunity for us to sell the pair because the resistance line is nearby and the BB upper band is close which indicates the overbought state of the EUR/USD pair.
Disclosure: I am part of Trade Nation's Influencer program and receive a monthly fee for using their TradingView charts in my analysis.
✅LIKE AND COMMENT MY IDEAS✅