HOW-TO: When one CYPHER mark is enough, and when to waitOne week of BTC 15m, 20–25 Aug 2026, all four cores on. What each mark did, straight from its telemetry: hover the same marks on your own chart with CYPHER and you get the same numbers.
▌ THE SCALP · 20 AUG
Two Market Pulse shorts near 72,000, around 13:00 and at 14:15. The second: 71,924, score 99, boost 6.1. 1.2% in favour on the very next candle, and that was the whole move: the trend then ran 10.6% the other way within 100 candles. A scalp, not a hold.
▌ TWO CORES, ONE TOP · 21 AUG
0
Cypher
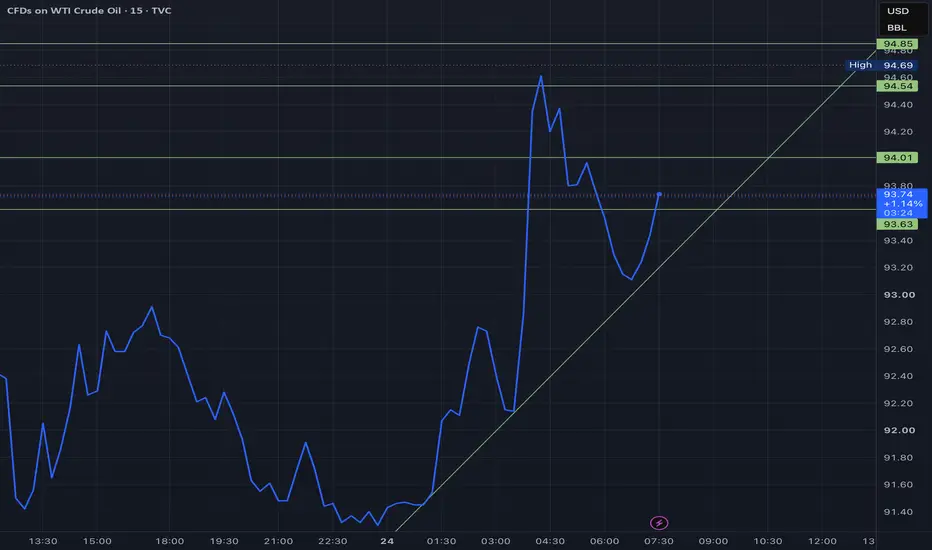
USOIL RadarThis is what the mornings radar for USOIL looks like. $93.63 is a crucial monthly support level for this Fibonacci Volatility Cipher. Bouncing above the line. Looks very bullish. These price levels are long-term, and this chart is long-term. $200 is completely reasonable under this financial model. If you zoom out and look upwards on the chart, you will cleanly notice monthly steps upwards that are expected to gain logarithmically for the next cycle.
XMR is at the lineXMR is at the waterline.
From Claude:
XMR/USD — Retesting the Line: Bounce or Breakdown?
Monero broke above this rising trendline around Sept 18–19, ran to a local double-top near $585–600, then spiked to $633.90 on the 21st before pulling back. Price is now sitting right back on that same line at $569 — a textbook breakout retest. Former resistance either holds as new support here, or it doesn't.
Bull case: Funding rate just hit its highest level since Sept 4, and open interest rose 18% (~$
USOIL — Retesting the Line After a Violent Round-TripUSOIL — Retesting the Line After a Violent Round-Trip
WTI spiked from $74.24 to a high of $106.75 in about two weeks (Hormuz/Iran ceasefire-headline driven), then crashed back down just as fast. Price is now sitting almost exactly on the rising trendline off the July low — the same "does former structure hold" question as XMR, just with a much bigger, faster round-trip behind it.
Bull case: LAZY Pro's WaveTrend has crossed bearish but isn't at an oversold extreme yet, and price is still sittin
DXY HAS BEEN LOCKED UPThe dollar is safely contained and constrained inside the conjoined triangles of success. There is nowhere for it to run, there is nowhere for it to hide. Time to pay the piper. You don't get to dine and dash on my cognitive labor every day for decades without paying for it somehow, folks.
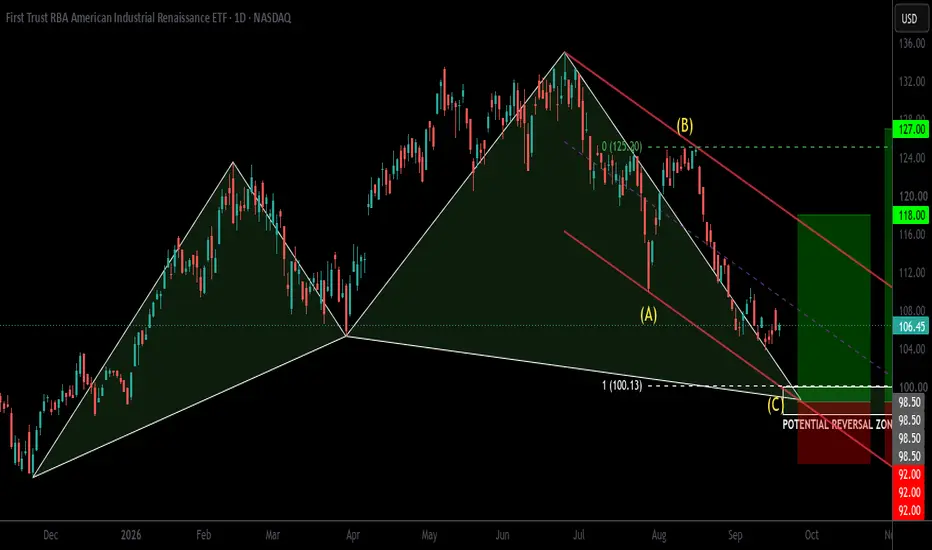
AIRR — Bullish Cypher + Elliott Wave ABC CorrectionAIRR is approaching an important confluence zone between $98.50 and $100.00, where the Bullish Cypher Potential Reversal Zone lines up with the projected completion of an Elliott Wave ABC correction.
Price has been moving lower inside a corrective channel, which gives the current decline the structure of a possible ABC correction. What makes this setup interesting is that the projected Wave C is ending near the PRZ, while the 1:1 extension from Wave A to Wave C also lines up with this same area
BTC/USDT Official Trading Plan BTC/USDT Official Trading Plan
1. Trading Instrument
BTC/USDT
2. Analysis Timeframe
30M Intermediate trading timeframe
3. Entry Level
Go long near the current market price at 76870.00
4. Hard Stop Loss
Fixed stop loss placed at 76700.00
No averaging down, no holding position after stop loss trigger.
5. Take Profit & Position Management Rules
TP1 Primary Target: 77800.00
Close 50% of total position, trail stop loss upward immediately to lock floating profit.
TP2 Secondary Target: 785
SMR: Bullish Cypher Setting Up on the Weekly ChartSMR is approaching an interesting area on the weekly chart, where a Bullish Cypher Harmonic Pattern is completing.
This chart is plotted on a LOG SCALE, which is important when looking at the larger price targets and percentage moves.
The Setup
The Potential Reversal Zone (PRZ) is around the $3 mark
If price reacts positively from this area, I’ll be watching for a bullish reversal and confirmation that the Cypher is working.
Entry: Around $3-3.50.
Invalidation: Below $1.88
Upside Targets
Pfizer’s Cypher Setup: The Yellow Trend Line Could Hold the Key Pfizer is approaching one of the most technically important areas on its long-term monthly chart.
The setup is built around a bullish Cypher harmonic pattern, with the projected completion occurring inside a major potential reversal zone around the $17.50 area. But the harmonic pattern is only part of the story.
The real significance of this chart may be the long-term yellow trend line.
## The Yellow Trend Line: A Decades-Long Technical Battlefield
The yellow trend line is not simply another
CIFR Short This Week — $15.5 TargetCIFR (Cipher Digital) builds and operates industrial-scale data centers, moving from bitcoin mining into HPC hosting for large AI and compute customers.
Q2 came out on August 4 and it was a miss on both revenue and earnings, mostly because they are moving away from bitcoin mining. The buildout side looked fine though, with Black Pearl delivered early and the third data center fully funded. Analysts kept their Buy ratings but cut their targets.
From a technical point, I do not see price making
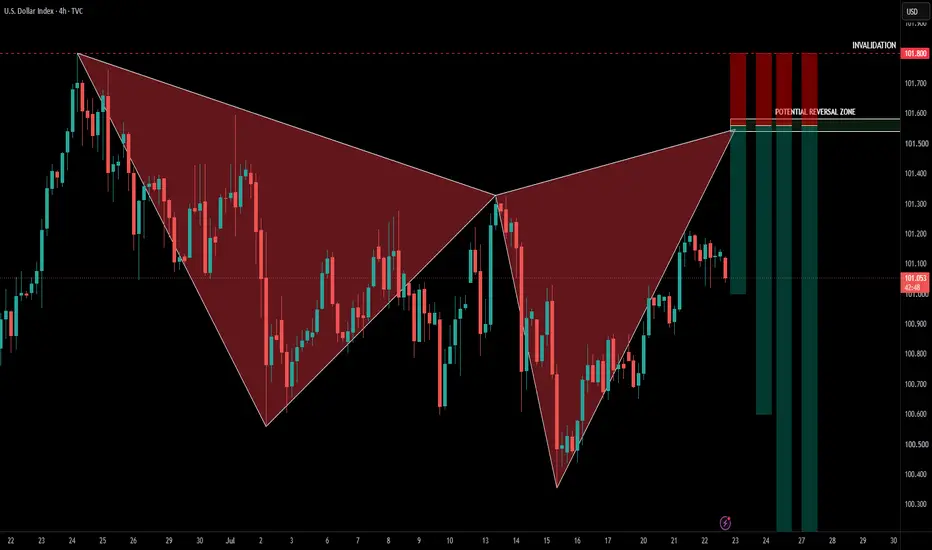
Cypher Harmonic Pattern: A Simple Trading PlanThe Cypher Harmonic Pattern helps traders identify potential market reversals. Instead of chasing price, you wait for it to reach a key area known as the Potential Reversal Zone (PRZ) before looking for a trade.
Entry
Wait for price to reach the PRZ between 101.550 and 101.600.
Don't enter immediately. Wait for a bearish confirmation, such as a rejection candle or a bearish engulfing candle.
Sell Entry: 101.580
Stop Loss
Place your stop loss above the invalidation level at 101.800.
If pri
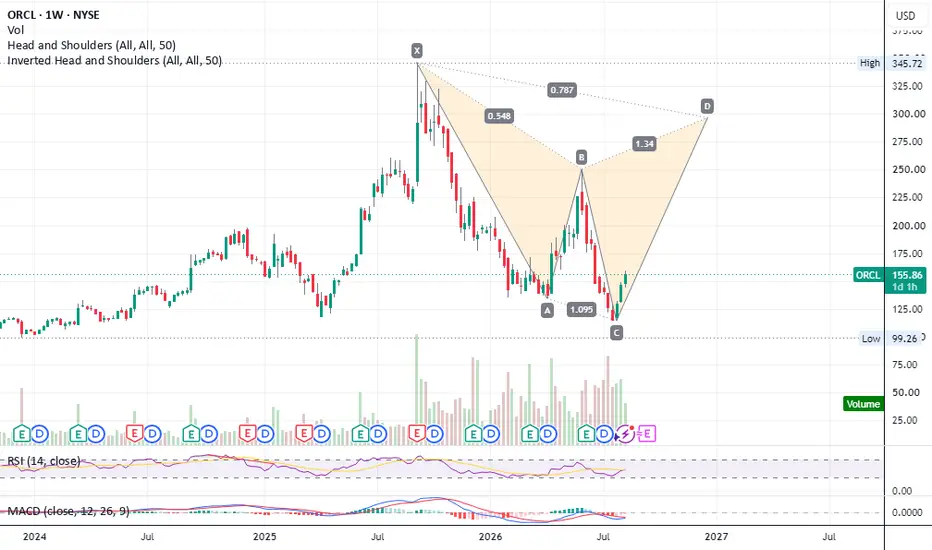
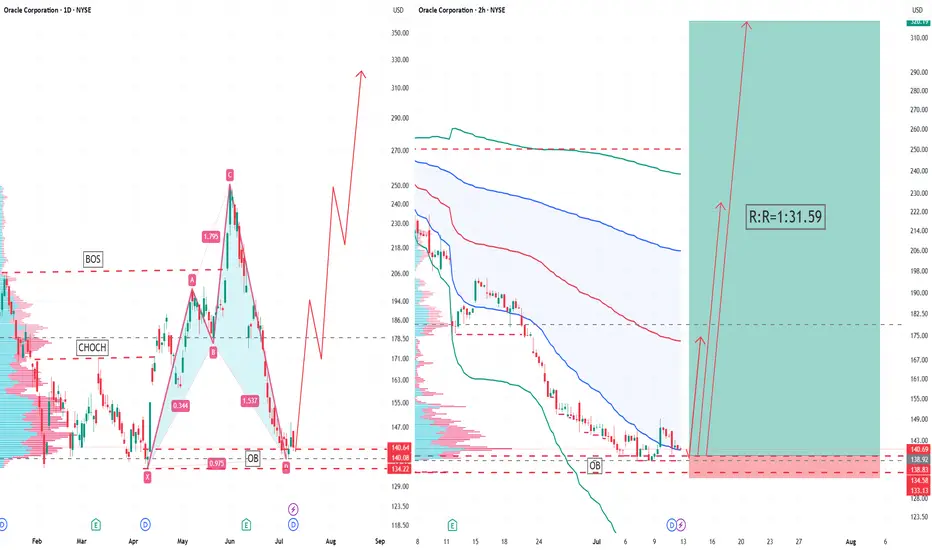
ORCL 2H Long Trading Plan (Final Professional Version)ORCL 2H Long Trading Plan (Final Professional Version)
Basic Information
• Trading Asset: ORCL (Oracle Corporation)
• Timeframe: 2-Hour Chart
• Trading Bias: Bullish Long
• Current Market Price: 140.69
Key Structural Zones
• Major Support Zone: 133.50 – 140.30
• Primary Resistance Zone: 190.00 – 200.00
• Secondary Resistance Zone: 230.00 – 250.00
• Tertiary Resistance Zone: 320.00 – 350.00
Entry & Hard Stop Loss Execution Rules
• Planned Long Entry Price: Around 139.00
• Fixed Hard
JK PAPE ON next moveWhat Is the Cypher Chart Pattern?
The Cypher is a type of harmonic pattern used by traders to identify potential buying and selling opportunities in the markets. Specifically, it’s used to help find areas where a reversal may occur.
The pattern is made up of five swing points (X, A, B, C, D) and four legs (XA, AB, BC, CD). It’s characterised by an “M” shape when bullish and a “W” shape if bearish. Traders typically place orders at D to catch the potential reversal.
Like other harmonic patterns
AUDCAD - Bearish CypherAUDCAD is completing a Bearish Cypher harmonic pattern, with price approaching the D-point near the 0.786 retracement of the XC leg.
The setup aligns with prior resistance, the volume profile POC, and upper value area, creating a strong confluence zone.
RSI is also showing early bearish divergence, suggesting momentum may be weakening as price enters the PRZ. This is a key area to watch for bearish rejection and reversal confirmation.
BTC BULLISH SET UPRight now, everyone and their mother seems bearish on Bitcoin. To me, that creates an opportunity to capitalize on a potential turning point.
The chart illustrates a possible Elliott Wave count, with an expanded flat correction potentially terminating within the yellow box. If that scenario plays out, it could mark the completion of the corrective structure and the beginning of a new impulsive move higher.
The setup is attractive because the risk is clearly defined. A break below $60,000 would
TAOUSDT 2H Long Trade PlanTAOUSDT 2H Long Trade Plan
Trading Pair: TAOUSDT
Timeframe: 2H
Direction: Long
Entry Price: Around 260.8
Stop Loss: 250.8
Position Management
1. First Target: 283.8. Close half of the position and move stop loss for protection.
2. Second Target: 302.5. Close half of the remaining position and move stop loss for protection.
3. Third Target: 326.00. Close half of the remaining position and move stop loss for protection.
4. Remaining position: Hold and adjust protection dynamically along the
BTC/USDT 4H Long Trade PlanBTC/USDT 4H Long Trade Plan
Trading Pair: BTC/USDT
Timeframe: 4H
Direction: Long
Entry Price: 73469.66
Stop Loss: 71416.00
Position Management
1. First Target: 77585.88
Close half of the position. Adjust stop loss for risk protection.
2. Second Target: 81638.00
Close half of the remaining position. Adjust stop loss for risk protection.
3. Third Target: 85835.20
Close half of the remaining position. Adjust stop loss for risk protection.
4. Remaining position: Hold and apply dynamic protecti
Trading Plan: WMT (4H) – ShortTrading Plan: WMT (4H) – Short
• Asset: WMT
• Timeframe: 4-Hour
• Direction: Short
• Entry: Around 131.65
• Stop Loss: 134.00 – 135.00
• TP1: 126.70 → Reduce 50% position; move SL to break-even
• TP2: 122.50 → Reduce half of remaining position; tighten stop loss
• TP3: 115.00 → Reduce half of remaining position; trail stop loss
• Final position: Hold with trailing stop
Risk Warning
Short selling carries unlimited upside loss risk and may trigger margin calls. Earnings, macro news and market
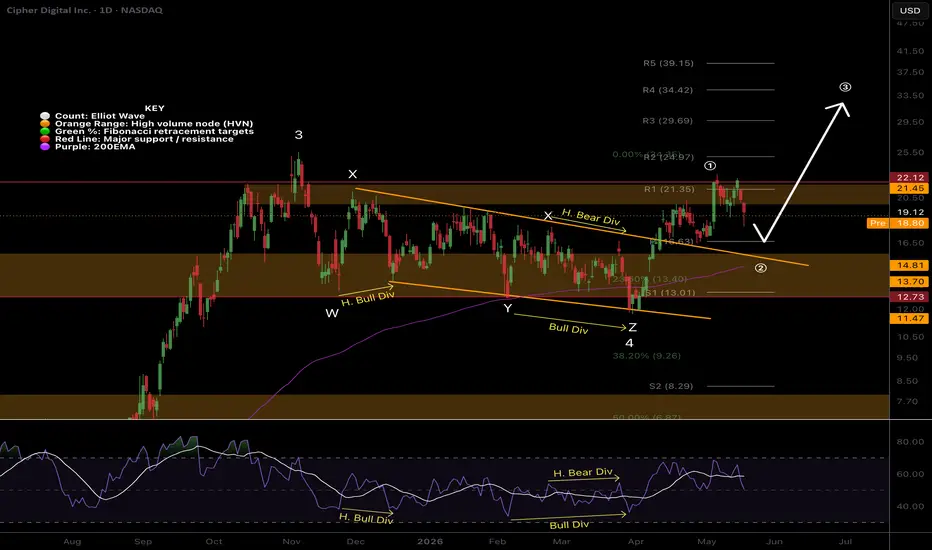
CIFR Short-term analysis | Trading and expectations🎯 CIFR has completed the Elliott wave complex correction WXYXZ for wave 4 at the daily 200EMA, reclaiming the daily pivot. Wave (1) of a new motif wave appears complete at the all-time high, High Volume Node resistance. Wave (2) has a target of the daily 200EMA, pivot and High Volume Node support ~$15. Wave (3) has a target of the R4 pivot, $34.42.
📈 Daily RSI is nearing overbought with no divergences, but has turned negative, supporting further downside first
👉 Analysis is invalidated below w
CIFR Macro analysis | The bigger picture | Long-term holdersNASDAQ:CIFR wave 4 appears complete at the triple support: weekly pivot, High Volume Node and 0.382 Fibs, challenging the all-time high, which it must overcome for confirmation. The macro structure has flipped bullish, with a new higher high above the descending trendline. Wave 5 has a target of the R3 weekly pivot at $49.89. Bulls are still in control with price above the weekly 200EMA and pivot.
📈 Weekly RSI is trending down from overbought, but has flipped bullish with no divergences. A pus