Long
Long
Sedco Capital Reit Fund : From Deep Discount to Potential 14–16TADAWUL:4344
📈 From Deep Discount to Potential 14–16 Target? The Weekly Chart Tells an Interesting Story 🔥
The weekly chart suggests that price may have completed a major accumulation and recovery phase after rebounding from a deep discounted Fibonacci retracement zone of the previous bullish swing from 4.14 to 11.00.
🔍 The Price Structure
After the initial bullish move, price retraced within a descending parallel channel, eventually forming a significant swing low near 5.91 in November 2025.
Since that low, price has demonstrated strong weekly bullish momentum and steadily recovered, despite the severe geopolitical conflict affecting the region during the first half of 2026.
This resilience is an important technical observation.
⚠️ Key Resistance: 8.10–8.25
Price is now approaching a significant resistance zone around 8.10–8.25, which aligns with the 0.5 Fibonacci retracement level.
At this stage, the market may need to cool off before continuing higher.
This could happen through:
🔹 Sideways consolidation
🔹 A controlled technical correction
🔹 A retest of previous breakout levels
🎯 Two Critical Correction Zones
If price experiences a pullback, two areas stand out:
📍 7.13 — Parallel Channel Breakout Retest
A retest of the previous descending channel breakout could provide an important support test.
📍 6.80 — 0.618 Fibonacci Retracement Zone
This area represents the deeper Fibonacci retracement level of the latest bullish swing and could act as a potential demand zone.
🚀 Breakout Strategy
For new positions, chasing price at the current market price may carry a relatively higher risk due to the nearby resistance zone.
A confirmed breakout above 8.25, preferably followed by a successful retest and support confirmation, could provide a more favorable risk-reward entry for momentum traders.
📊 Potential Upside Targets
If the bullish structure remains intact:
🎯 Initial upside target: Around 12.00
This is where the projected AB=CD harmonic pattern could reach completion.
🔭 Extended target zone: 14.00–16.00
A Reverse Fibonacci Extension projection suggests the possibility of a larger measured move toward this region.
🧠 My View
The broader weekly market structure remains bullish, but price is now entering a major technical decision zone.
The key question is:
Will price break above 8.25 and accelerate higher, or will the market first consolidate and retest lower support levels before the next major move?
For me, 8.25 remains the key trigger level, while 7.13 and 6.80 are the important correction and accumulation zones to monitor.
Do you think this is a breakout setup—or does price need one more correction before the next leg higher? 👀
Share your view below. ⬇️
🔖 Hashtags
#Tadawul #SaudiStocks #SaudiStockMarket #TASI #SaudiInvesting #SaudiTrading #SaudiInvestors #TadawulStocks #SaudiMarket #KSAStocks #RiyadhMarket #GCCMarkets #MiddleEastMarkets #StockMarket #Investing #Trading #TechnicalAnalysis #PriceAction #Breakout #SwingTrading #MarketOutlook #StockAnalysis #TradingIdeas #Bullish #Bearish #ChartAnalysis #TradingView #WiSHFundManagement
 Long
Long
TVSMOTOR: 1H Descending Channel Breakout past 61.8% Fib 📊 TVS Motor Company Limited (TVSMOTOR) - 1-Hour (1H) Chart Analysis
This post is shared for EDUCATIONAL PURPOSES ONLY to analyze short-term parallel channel breakouts, Fibonacci structural confluences, and moving average transitions. It is not financial or investment advice.
🎯 Educational Swing Setup:
• Entry Zone: 3,590.00 – 3,622.00 (Sizing into position blocks within this breakout environment or accumulating on minor hourly retests of the 3,600 EMA support zone).
• Target 1: 3,651.50
• Target 2: 3,680
• Target 3: 3,720
• Invalidation / Stop-Loss: 3,540.00 (An hourly candle close back below the pink long-term moving average baseline completely invalidates this breakout continuation structure).
• Expected Duration: 4 to 10 Trading Days (Short-term hourly swing view)
⚠️ Risk Management:
Since the price is actively grinding against the 61.80% Fibonacci barrier, watch for a clean volume continuation spike to validate institutional backing on the breakout extension. Maintain disciplined position sizing!  Long
Long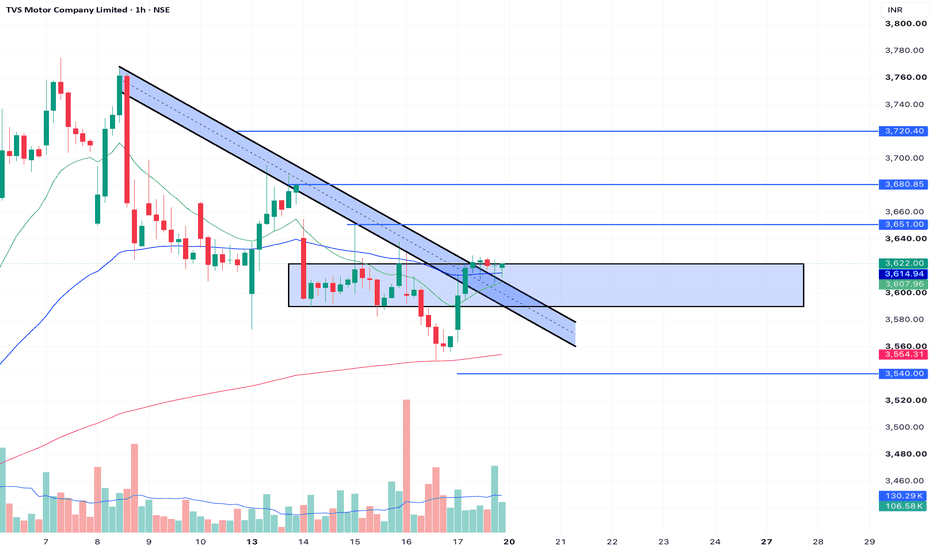
BITCOIN - A distribution toward 67K before a decline?BINANCE:BTCUSDT.P has transitioned from consolidation into a distribution phase following the breakout above resistance and is now advancing toward a key resistance zone within the broader bearish trend
The fundamental backdrop remains relatively weak for the cryptocurrency market. However, spot Bitcoin ETFs have recorded inflows for five consecutive trading sessions, providing short-term support for the current rally.
From a technical perspective, Bitcoin has broken above the 65,600 resistance level, and the momentum built during consolidation could drive price toward the 67,250 resistance zone. Nevertheless, given the prevailing higher-timeframe bearish trend, this area may act as a significant barrier and halt the advance
Resistance levels: 67,250
Support levels: 65,600, 63,800, 61,800
The broader market trend remains bearish. Price is approaching the key 67,250 resistance zone, where a short squeeze could shift momentum back in favor of sellers. If bears regain control at this level, Bitcoin could reverse and resume its primary downtrend toward 65,600, 63,800, and 61,800
Best regards,
R. Linda  Short
Short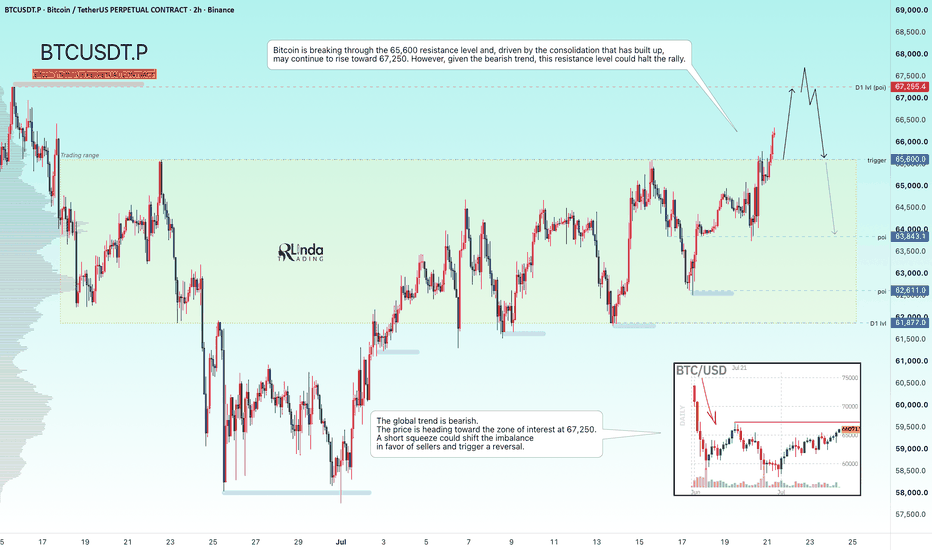
ETHUSDT - The Battle for a Key Support Zone BINANCE:ETHUSDT.P is showing local bullish momentum and appears stronger than Bitcoin in the current market environment. Price action is focused on the 1800–1850 zone, where buyers and sellers are competing for control
Bitcoin remains in consolidation between 61,000 and 65,000, while the broader market trend is still bearish. The lack of both fundamental and technical support continues to weigh on the crypto market as a whole.
From a technical perspective, Ethereum has broken above resistance, confirming a short-term bullish structure. During the ongoing correction, price is respecting the local trendline while testing the 1808–1848 area of interest
Resistance levels: 1848, 1946, 1966
Support levels: 1833, 1807, 1774
The key trigger remains 1848. If bulls can establish sustained consolidation above this level, it could become the technical catalyst for a move toward 1945–1966
Best regards,
R. Linda  Long
Long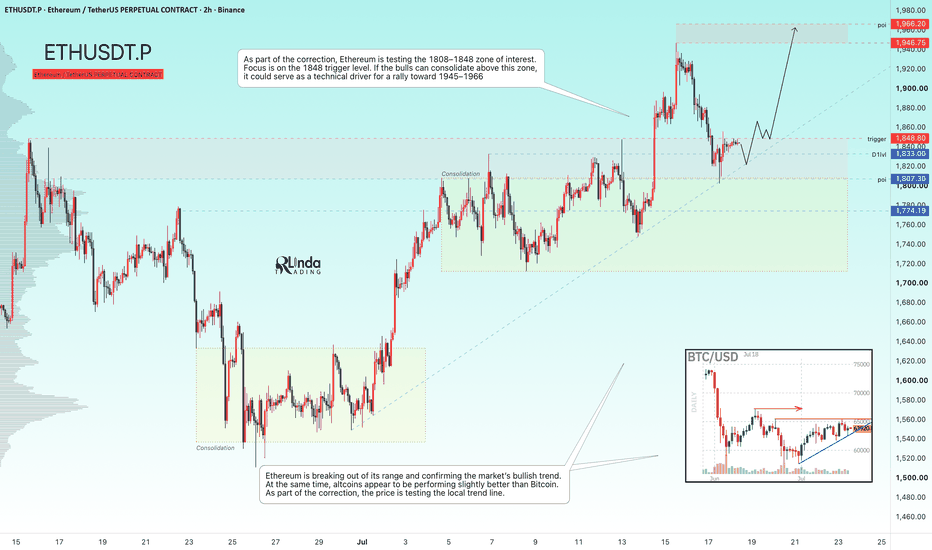
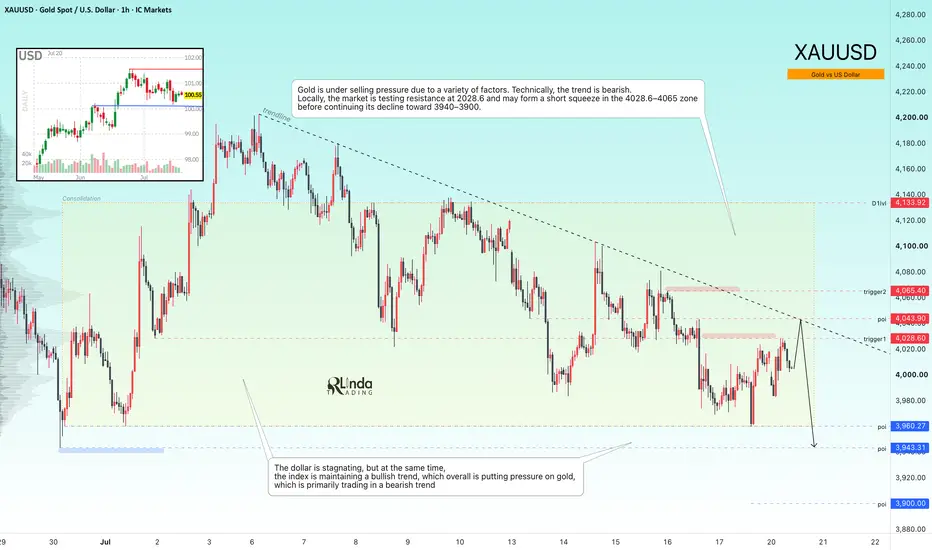
GOLD - A short squeeze before the decline continues toward 3900ICMARKETS:XAUUSD is hovering around the $4,000 mark on Monday, caught between bullish and bearish pressure as markets digest the ongoing escalation of tensions between the U.S. and Iran, while this week's U.S. economic calendar remains relatively light
The U.S. dollar remains in consolidation, although the Dollar Index (DXY) continues to maintain its broader bullish trend. Gold remains under pressure, and the daily technical outlook continues to favor the bears, limiting the potential for a sustained recovery. At this stage, there are few signs that this scenario will change in the near term.
Bearish drivers: Escalation of the U.S.–Iran conflict, supporting both the U.S. dollar and oil prices, Hawkish Federal Reserve rhetoric, Bearish technical market structure
Bullish drivers: Geopolitical de-escalation, Weaker-than-expected U.S. macroeconomic data, Profit-taking after recent declines
Resistance levels: 4028, 4043, 4065
Support levels: 3960, 3943, 3900
Gold remains under selling pressure due to a combination of technical and fundamental factors. The broader trend is still bearish. Technically, the market is confirming resistance around 4028.6, and a short squeeze into the 4028.6–4065 liquidity zone remains possible before the broader downtrend resumes toward 3940–3900
Best regards,
R. Linda  Short
Short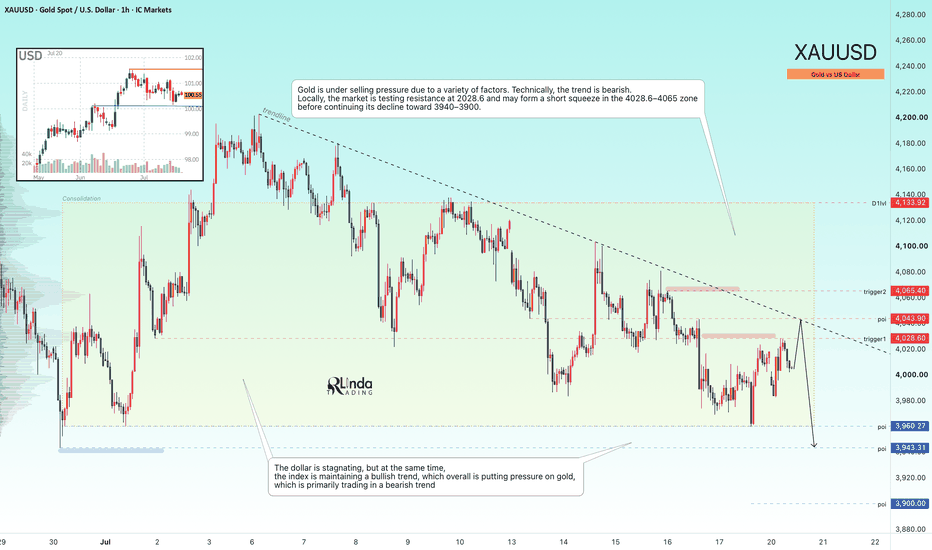
MASON XAUUSD – Key Support And Resistance Setup
XAUUSD is trading around 4,010 after recovering from the lower support area, but price is still moving below the main descending trendline. The short-term reaction shows buyers are defending the support zone, but the broader structure still needs confirmation before a stronger bullish move can be trusted.
The priority plan is to trade from strong support and resistance zones, with sell pressure still favoured if gold rejects from the upper Fibonacci resistance areas.
Technical View
Gold is currently trading below the descending trendline, which means the market is still under short-term bearish pressure. Even though price has reacted from the lower area, the recovery remains corrective while gold stays below the trendline and key resistance zones.
The 3,991–3,997 area is the main buy zone on the chart. This zone aligns with the Fibonacci 50 reaction area and sits above the 3,982 support. If gold pulls back into this area and holds, a short-term bullish reaction may appear.
However, the upside still has two important resistance zones. The first one is the 4,051–4,055 sell scalping FVG zone. This area may create the first bearish reaction if price recovers from the buy zone.
The stronger resistance is around 4,078–4,085, marked as the sell zone and Fibonacci 50 area. This zone is important because it aligns with the previous structure, Fibonacci resistance, and the descending trendline region. If gold reaches this zone and rejects, it may confirm another lower high before price turns down again.
The 3,982 level is the key support. If gold loses this level, the bullish reaction becomes weak, and price may move back toward the stronger support range around 3,960–3,970.
Key Zones
Current price: 4,010
Main buy zone: 3,991–3,997
Key support: 3,982
Strong support: 3,960–3,970
Sell scalping FVG zone: 4,051–4,055
Major sell zone: 4,078–4,085
Descending trendline resistance: 4,055–4,085
Invalidation for sell view: above 4,085
Trading Plan
Sell Priority: 4,051–4,055
Condition: wait for bearish rejection, failed breakout above the FVG zone, or price staying below the descending trendline.
SL: above 4,085
TP1: 3,991–3,997
TP2: 3,982
TP3: 3,960–3,970
Alternative Sell Scenario
If gold pushes higher into 4,078–4,085, wait for a clear bearish rejection from this major resistance zone before looking for sell continuation. This would be the stronger resistance-based sell setup.
SL: above 4,095
TP1: 4,051–4,055
TP2: 3,991–3,997
TP3: 3,982
Buy View
Buy is possible only as a short-term reaction from the 3,991–3,997 zone or near 3,982 support. The condition is clear bullish rejection, price holding above support, and a lower-timeframe higher low formation.
Buy Zone: 3,991–3,997
SL: below 3,982
TP1: 4,051–4,055
TP2: 4,078–4,085
Final View
Overall, gold is reacting from support, but the market has not broken the descending trendline yet. The cleaner plan is to wait for price to reach the strong decision zones. A reaction from 3,991–3,997 may support a short-term buy, while rejection from 4,051–4,055 or 4,078–4,085 keeps the bearish structure active.
Will gold hold the 3,991–3,997 support zone and recover, or reject from resistance and return toward 3,982?
Long 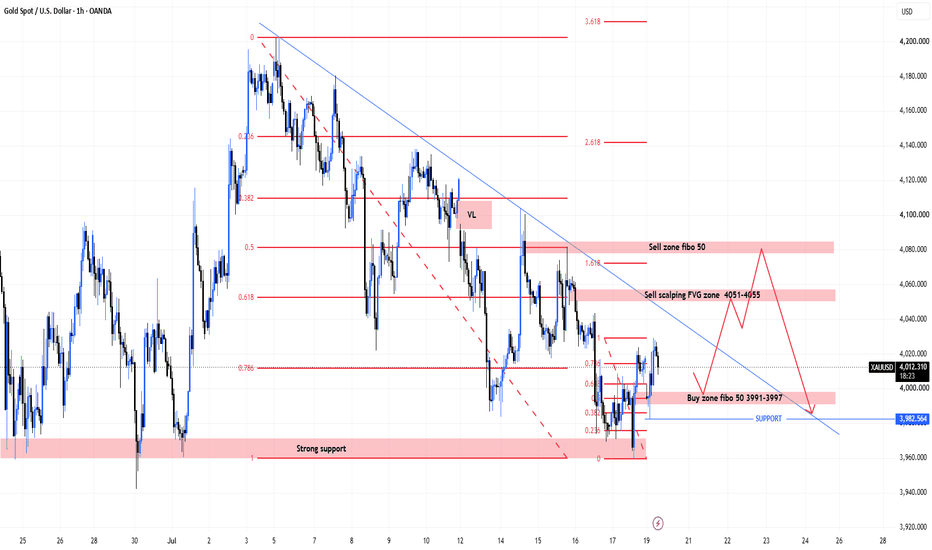
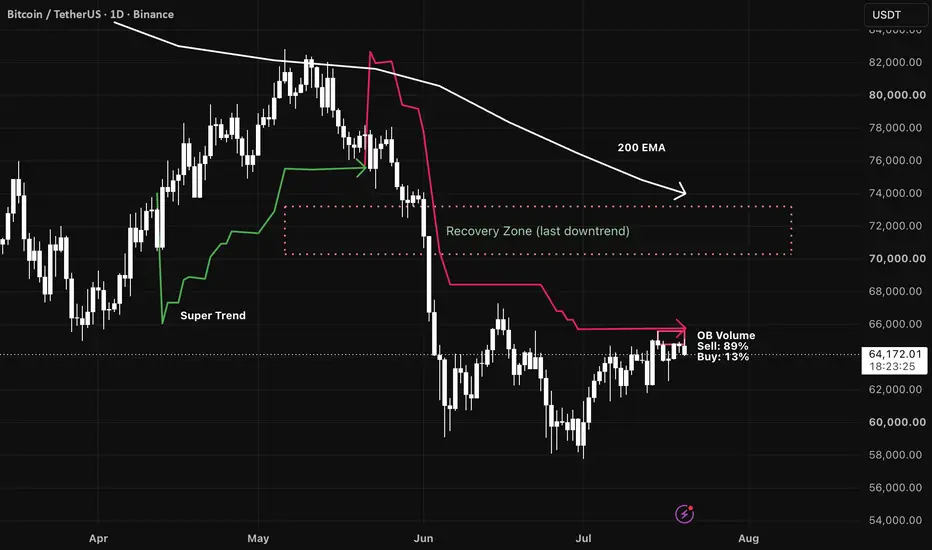
BTC/USDT (1D): Testing Resistance | SuperTrend & 200 EMAIn this daily analysis of Bitcoin (BTC/USDT), we take a look at the current price action relative to key trend indicators and key resistance zones.
Key Technical Factors:
SuperTrend Indicator:
The SuperTrend flipped bearish in late May/early June after the strong drop from the $70k+ levels. The red trailing stop level currently sits around $66,000, acting as immediate dynamic resistance.
Order Book Volume Ratio (OB Volume):
At the current level, sell volume dominance is showing around 89% vs. 13% buy volume, highlighting significant selling pressure right near this dynamic SuperTrend resistance.
Recovery Zone (70k – 73k):
If BTC manages to break and hold above the current red SuperTrend line (~$66,000), the next major target area lies within the Recovery Zone ($70,000 – $73,000), which corresponds to the base of the previous major breakdown.
200 EMA:
The 200-day Exponential Moving Average is currently sloping downward above the price, adding a layer of long-term dynamic resistance above the 73k mark.
Scenario Breakdown:
Bearish / Rejection Scenario:
As long as price remains capped under the $66,000 SuperTrend line and heavy selling volume persists, a rejection back toward local support levels ($60,000 – $58,000) remains a strong possibility.
Bullish Confirmation:
A daily candle close above $66,000 would invalidate the short-term bearish SuperTrend and open up a potential move toward the $70,000 – $73,000 Recovery Zone.
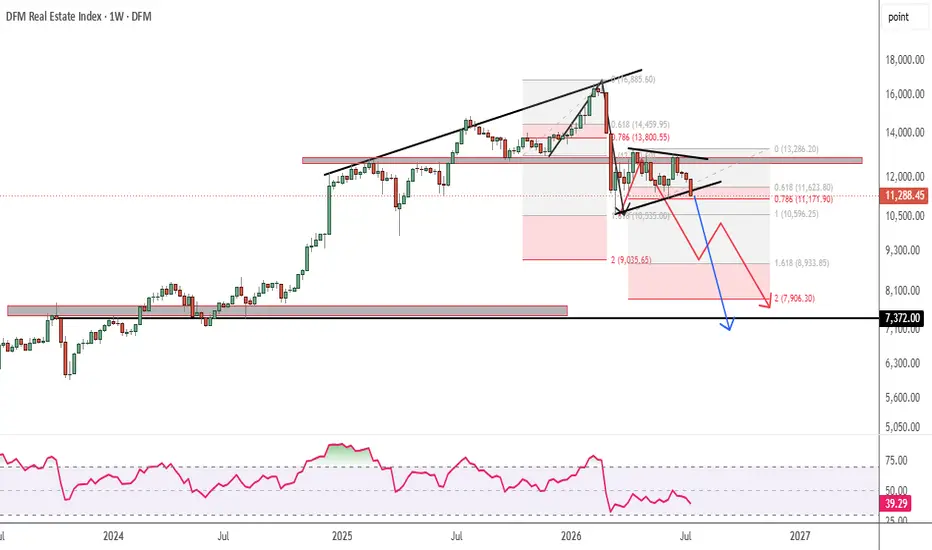
Disclaimer: This analysis is for educational purposes only and does not constitute financial advice. Always manage your risk according to your trading strategy. DFMREI : Is Downtrend Over ?DFM:DFMREI (Dubai Financial Markets Real Estate Index)
📉 Is the Downtrend Over? Reverse Fibonacci Suggests Another Leg Lower ⚠️
After rejecting from the 16.8k trendline resistance, the market continues to respect its broader bearish structure.
Here's what the chart is telling us:
🔹 The previous impulse moved from a 13k swing low to a 16.8k swing high, which also aligned perfectly with a major descending trendline resistance. Applying a Reverse Fibonacci Extension projected the 10.6k zone as the first major downside objective—and price respected it almost precisely during the sharp selloff triggered by the Middle East geopolitical conflict (highlighted by the black arrow).
🔹 The subsequent dead cat bounce stalled near 12.8k, a level that has repeatedly acted as both historical support and resistance, confirming it as a significant supply zone where sellers regained control.
What's Next?
Using the latest price structure:
Swing Low: 10.6k
Swing High: 12.8k
The prevailing trend remains bearish, with lower highs and lower lows still intact.
Projecting another Reverse Fibonacci 1.618 Extension identifies the 9k–8k demand zone as the next high-probability downside target (illustrated by the red path).
Adding further weight to the bearish outlook, the chart is also developing a Bearish Pennant / Bear Flag continuation pattern. If this structure confirms with a downside breakout, the measured move projects a final target around the 7.3k–7k region ( blue arrow marked )
Key Technical Confluences
✅ Reverse Fibonacci Extensions
✅ Bearish Pennant / Bear Flag Pattern
✅ Trendline Resistance Rejection
✅ Lower High–Lower Low Market Structure
✅ Historical Support & Resistance Flip
✅ Momentum Continuation Setup
My View
As long as price remains below 12.8k, rallies may continue to be selling opportunities rather than signs of a trend reversal.
A confirmed break below 10.6k could accelerate downside momentum toward the 9k–8k zone, while a completed bear flag projection opens the possibility of testing the 7k area.
What do you think? Is this simply another correction, or are we preparing for the next major leg down? Share your analysis below.
#TechnicalAnalysis #TradingView #PriceAction #ReverseFibonacci #FibonacciExtension #BearFlag #BearishPennant #ChartPattern #SupportAndResistance #TrendAnalysis #SwingTrading #MarketStructure #StockMarket #Crypto #Investing #Trading #Momentum #Breakdown #TrendFollowing #SmartMoney #VolumeAnalysis #ChartOfTheDay #TradeIdeas #MarketOutlook #Bearish
Btw, i had already shared the dead cat bounce scenario, proof below
Educational content only. Not financial advice.
BTCUSDT 2022 | Lesson Learnt from Wrong Low IdentifiedBINANCE:BTCUSDT
📚 One Lesson I Wish I Had Understood Earlier
Back in 2022, I began my technical analysis journey under @Trad3WithFaraz. At that time, Harmonic Patterns felt overwhelming, and I struggled to fully understand their significance.
What I failed to appreciate then was a simple yet powerful concept:
Many harmonic reversal patterns complete around the 0.886 Fibonacci retracement level.
(later I learnt that " MANY " and not the " ONLY ")
Looking back at a chart I shared on 26 November 2022, I realized I was incredibly close to identifying a major reversal. The market had already provided the clues—I simply hadn't completed the learning process or revised the concepts thoroughly enough to recognize them.
May be a funny thing, 0.786 was not even looking aesthetic as well, so I opt for 0.886.
Experience has taught me that knowledge only becomes valuable when it's understood, practiced, and consistently applied.
Today, my trading approach has evolved. I place significant emphasis on the 0.618–0.786 Fibonacci retracement zone, which has become one of the core areas I monitor for high-probability setups. While every strategy has its limitations, these levels have helped me stay more disciplined and objective in my market analysis.
📌 Key Takeaways
✅ Never stop revising what you learn.
✅ The market often rewards patience more than prediction.
✅ Mastering a few concepts is far more valuable than knowing many superficially.
✅ Consistency comes from following a repeatable process—not chasing every move.
Every chart is a lesson, and every mistake is tuition. Keep learning, keep refining, and trust the process.
What was the one trading concept that completely changed your perspective? Share your experience below. 👇
Educational content only. Not financial advice.
Education 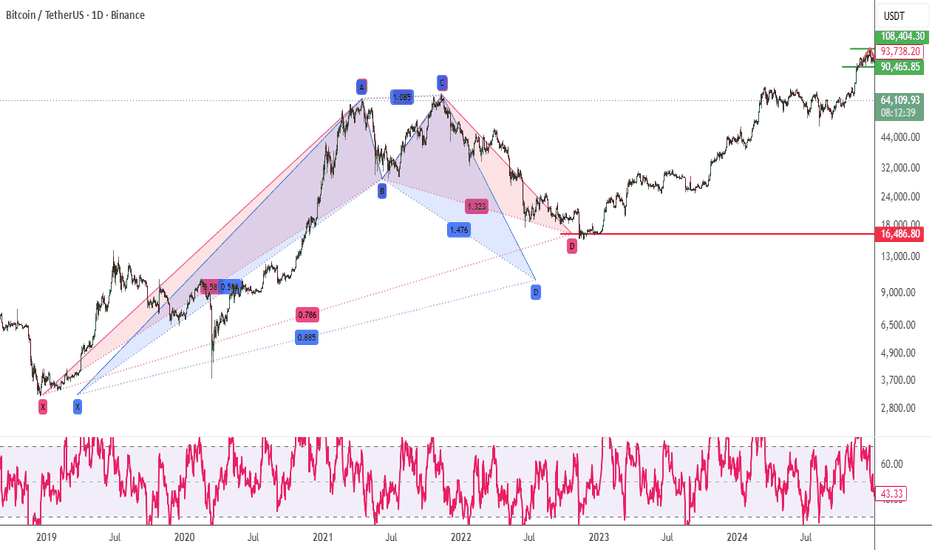
 Long
Long
 Long
Long
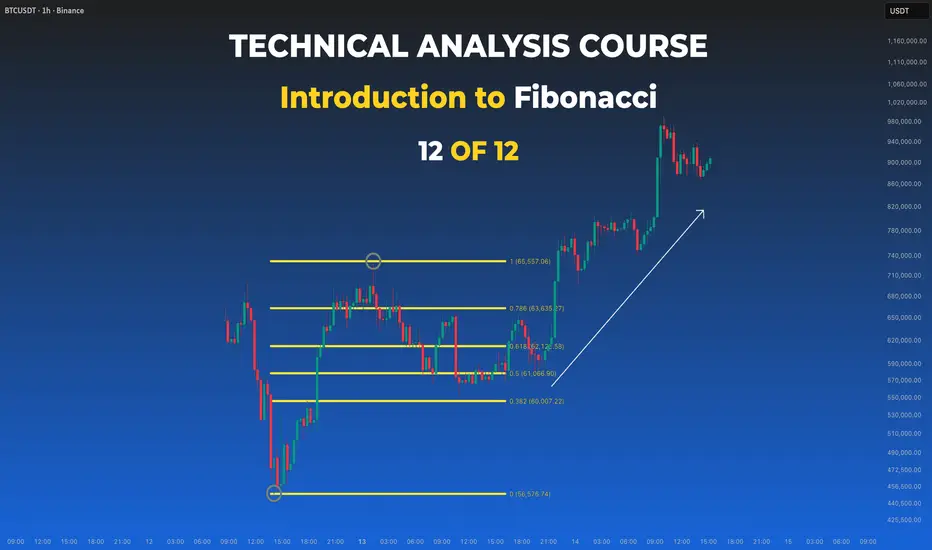
Trading Roadmap | Classical TA · Lesson 12 — Intro to FibonacciLesson 12 - Introduction to Fibonacci
Difficulty: Intermediate
Fibonacci levels do not predict price — they offer a structured way to map where pullbacks may pause and where trends may reach. In this final lesson of the course, we tie them into the structure, trends, and confirmation tools you've built through the whole roadmap.
🔵 WHERE THE LEVELS COME FROM
The Fibonacci sequence produces a set of ratios — 23.6%, 38.2%, 61.8%, 78.6% — that traders project onto price swings. The 50% level is not a Fibonacci ratio, but it is so widely watched that most tools include it.
Why do these levels matter? Not because markets obey mathematics — but because enough traders watch the same levels that price can react around them. Treat them as zones of interest, not magnets.
🔵 FIBONACCI RETRACEMENT — HOW TO DRAW IT
The retracement tool measures how deep a pullback goes relative to the previous swing:
- In an uptrend → anchor from the swing low to the swing high ; the levels map potential support zones for the pullback
- In a downtrend → anchor from the swing high to the swing low ; the levels map potential resistance zones for the bounce
Consistency matters more than perfection: pick clear, meaningful swings (the ones you'd mark with the structure skills from Lesson 2 and 3) and anchor the same way every time — wick to wick is the common choice.
One practical note: depending on which anchor you click first, the tool may print the 0 and 1 labels in reverse. The zones between the levels are what many traders focus on — the label direction matters less than applying your own method consistently.
- Shallow pullbacks (23.6%–38.2%) → can suggest a strong trend where buyers/sellers step in early
- Deeper pullbacks (50%–61.8%) → common in healthy trends; often watched for continuation setups
- Very deep pullbacks (78.6%) → the trend may be in question; many traders demand extra confirmation here
🔵 THE GOLDEN POCKET
The area around the 50%–61.8% retracement — with some traders extending it to 65% — is often called the "golden pocket": one of the most widely watched zones for trend-continuation setups.
It works in both directions. In an uptrend, pullbacks into the zone can find support. In a downtrend, bounces into the zone can meet resistance — the reaction there may offer a continuation setup in the direction of the larger trend.
In the chart above: after the swing from high to low, the bounce reached the 0.5–0.618 zone and printed a reaction candle. The pocket acted as resistance — because the larger trend was down — and the move lower resumed. Same zone, mirrored logic.
A level alone is not a signal. What many traders look for inside the pocket:
- A reversal candle from Lesson 5 (hammer, engulfing) forming at the zone
- Volume stepping in as price reaches the area (Lesson 9)
- The zone overlapping a prior support/resistance level (Lesson 3)
Two common entry styles:
- Aggressive — enter on the first clear reaction candle inside the pocket, with a stop beyond the zone
- Conservative — wait for price to break minor structure in the trend direction before entering
🔵 FIBONACCI EXTENSIONS — MAPPING TARGETS
Retracements help with entries; extensions can help with exits. Once a pullback holds and the trend resumes, extension levels — commonly 1.272 and 1.618 — project where the next leg may reach.
A practical approach many traders use:
- Take partial profit at the 1.272 extension
- Let the rest run toward 1.618, trailing the stop behind structure
Extensions are estimates, not promises — when price approaches an extension level with fading momentum (Lesson 11's divergence concept), that can be a reasonable place to lighten up.
In the chart above: after the September swing and a deep pullback, the trend resumed and reached the 1.272–1.618 extension zone. Notice what followed the tag of the extended target — a sharp drop. Taking partials into extension zones, rather than holding for more, is exactly what this tool is for.
🔵 CONFLUENCE — WHERE FIB TENDS TO WORK BEST
A Fibonacci level on its own is just a line. Its usefulness often comes from confluence — when it lines up with things you already learned to read:
- A prior support/resistance level (Lesson 3) sitting inside the golden pocket
- A rising moving average (Lesson 10) crossing through the same zone
- A trendline or channel boundary (Lesson 4) meeting the retracement
- A reversal pattern (Lesson 7) completing at the level
When several independent tools point to the same area, the zone carries more weight than any single line.
In the chart above: the fib level lands inside a horizontal zone that had already acted as resistance earlier — a prior level flipping into support (Lesson 3). The pullback tagged the overlap, held, and the trend resumed. Two independent tools, one zone.
🔵 COMMON MISTAKES
- Drawing fibs on every minor wiggle — the tool works best on clear, significant swings
- Switching anchor style (wicks vs bodies) chart to chart, then wondering why levels look off
- Treating a level touch as an automatic entry with no confirmation
- Using retracements against the larger trend — a 61.8% bounce in a strong downtrend is still a counter-trend trade
- Stacking so many fib drawings that every price is "at a level"
Above: the first mistake in action — a fib drawn on a minor swing in the middle of a larger trend. The levels are crammed into a few hundred dollars of range and price barely notices them.
Same chart, same tool — anchored on the major swing instead. The levels now map zones the market actually reacted to. The swing you measure decides whether the tool says anything useful.
🐳 PRO TIPS
- Fib levels drawn on higher-timeframe swings (daily, weekly) tend to carry more weight than those on 5-minute charts.
- If you can't decide which swing to anchor, you may be forcing it — the swings worth measuring are usually the obvious ones.
- Mark your fib zone before price reaches it, then let the candles at the zone make the decision. Planning ahead of the touch tends to produce calmer execution than reacting to it.
- This is the last lesson of the Classical TA course — the strongest setups usually come from combining lessons, not from any single tool. Structure first, confirmation second, indicators and fibs as context.
That wraps the Classical TA course. 🎓 If it helped you, drop a comment with the lesson that improved your trading most — and tell us what course you'd like to see next. 🐳
Full Trading Roadmap | Classical TA Course
Trading Roadmap | Classical TA · Lesson 01 — Mastering the Chart
Trading Roadmap | Classical TA · Lesson 02 — Mastering Trends
Trading Roadmap | Classical TA · Lesson 03 — Support & Resistance
Trading Roadmap | Classical TA · Lesson 04 — Price Channels
Trading Roadmap | Classical TA · Lesson 05 — Single Candle Patterns
Trading Roadmap | Classical TA · Lesson 06 — Multi-Candle Patterns
Trading Roadmap | Classical TA · Lesson 07 — Reversal Chart Patterns
Trading Roadmap | Classical TA · Lesson 08 — Continuation Chart Patterns
Trading Roadmap | Classical TA · Lesson 09 — Volume Analysis
Trading Roadmap | Classical TA · Lesson 10 — Moving Averages
Trading Roadmap | Classical TA · Lesson 11 — Core Indicators (RSI, MACD, Stochastic, Bollinger Bands)
Best Regards, BigBeluga 🐳 Education 
XAUUSD — Bearish Continuation Toward Fibonacci Target
Fundamental Analysis
Gold remains sensitive to USD momentum, Treasury yields, and upcoming U.S. macro data. For next week, the technical bias still leans bearish while price stays below the major descending structure.
Technical Analysis
On the 4H chart, XAUUSD is trading around 4,017 after losing momentum under the downtrend trendline. The nearest sell reaction zone is around 4,050 - 4,070, where price may retest the Fibonacci sell area before another downside move. If this zone rejects price, sellers may continue to push gold toward the lower Fibonacci psychological target around 3,755. A stronger recovery toward 4,203 or 4,300 - 4,384 would only be a deeper bearish retest unless price breaks the major downtrend.
Important Key Levels
Current price: 4,017
Nearest sell zone: 4,050 - 4,070
Strong resistance: 4,203
Fibonacci liquidity zone: 4,290 - 4,310
Major Fibonacci sell zone: 4,380 - 4,384
Main downside target: 3,755 - 3,740
Invalidation: above 4,203
Trading Scenario
Main Sell Setup
Entry: 4,050 - 4,070
Stop Loss: 4,203
Take Profit 1: 3,950
Take Profit 2: 3,850
Take Profit 3: 3,755 - 3,740
Sell Condition
Wait for gold to recover into the 4,050 - 4,070 Fibonacci sell zone and show bearish rejection. A failed reclaim, long upper wick, bearish engulfing candle, or close back below the zone would confirm seller pressure. If price breaks below the recent low, the bearish continuation setup becomes stronger. If gold breaks and holds above 4,203, this sell setup should be invalidated.
Overall View
The main view for next week remains bearish while XAUUSD trades below the downtrend structure. A short-term recovery can happen, but the preferred plan is to wait for price to retest the Fibonacci sell zone before looking for continuation toward the 3,755 - 3,740 target area.
Do you share the same bearish view on gold for next week, or are you waiting for a deeper retest near 4,203 first?
Short 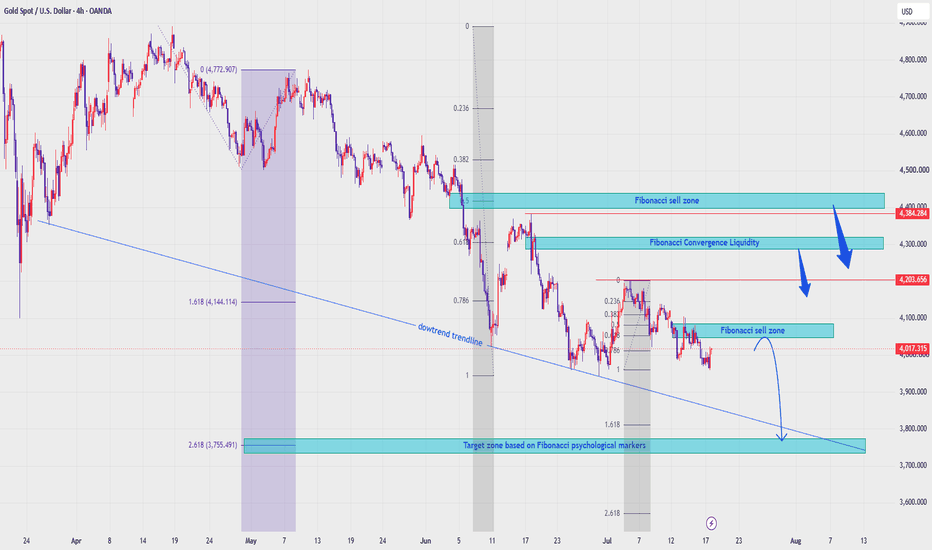
GOLD - The hunt for liquidity before the fall to 3900...FX:XAUUSD has completely unwound the bullish momentum generated by the recent news and has printed fresh local lows. The market remains in both a local and broader bearish trend, driven by persistent fundamental and geopolitical uncertainty
Gold continues to trade under pressure, with sellers firmly in control. The next key catalysts will be the U.S. Consumer Sentiment and Inflation Expectations reports. The technical outlook remains bearish, with price making new local lows while still holding above the key 3960 support area. Before the broader decline resumes, the market may enter a liquidity sweep phase, with downside potential extending toward 3940–3900.
Bearish drivers: Escalation of geopolitical tensions, Rising oil prices and a stronger U.S. dollar, Hawkish Federal Reserve rhetoric, Strong U.S. economic data
Bullish drivers: Geopolitical de-escalation, Weaker-than-expected consumer sentiment data, End-of-week profit-taking
Resistance levels: 4028, 4043, 4065
Support levels: 3960, 3943
The U.S. dollar remains in a strong bullish trend, reinforcing the bearish outlook for gold. Technically, the market is developing a breakout structure around the 3960–3940 support zone. A sustained break and close below this area could trigger another leg lower.
However, before the next sell-off, a short squeeze toward the 4028–4065 resistance zone remains possible. A false breakout of this area could attract fresh selling pressure and accelerate the broader downtrend
Best regards,
R. Linda Short 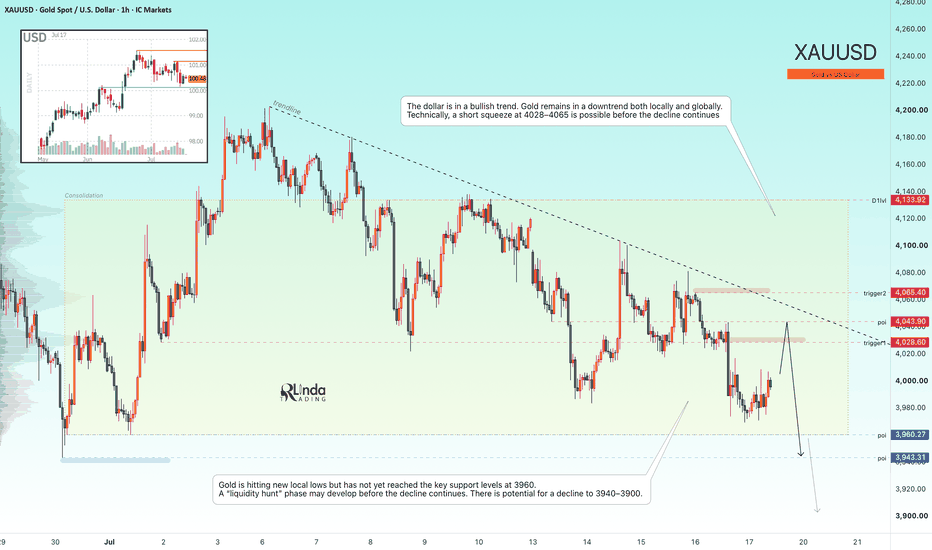
 Long
Long
BITCOIN - A false breakout of resistance in a bear market BINANCE:BTCUSDT.P is forming a retest of the key 64,500 resistance level as part of a countertrend correction, trapping late buyers while the market remains in a liquidity sweep phase
The broader trend remains bearish. Unstable ETF flows, the lack of meaningful fundamental support, and ongoing geopolitical uncertainty continue to weigh on the market.
Within the broader bear market, the market maker has swept liquidity above 64,500 before pushing price back into the trading range. Bitcoin remains in a 62,000–65,000 consolidation zone, while the higher-timeframe trend continues to point lower. A short squeeze into the resistance area could trigger another sell-off toward the 60K–50K region
Resistance levels: 64,450, 64,700, 65,600
Support levels: 62,750, 61,300
A retest of the liquidity pool above 64,450 may attract renewed selling pressure. If bears successfully defend this key resistance zone, it would further confirm the prevailing bearish market structure and increase the probability of a decline toward 62,750 and 61,300
Best regards,
R. Linda Short 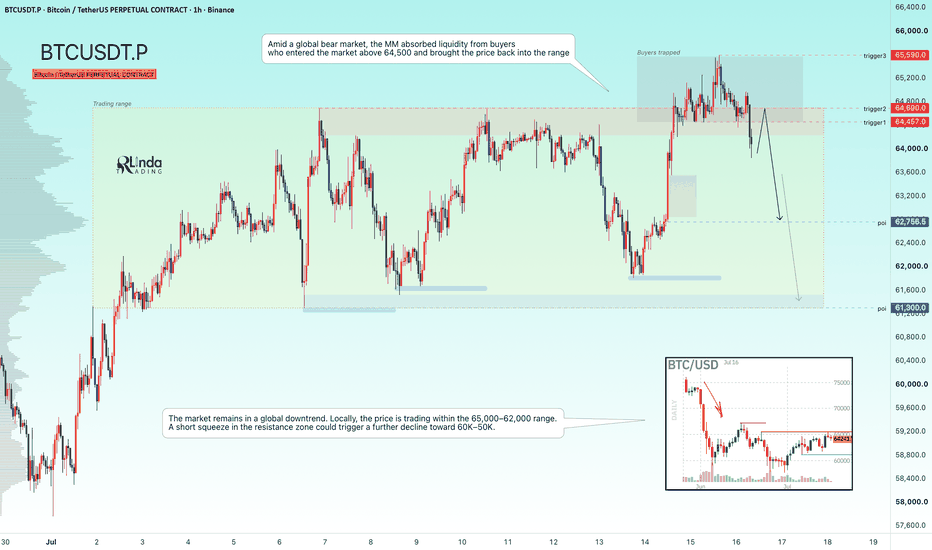
GOLD - Anticipating a short squeeze before the decline continuesICMARKETS:XAUUSD experienced a short squeeze around the key liquidity zone following Tuesday's CPI release. However, the market quickly regained its bearish momentum and resumed selling in line with the prevailing trend
The U.S. dollar remains in consolidation, as does the broader market, but the Dollar Index (DXY) continues to maintain its broader bullish trend, keeping pressure on gold. The lack of fundamental support, combined with ongoing geopolitical tensions, continues to favor the bears. The escalation of the U.S.–Iran conflict in the Strait of Hormuz remains a key source of uncertainty
Gold is still under pressure, with sellers maintaining control and using every rebound as an opportunity to initiate new short positions. The next major catalysts will be the U.S. Producer Price Index (PPI) and speeches from Federal Reserve officials, including Warsh. The daily technical structure remains bearish.
Bearish drivers : Escalation of the geopolitical conflict, Higher oil prices, Hawkish Fed rhetoric, Technical sell-on-rallies
Bullish drivers : Geopolitical de-escalation, Weaker-than-expected inflation data (including PPI), Dovish Fed commentary
Resistance levels: 4062, 4103
Support levels: 4021, 3986, 3960
Technically, gold is testing the 4021 intermediate support level. A local false breakdown could trigger a countertrend rebound toward the 4062 resistance zone to sweep liquidity before the broader downtrend resumes toward 3986–3960
Best regards,
R. Linda Short 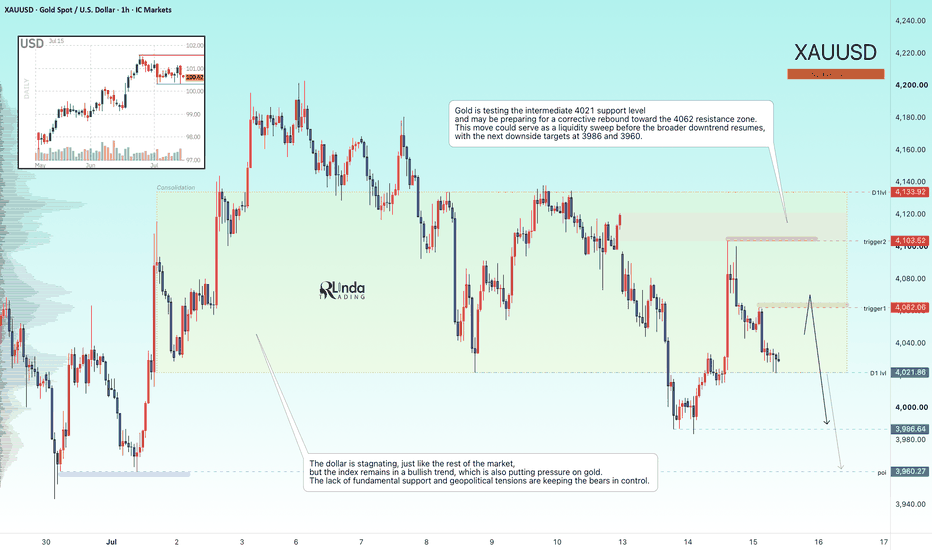
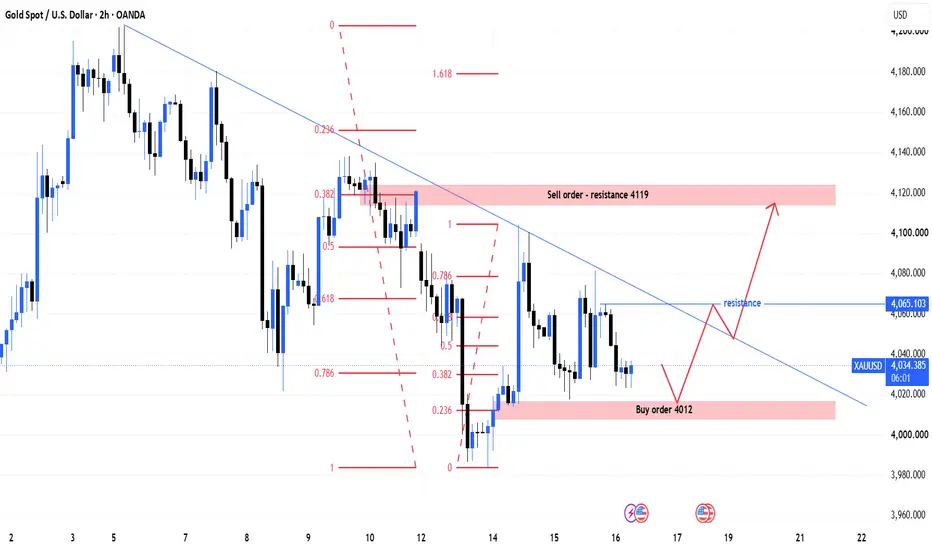
MASON XAUUSD – Bullish Setup Above 4,012 Buy Zone
XAUUSD is trading around 4,036 after forming a short-term base above the 4,012 buy order zone. Price is still below the descending trendline, but the current structure shows that buyers are trying to defend the lower support area.
The priority view is bullish recovery, as long as gold holds above 4,012 and breaks the 4,065 resistance with clear confirmation.
Technical View
Gold is currently moving inside a short-term corrective structure after the previous bearish move. However, the selling pressure is slowing down around the 4,012 buy order zone, where price has started to build a stronger reaction base.
The 4,012 area is the most important support on this chart. If gold pulls back into this zone and holds, it may confirm a higher low before the next bullish leg. This would support the idea that buyers are preparing for a recovery move.
The descending trendline is still acting as the main resistance. Price needs to break above this trendline and the 4,065 resistance level to confirm stronger bullish momentum. Without this breakout, the recovery may remain limited.
The 4,065 level is the first key resistance. A clean breakout and retest above this level may open the way toward the 4,119 sell order resistance zone. This is the main upside target marked on the chart.
If buyers continue to control the structure above 4,065, gold may extend higher toward the Fibonacci resistance area above 4,119. But the first important step is still confirmation above the trendline.
Key Zones
Current price: 4,036
Main buy order zone: 4,012–4,020
Short-term support: 4,020–4,030
Breakout resistance: 4,065
Descending trendline resistance: 4,060–4,070
Sell order resistance: 4,119–4,125
Higher Fibonacci target: 4,145–4,160
Invalidation: below 3,980
Trading Plan
Buy Priority: 4,012–4,020
Condition: wait for bullish rejection, higher low formation, or price holding above the buy order zone before looking for continuation.
SL: below 3,980
TP1: 4,065
TP2: 4,119–4,125
TP3: 4,145–4,160
Alternative Scenario
If gold breaks above 4,065 directly, wait for a retest of this level as support before looking for buy continuation toward 4,119. A clean hold above 4,065 would confirm that the short-term recovery is gaining strength.
Sell View
Sell is not the priority while price holds above 4,012. A short-term sell reaction may appear around 4,065 or 4,119, but it should only be treated as a correction unless gold breaks below 3,980.
Final View
Overall, gold is still below the descending trendline, but the price action around 4,012 shows that buyers are defending the market. The cleaner plan is to wait for price to hold the buy order zone or break above 4,065. If confirmation appears, the bullish path toward 4,119 and 4,145 remains in focus.
Will gold hold the 4,012 buy zone and break the trendline, or retest the lower support first before the next bullish move?
Long 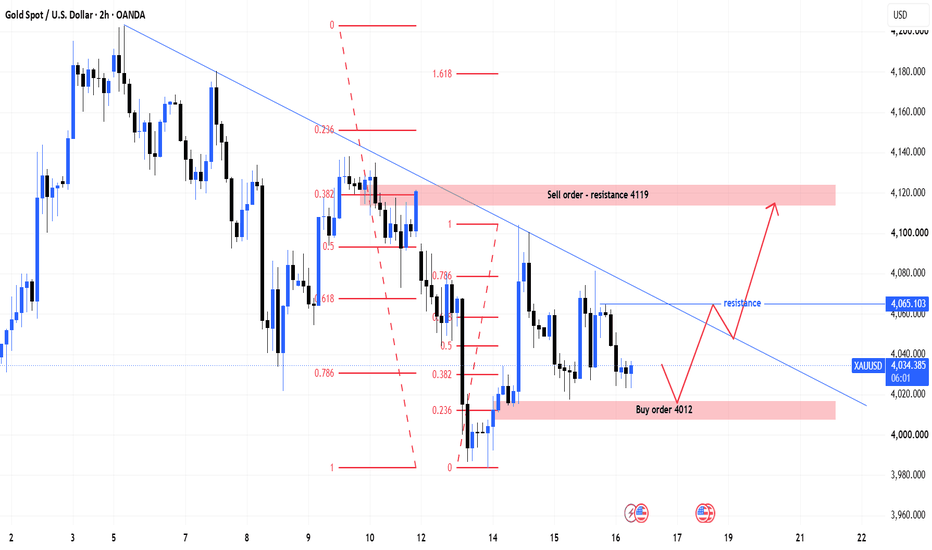
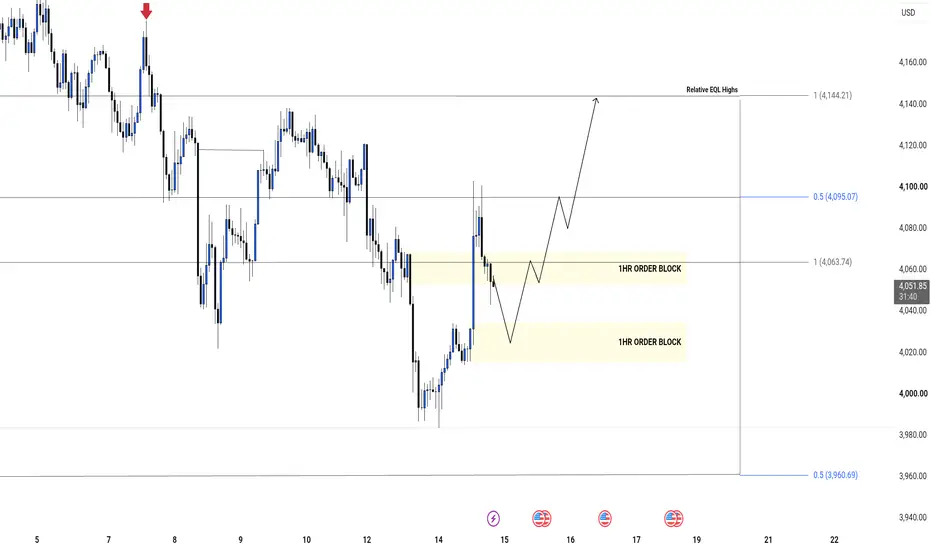
SMC Structural Shift: Targeting Relative EQL HighsTechnical Breakdown
1. Liquidity Sweep & Displacement
The Sweep: Price aggressively took out the previous structural lows, dipping below 4,000 to hunt sell stops.
The Shift: Immediately after the sweep, a sharp, impulsive green candle pushed back upward, indicating strong institutional displacement and buying pressure.
2. The Dual 1HR Order Blocks
We have two high-probability demand zones highlighted in yellow:
First 1HR Order Block (Discount Zone): Located around the 4,020.00 – 4,035.00 range. This is the deep mitigation area where the initial buy-side pressure started.
Second 1HR Order Block (Breaker/Support Zone): Located around 4,055.00 – 4,065.00 (anchored by the Fibonacci level 1 (4,063.74)).
3. Expected Price Path
The anticipated path (indicated by the black path arrow) shows price retracing into the lower 1HR Order Block to fill resting buy orders before initiating an aggressive bullish expansion leg to target premium liquidity pools.
The Trading Plan
🎯 Entry Zone: 4,025.00 – 4,035.00 (Deep mitigation inside the lower 1HR OB)
🛑 Stop Loss (Invalidation): Clean break below 3,980.00 (Below the recent sweep low)
🎯 Target 1 (Equilibrium): 4,095.07 (0.5 Fib level)
🎯 Target 2 (Relative EQL Highs): 4,144.21 (Major target where buy-side liquidity resides)
Liquidity has been swept, structure is shifting, and the demand blocks are drawn. Are you taking the entry at the first block, or waiting for a deeper dip into the 4,020 zone? Let's discuss in the comments!
Education purpose only not a financial advice Long 
USDCAD - From consolidation to downward distributionFX:USDCAD is forming a reversal pattern following its recent strong rally. The market appears to be transitioning from a consolidation phase into a distribution phase
The U.S. dollar has entered a period of consolidation, while the Canadian dollar is beginning to strengthen, putting additional pressure on the pair.
After the strong advance, USDCAD moved into a 1.4150–1.4250 trading range. Instead of continuing higher, price is now showing signs of a reversal. Buyer participation may lead to a distribution phase, with the market potentially moving lower to fill the existing fair value gap (FVG)
Resistance levels: 1.4150, 1.4177
Support levels: 1.4092, 1.4024
Technically, after breaking below the consolidation support, bears are attempting to keep the price below the 1.4150 range boundary. As long as this level remains under sellers' control, the market may continue its decline toward 1.4092 and 1.4024
Best regards,
R. Linda