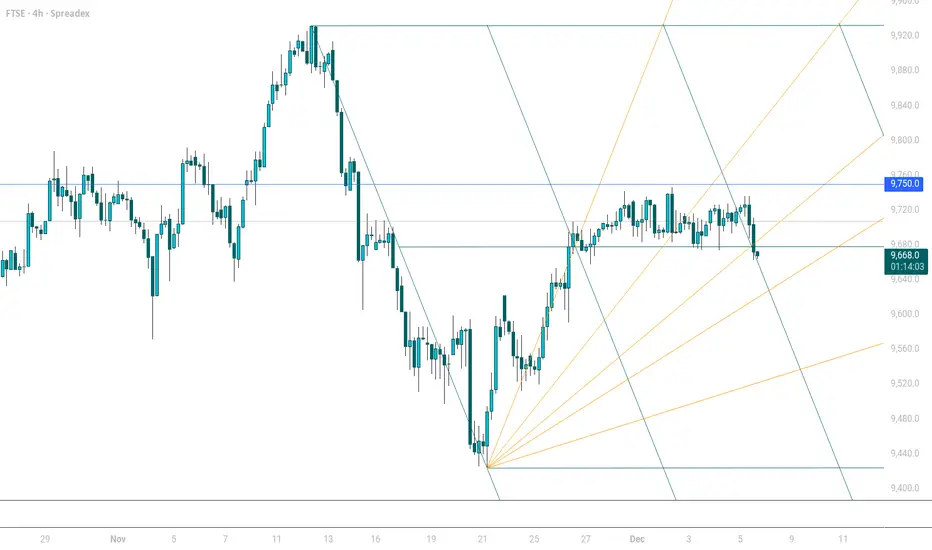
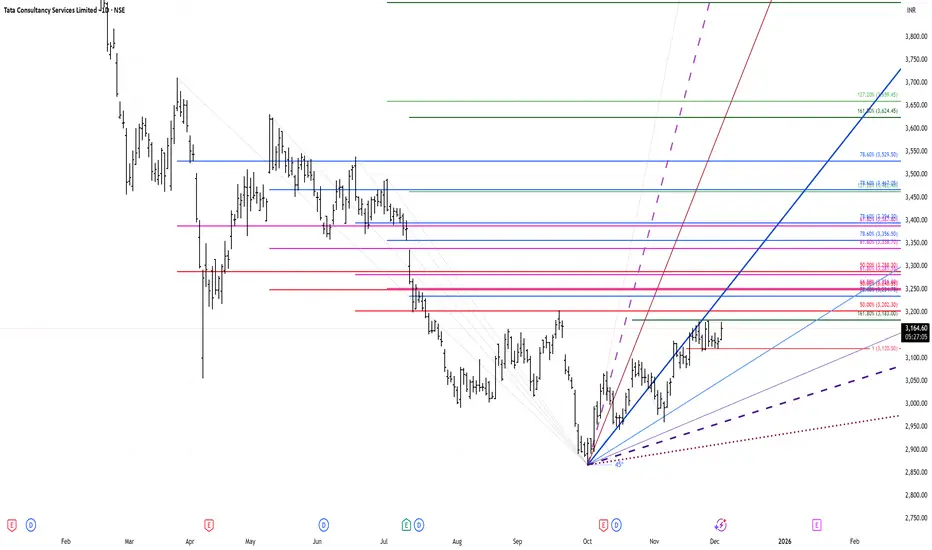
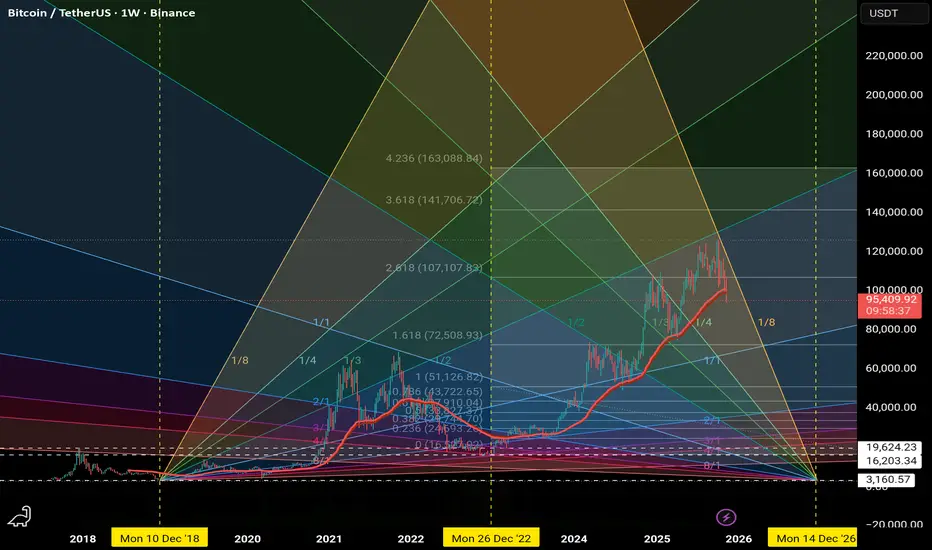
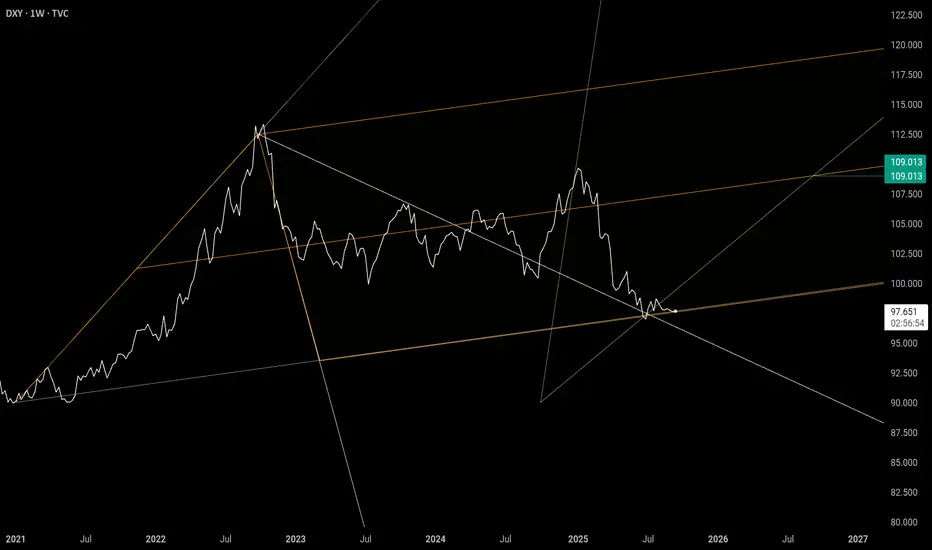
Gann Fan
EURUSD FRGNT Daily Forecast -Q4 | W47| D18 | Y25 |📅 Q4 | W47| D18 | Y25 |
📊 EURUSD FRGNT Daily Forecast
🔍 Analysis Approach:
I’m applying Smart Money Concepts, focusing on:
Identifying Points of Interest on the Higher Time Frames (HTFs) 🕰️
Using those POIs to define a clear trading range 📐
Refining those zones on Lower Time Frames (LTFs) 🔎
Waiting for a Break of Structure (BoS) for confirmation ✅
This method allows me to stay precise, disciplined, and aligned with the market narrative, rather than chasing price.
💡 My Motto:
"Capital managem
Key Gold Reversal Times for Daily Trading“Time-based analysis focuses on identifying the specific times when the market is likely to reverse or show strong movement. Instead of analyzing only price levels, it studies cycles, timing patterns, and repetitive market behaviors to predict when major or minor turning points may occur.”
BTC.D May not TOP until next September!Despite alt/BTC pairs looking battered
**Capitulation is likely not complete**
Most Altcoins remain in downtrends v BTC
Timeline:
2025: grind to 63-65%
2026 Final Push to 73%?
Altcoins to seek relief once this finally turns around.
You may be able to start DCA'ing BTC as early as next March in preparation to buy beaten down quality Alts...
focusing on ETH, SOL, and 2's that have usage... not simply clogging up the landscape of empty chains.
Ep. 4 - BTC Prediction By Channels, Secret Fib & Unique Gann FanBitcoin Price Prediction Using Channels, Fibonacci & Gann Fan | Signal & Structure Episode 4
In this concise yet powerful episode, we combine three advanced technical analysis tools to identify high-probability support zones for Bitcoin's current correction. This multi-confluence approach demonstrates how stacked logarithmic channels, Fibonacci retracements, and Gann fans work together to pinpoint critical price levels.
Techniques Demonstrated:
1. Channel Validation Theory
- Proves that any t
ETH Elliott wave analysis 13/10 /2025In my view, ETH has not yet completed its upside cycle, and the recent decline is simply part of wave (c) within wave (IV).
I believe we are currently in wave (5), specifically within wave 3 of that structure. The reason is that if waves 1 and 3 were corrective ABC structures, then wave C should not exceed 138.2% of wave A, otherwise it would invalidate the b-failure flat pattern—and this limit has already been exceeded, confirming the impulsive nature of the current move.
The Shark harmonic p
Continuation of the previous idea based on the Harmonious EnergyThe consolidation phase is coming to an end. The market structure is gradually moving into the next stage of the energy cycle, where a new flow direction is forming.
At the moment, I am observing a continuation of the energy movement with a noticeable manifestation of buyer strength. The key focus is on price behaviour near the resistance level — this is where it will become clear whether buyers will be able to maintain control and continue the upward momentum, or whether the market will enter
Trading idea based on the Harmonious Energy Flow (HEF) conceptAt the current stage, there is a clear manifestation of buyers’ strength, even though the market environment is changing rapidly without any significant price movement. This forms a state of consolidation, where energy is being accumulated for the next impulse.
According to the HEF concept, consolidation represents a transitional phase — the market is searching for balance before initiating a new wave of directional movement. My current expectation is focused on the moment of breakout from cons
Overview: BTCUSDT 7D overviewHere's a technical analysis of your BTC chart:
📊 **Chart Overview: BTCUSDT 7D (Weekly) Timeframe**
🎯 **Key Patterns Identified:**
**1. Cup & Handle Formation** ☕
- Large cup pattern formed from 2023-2024
- Handle currently forming in the consolidation zone
- Classic bullish continuation pattern
- Breakout target potentially above $150K based on cup depth
**2. Fibonacci Levels** 📐
- Price consolidated around 0.5 Fibonacci retracement (~$125K area)
- Strong resistance at 0.618 level
- Currentl
ETH Elliott wave analysis 1/10 /2025In my point of view , The wave (IV) is end and we are going to finish the wave (5).The new wave ①, which has surpassed the top of wave (4) with a strong impulse, indicates that the beginning of wave (V) has likely started. Wave (IV) appears to have formed a b-failure flat, where wave C slightly exceeded 132.8%. Based on the Butterfly harmonic pattern from the higher time frame ETH analysis, the target price is projected to be in the range of $5,900–$6,400.
An alternative count is that the recen
AUDJPY – SHORTA short position is proposed upon price rejection from the key resistance area. This area is defined by the confluence of the Supply Zone's POC level and a Dynamic Gann Resistance angle. The target is at the POC level within the next significant Demand Zone.
AUDJPY – SHORT
ENTRY PRICE - 98.150
SL - 99.400
TP - 94.400
Always follow the 6 Golden Rules of Money Management:
1. Protect your gains and never enter into a position without setting a stop loss.
2. Always trade with a Risk-Reward Ratio
BIT500: Prediction Markets — From Polymarket to InfoFiIn the dynamic crypto landscape of September 2025, prediction markets are evolving into powerful tools for aggregating information and speculation. Polymarket is experiencing explosive growth, with trading volume up 50% month-over-month, reaching $1.16 billion in June and $7.5 billion for the year. This reflects a shift from simple betting to InfoFi—"information finance," where markets not only forecast events but also generate valuable analytics. From BIT500, a leading analytics platform focuse
BTC Elliott wave analysis 9/16 /2025Is Bitcoin’s Cycle Ending, or Just Another Correction?
BTC made a new all-time high last month, followed by significant selling pressure. This raises the question: Has the BTC cycle ended, or is this just another corrective wave before another push higher?
In my view, BTC has already completed its cycle since the bear market ended in November 2022, based on the following factors:
1. Wave Structure Suggests Completion of Wave 5
From my primary scenario, the 5-wave cycle beginning after the No
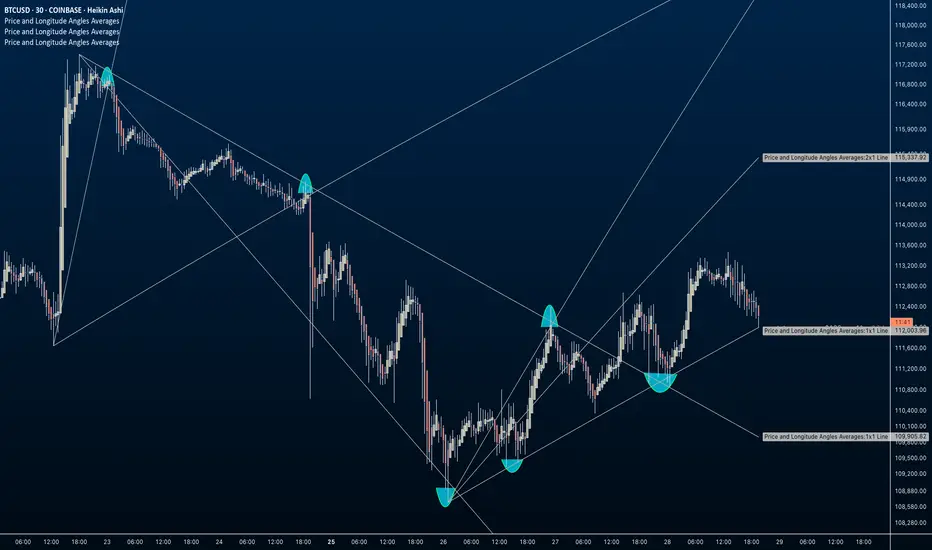
BTC: How to Setup Price and Longitude "Moon" AnglesChart: BTCUSD, 30m Heikin Ashi (UTC)
Indicator: Price and Longitude Angles (Open Source)
Attribution: Inspired by Patrick Mikula’s interpretation of Gann’s use of planetary longitude in market analysis. Fully open source for anyone to explore, test, or adapt.
This walkthrough demonstrates how to configure the script to study Moon longitude as price geometry. The aim is to provide a repeatable setup for observing how Moon angles from highs and lows can act as reference points for suppor
Euro dollar rollover at the ML & at resting on the edge of priceThere is plenty more going on via Gann MTF & Annual Forecast but technically on the forks the Euro should head to the new median line with approximately an 80% probability. If we get momentum on the sell off and later the new median line ( Downward Pitchfork ) gets breached decisively via a Zoom Bar/Retest, we may get all the way down to the second target as shown. looking for additional shorts on the lower TF. Cheers