H1 Bearish Retest From Supply
XAUUSD is trading around 4,143 after recovering from the recent liquidity sweep near 4,085–4,100. Short-term structure has improved with a fresh BOS, but price remains inside the broader H1 bearish channel, so the current rebound is still corrective until higher resistance is reclaimed.
Gold recovered modestly on Thursday after touching a two-month low, with spot bullion rising about 0.4% to $4,126.78. Elevated Treasury yields and the strong dollar remain key headwinds, although concerns over U
Ichimoku Cloud
H1 Major Demand Recovery Setup
XAUUSD is trading around 4,125 after extending the bearish leg into the 4,112–4,128 Demand / Reaction Zone. H1 remains under pressure beneath the descending trendline, but price is approaching deeper structural demand where a liquidity sweep could create a cleaner recovery setup.
Gold fell to a two-month low on Wednesday, with spot gold around $4,114, as a stronger U.S. dollar and elevated Treasury yields continued to pressure non-yielding bullion. Reuters
The latest FOMC minutes showed policym
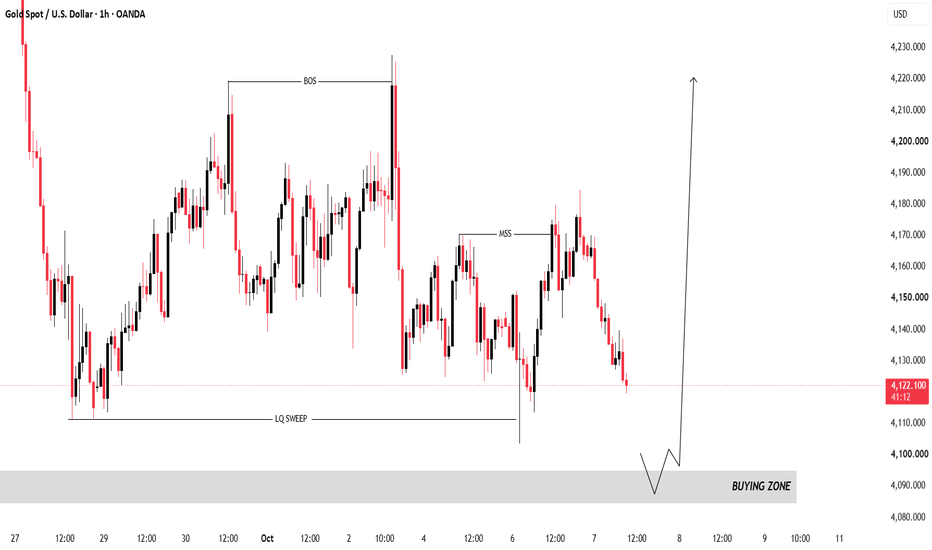
XAUUSD 1H: Liquidity Sweep + MSS — Watching the Demand ZoneGold is currently trading around 4,123 after rejecting from the 4,170–4,180 area. The chart shows a previous liquidity sweep near 4,110, followed by a bullish Market Structure Shift (MSS) around 4,170
The key area on the chart is the 4,090–4,105 demand/buying zone. If price revisits this region and shows a strong reaction, it could become an important area for studying a potential bullish continuation
Key Levels
- 4,090–4,105: Demand / reaction zone
- 4,110: Previous liquidity-sweep area
- 4,170
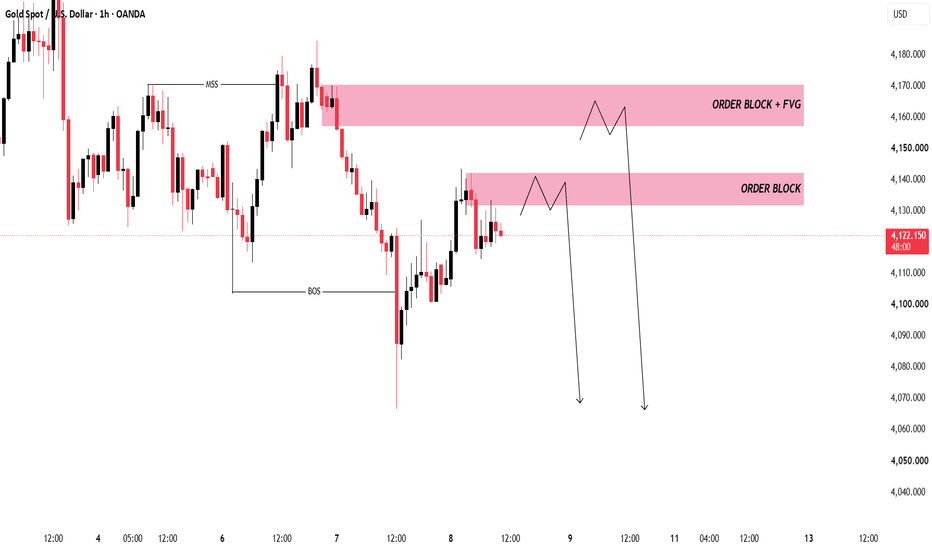
XAUUSD 1H: Bearish Reaction Zones After Market Structure ShiftGold is currently trading around 4,123 after recovering from the recent sell-side move near the 4,080–4,090 area. On the 1H chart, the broader structure remains important as price approaches two marked resistance areas.
The chart shows a previous MSS followed by a bearish BOS, while the current move appears to be a recovery into potential supply.
🔴 1H Order Block: 4,132–4,142
This is the first resistance area to monitor. A clear rejection from this zone could indicate that sellers are still defe
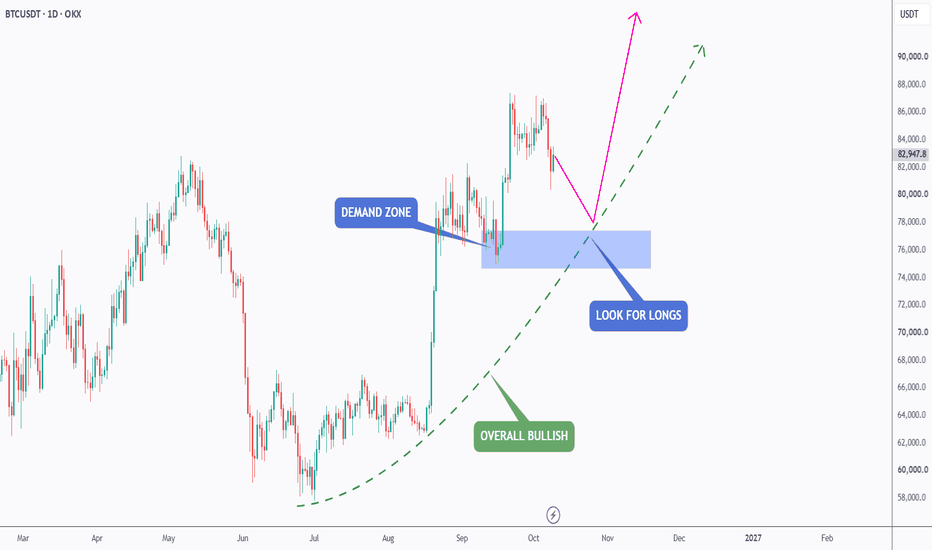
BTC – The Next Bullish Wave Starts Here?Bitcoin has been overall bullish, consistently forming higher highs and higher lows, reflecting the strength of the ongoing uptrend.
After its recent bullish impulse, BTC has entered a correction phase, which could offer another opportunity to join the prevailing trend.
🔵 Key Demand Zone: $75,000–$77,500
As BTC approaches this demand zone, which also aligns with the rising green trendline, we will be looking for trend-following buy setups on lower timeframes.
As long as this intersection hol
H1 Pullback Into Support Before RecoveryXAUUSD is trading around 4,160 after recovering from the lower boundary of the current H1 structure. Price has returned to the 4,150–4,164 Major Demand Zone, but the chart still suggests that a deeper liquidity pullback toward the lower support area may occur before a cleaner recovery develops.
The macro backdrop has turned more supportive for gold after the latest U.S. labor report. September nonfarm payrolls increased only 29K versus 90K expected, unemployment rose to 4.2% from 4.1%, and annua
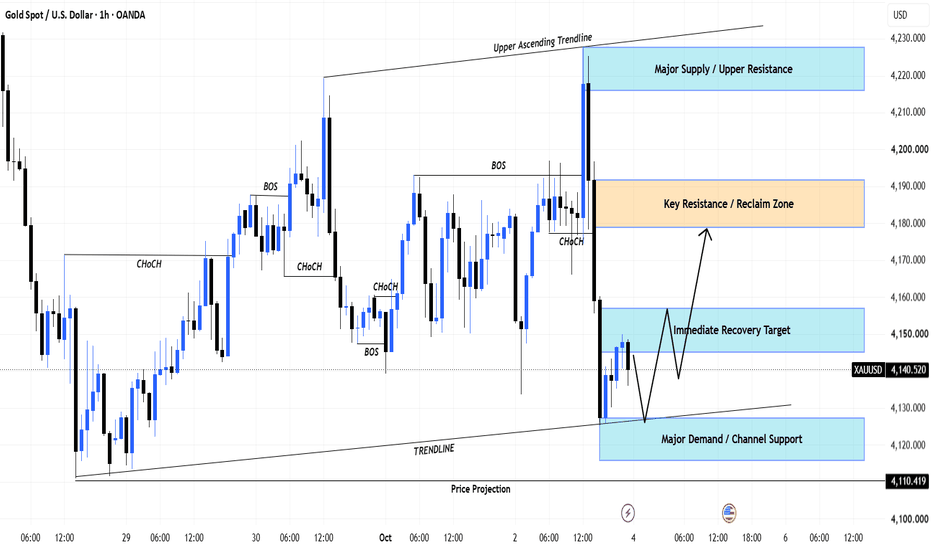
H1 Major Demand Recovery Toward Reclaim
XAUUSD is trading around 4,141 after a sharp rejection from the 4,215–4,225 upper supply area. Price has returned to the lower boundary of the current rising H1 structure, where the 4,118–4,128 Major Demand / Channel Support Zone becomes the key decision area.
The latest U.S. labor data weakened significantly. September nonfarm payrolls increased by only 29,000, versus roughly 90,000 expected, while unemployment held at 4.2%. That reduced expectations for another Fed hike at the October meeting
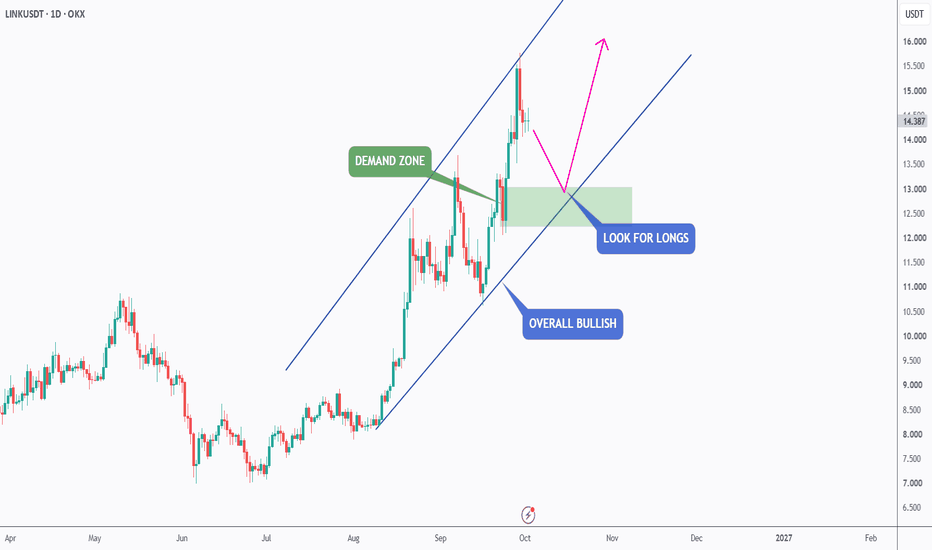
LINK – Bullish Trend, Key Intersection AheadLINK has been overall bullish, trading within the rising channel marked in blue.
Price is currently correcting and approaching a strong intersection of:
🔵 Lower bound of the rising channel
🟢 Key demand zone
As long as this intersection holds, the bullish structure remains intact, and we will be looking for trend-following long setups on lower timeframes.
A clear break below this intersection would weaken the bullish scenario and force us to reassess.
📌 The trend is bullish. Now we wait for t
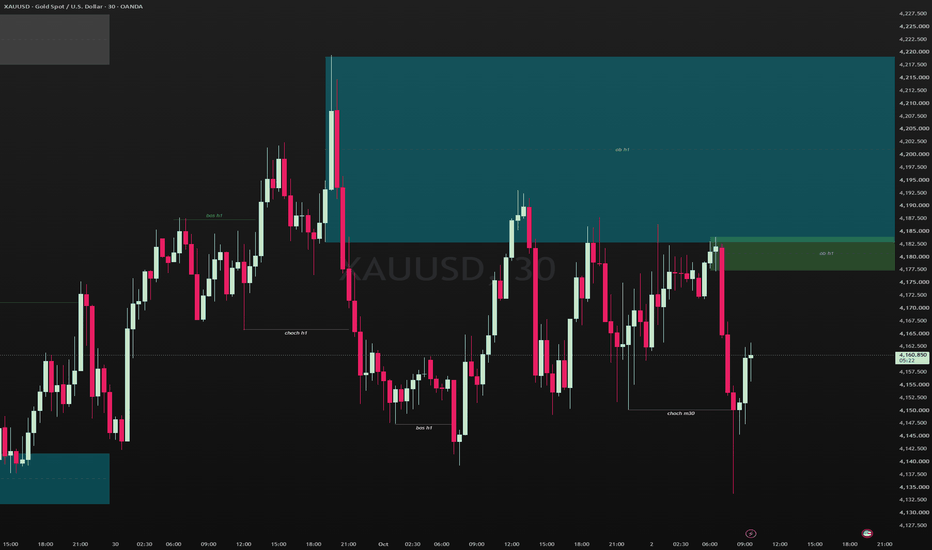
Trading Plan and Analysis - #XAUUSD 02/10/2026M30 Timeframe
Gold has had a highly eventful week with a significant shift in the macro backdrop. Following Wednesday's softer-than-expected PCE inflation print, market odds of a Fed rate hike in October dropped sharply from around 70% to below 40%, a major reversal in expectations within just a few days. Adding to that, the New York Fed President also commented that the Fed doesn't need to rush into another hike following this month's increase. These factors helped gold recover well from the 4
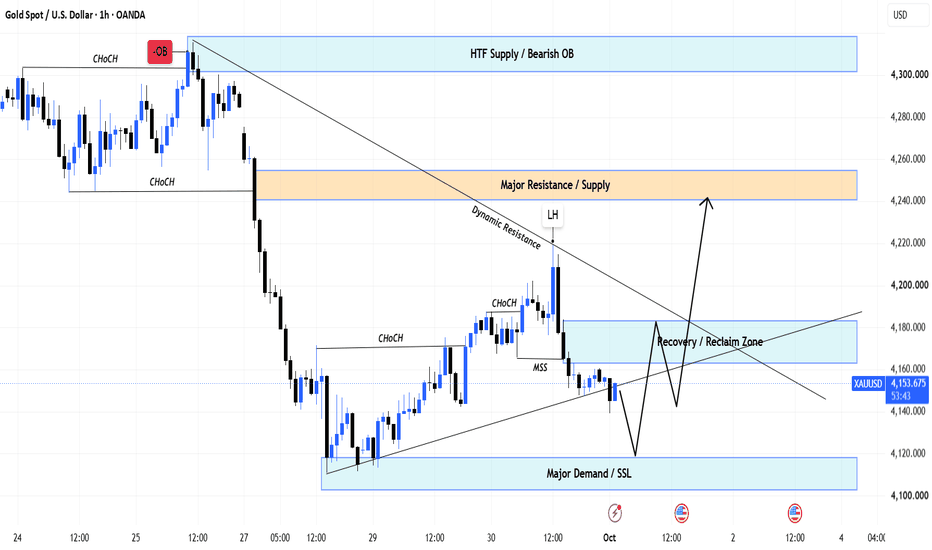
H1 Major Demand Recovery Setup
XAUUSD is trading around 4,144 after the latest recovery failed beneath the descending dynamic resistance and produced a fresh MSS lower. Price is now moving back toward the 4,105–4,120 Major Demand / SSL Zone, which becomes the key H1 decision area.
The macro picture is becoming more balanced for gold. August U.S. PCE inflation rose 0.3% MoM, below the 0.4% consensus, while annual core PCE was 3.0%. That softer print reduced the market-implied probability of an October Fed hike to roughly 39%,
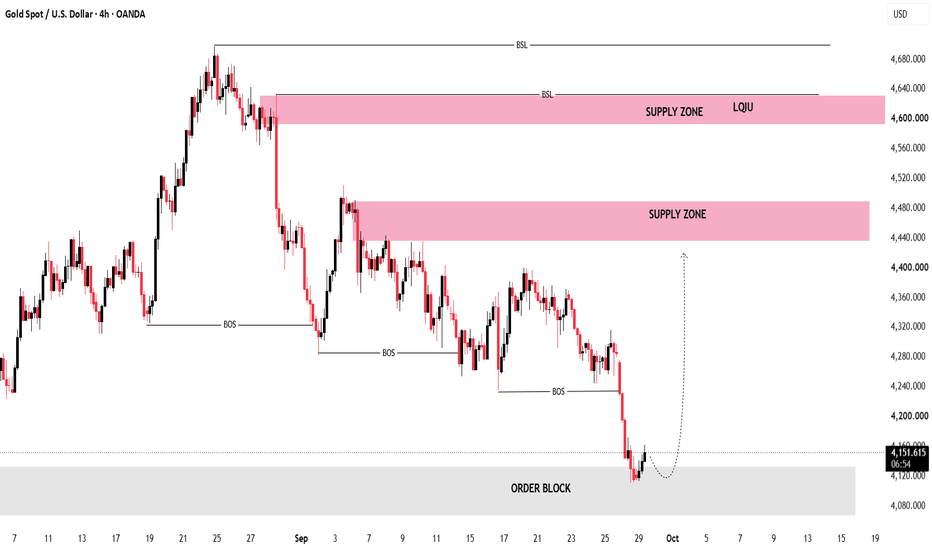
XAUUSD 4H — Market Structure & Liquidity AnalysisThe chart shows a bearish 4H structure, with multiple downside BOS levels and price currently reacting from the marked 4,080–4,150 Order Block / demand area.
Key observations
📉 Structure: Successive bearish breaks of structure indicate continued downside pressure.
🟨 Current area: Price has entered the 4,080–4,150 Order Block, where a reaction is possible.
💧 Liquidity: BSL is marked above the recent highs, while the current decline has taken price toward the lower liquidity area.
🔴 4,440–4,490:
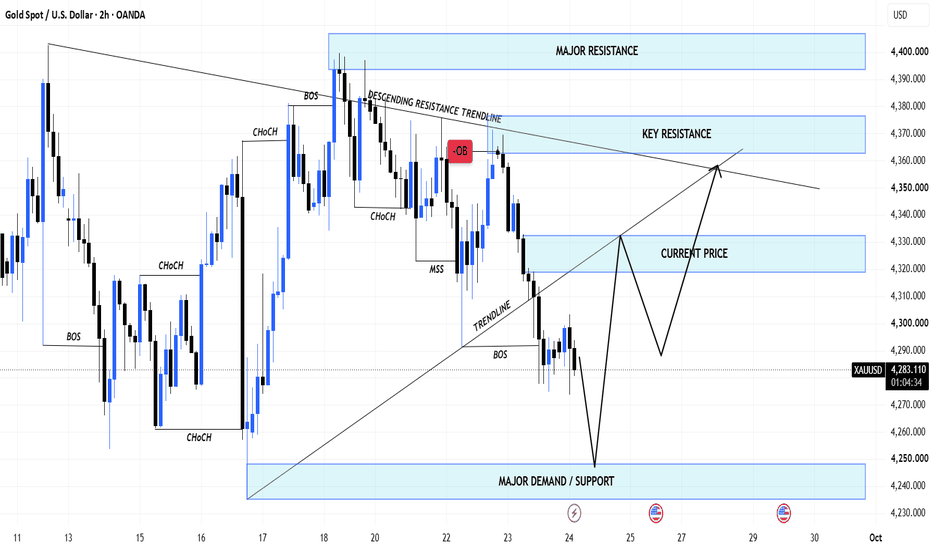
H2 Major Demand Recovery Setup
XAUUSD is trading around 4,284 after extending the bearish move below the rising intraday trendline. Price has already broken the 4,290 area and is moving closer to the deeper 4,235–4,250 Major Demand / Support Zone.
The macro backdrop remains a headwind for gold. Spot gold was around $4,282 early September 24 as markets increased expectations for additional Fed tightening. U.S. business activity reached its strongest level in more than five years, while persistent price pressure reinforced c
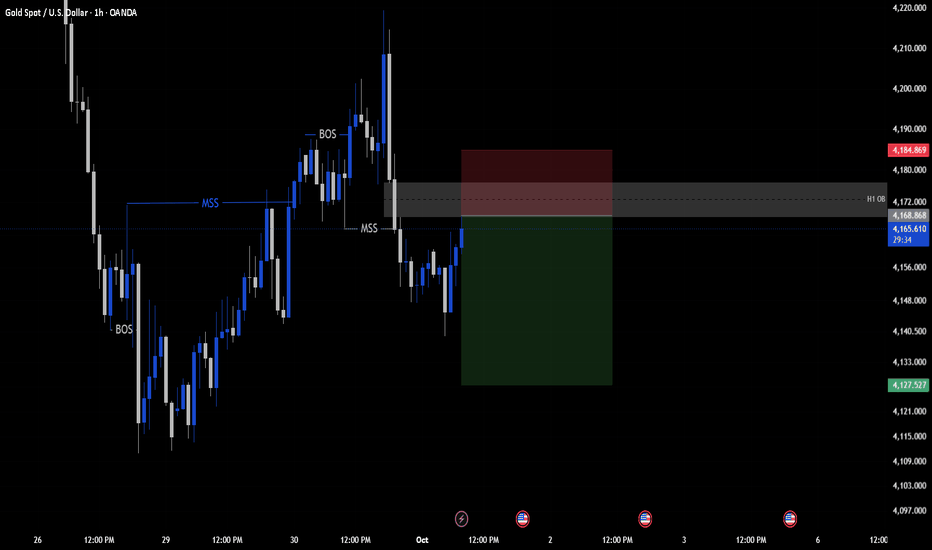
XAUUSD — H1 Bearish StructureGold has shifted its short-term market structure after the previous bullish expansion. Price formed multiple BOS during the upside move, but after reaching the higher area, the bullish sequence lost momentum and a Market Structure Shift (MSS) appeared.
Price is now retracing toward the H1 Order Block / supply zone around 4,168–4,176, which is the key area of interest on this chart. A bearish reaction from this zone would keep the downside structure technically valid, while sustained acceptance
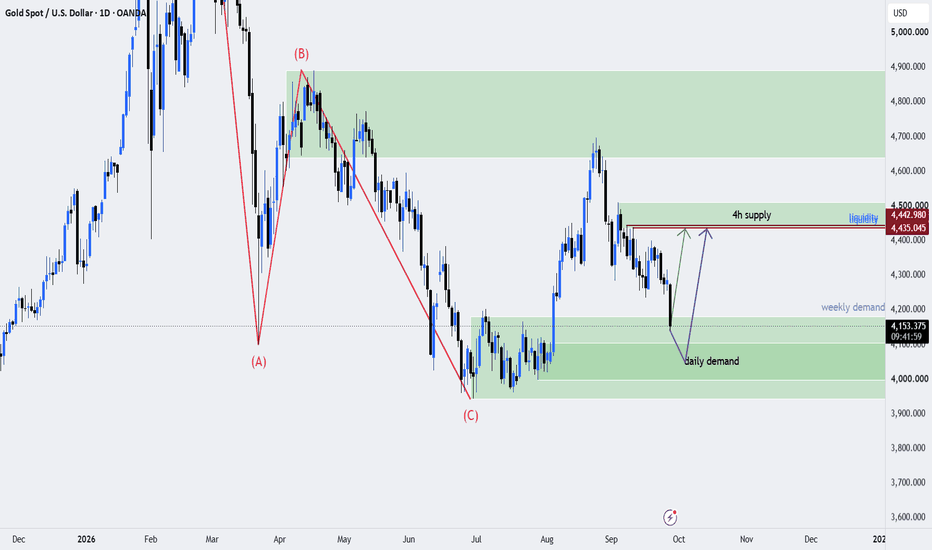
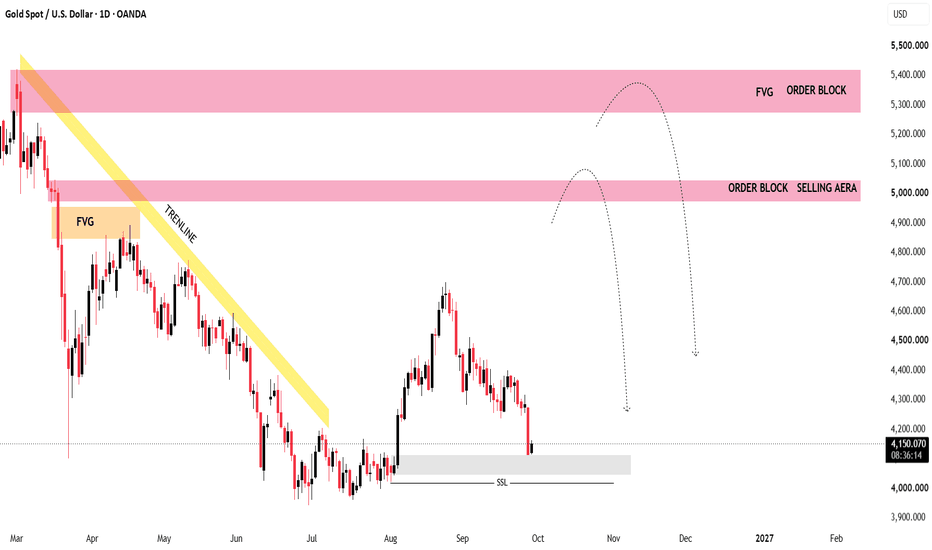
XAUUSD – Daily Chart AnalysisMarket Structure: The chart shows a broader bearish structure, with price respecting a descending trendline and forming lower highs. Recent price action is testing the 4,100–4,150 demand/liquidity area.
Key Levels / Zones:
🟩 4,100–4,150: Current support / SSL area
🔴 4,950–5,050: Bearish Order Block / selling area
🔴 5,280–5,400: Higher-timeframe FVG + Order Block
📉 Descending trendline remains an important structural reference
Potential Scenario:
If price holds the current support and establis
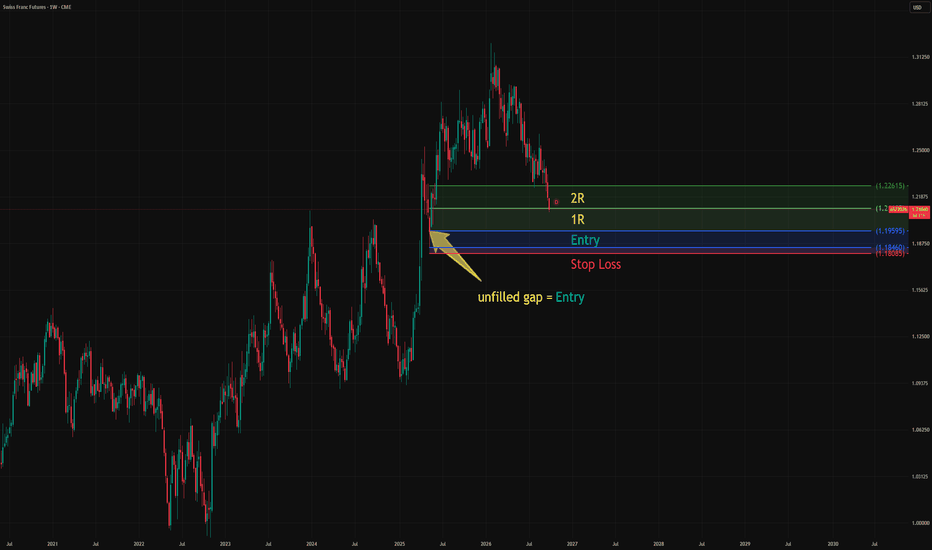
CHF-Future: strong demand & unfilled gap (USD/CHF mirror)Swiss Franc futures on the weekly. This one is not a technical trade - the trigger is valuation.
The chart is the CHF future (CME). Price is trading around 1.2098, and below the market sits an unfilled gap that has not been retested since it was left behind.
My reference points:
Entry: 1.19595 - the top of the unfilled gap; the band runs down to 1.18460
Stop: 1.18085, below the gap
First target: 1.21105 (1R)
Second target: 1.22615 (2R)
Why this one is different: there is no pattern h
USDJPY 4H: What Happens When Price Revisits This Supply Zone?Price is currently near an identified Supply Zone on the 4H timeframe.
This area is being observed because it originated from a strong imbalance following a Rally–Base–Drop structure. The zone is currently considered fresh , meaning price has not previously revisited the area after its formation.
Why is this zone technically significant?
A Rally–Base–Drop structure represents a sequence where price first moves upward, forms a relatively compact basing area, and then moves away sharply
XAUUSD: Bearish Continuation After Range Breakdown & RetestBy analyzing the #Gold chart on the H1 timeframe
📉 Market Context & Analysis:
After a period of consolidation (range), price broke down with strong bearish momentum, leaving behind clear supply imbalance. (4260$)
🔎 Trade Plan & Execution:
We are expecting a corrective pull-back into the premium Supply and demand Zone. Looking for lower timeframe confirmation (CHoCH / Liquidity Grab) inside the zone before taking a short position.
Traget: 4100 $
For now, this is a very important decision area
EURUSD 1H | Bearish Structure & Premium Supply ZonesEURUSD remains in a broader bearish structure on the 1H chart, while the latest recovery is approaching an area where sellers may become active
🔹 Price established multiple bearish BOS levels during the decline from the 1.1480–1.1490 area
🔹 The current rebound from the 1.1360–1.1370 region has produced a short-term bullish recovery
🔹 The 1.1440–1.1450 area is marked as an Order Block + FVG, making it an important zone to observe for a potential reaction
🔹 Above that, the 1.1470–1.1485 region
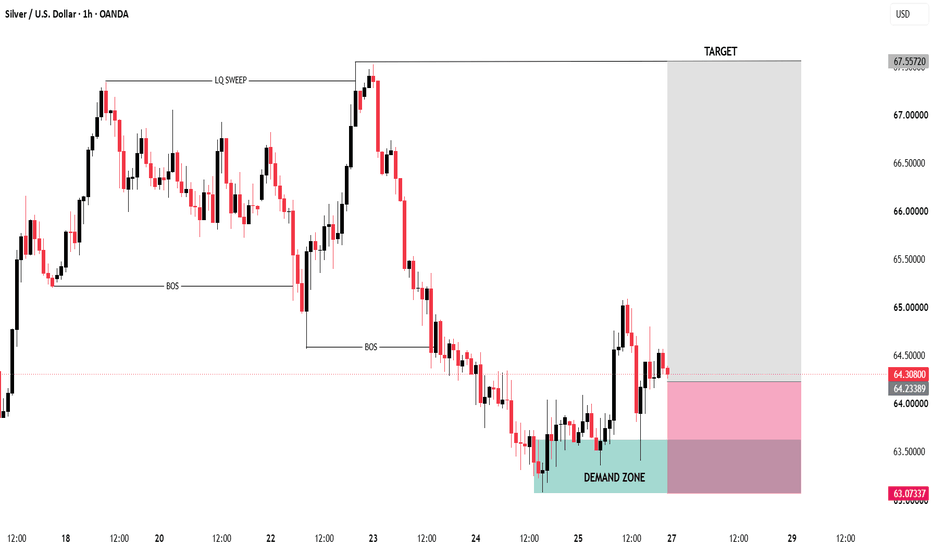
XAGUSD 1H | Liquidity Sweep & Demand Zone ReactionSilver is showing a clear bearish structure from the 67.50 area, with multiple lower highs and lower lows. However, the recent price action suggests a potential short-term structural recovery.
🔹 Price swept the previous liquidity around 67.30–67.50 before a strong bearish displacement.
🔹 The decline created successive BOS levels, confirming the prevailing bearish structure.
🔹 Price eventually reached the 63.30–63.60 demand zone, where selling pressure started to weaken.
🔹 From this zone, pri
CHFJPY – Bearish Trend, Key Intersection AheadCHFJPY has been overall bearish, with price continuing to respect the descending blue trendline.
After the latest bearish impulse, the pair is now recovering and approaching an important technical area.
📌 The key area to watch is the intersection between the supply zone around 199.50–201.00 and the descending trendline.
This confluence creates a strong area where sellers could step back in and resume the broader bearish move.
As long as this intersection holds as resistance, we will be looki
USDCHF – Bullish Trend, Strong Intersection AheadUSDCHF has been overall bullish, trading within the rising blue channel.
Price is currently in a correction phase and approaching an interesting area where the lower bound of the rising channel intersects with the green demand zone.
As long as this intersection holds, we will be looking for trend-following long setups, targeting a continuation of the broader bullish movement.
A clear break below both the demand zone and the lower trendline would weaken this bullish scenario.
📌 Bullish trend
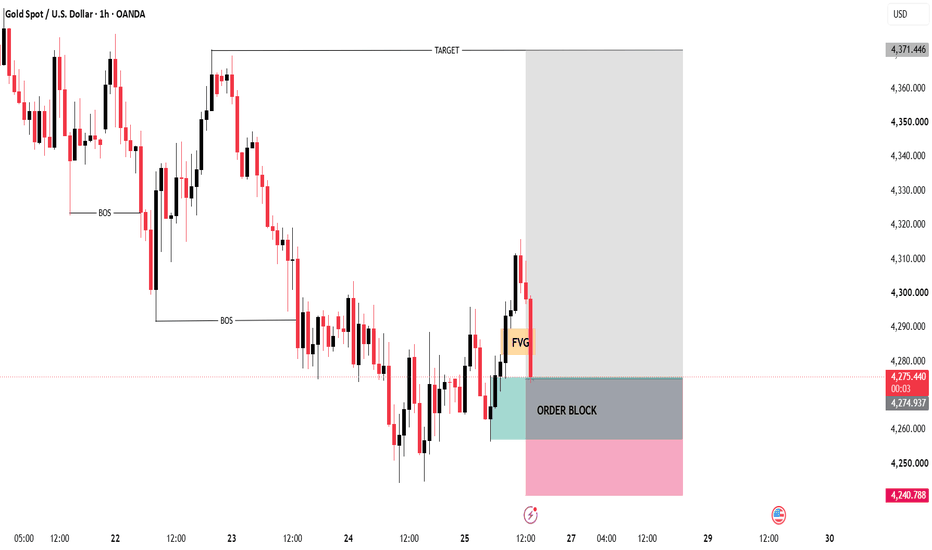
XAUUSD 1H: Bullish Reaction From Order BlockGold is currently trading around the 4,282 area after a strong bearish move. The chart shows multiple BOS levels, confirming the previous downside structure.
Price has now retraced into a marked 1H FVG / Order Block zone around 4,275–4,290. This area is important because it may act as a reaction zone if buyers continue to defend it.
🔹 Bullish scenario: If price holds the Order Block and reclaims the FVG with clear bullish displacement, the next upside areas can be monitored, with the chart-mar
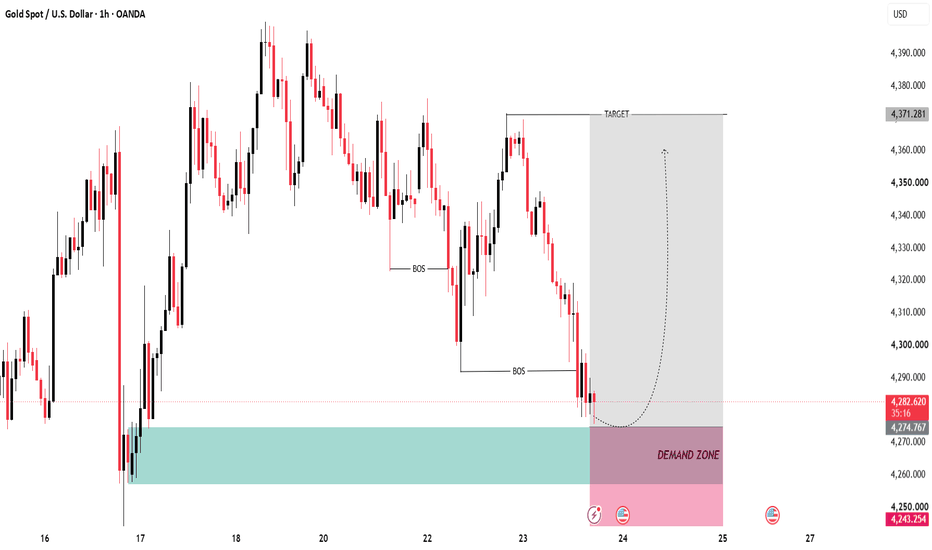
Gold 1H — Testing a Key Demand ZoneGold is currently moving lower after rejecting the 4,360–4,365 area and forming a sequence of lower highs and lower lows on the 1H chart
🔹 Current area: Price is approaching the marked demand zone around 4,258–4,275.
🔹 Market structure: Recent downside breaks show short-term bearish pressure
🔹 Key reaction zone: The demand area is where price previously showed strong buying interest
🔹 Upside structure: A sustained reaction from demand could bring the 4,320–4,350 region back into focus, with the