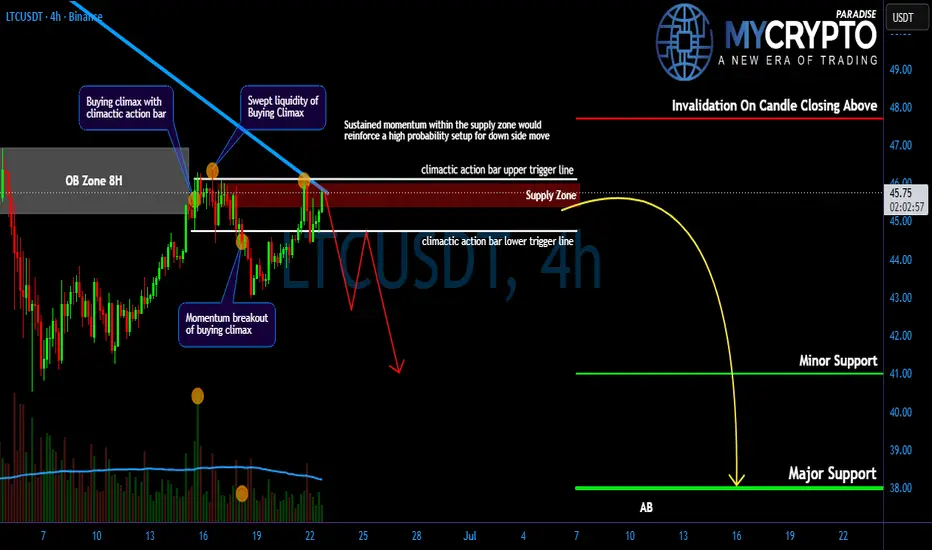
LTC Weakness: Is a Deeper Drop Next…!Yello Paradisers! Are you prepared for a potential sharp downside move on #LTC, or are you still calling this “just a healthy pullback” while smart money quietly distributes above you? At first glance, the structure may look harmless. But when we remove emotions and read the chart objectively, the story changes completely. This is not a random retracement. This is a high-risk zone where discipline matters more than opinions.
💎#LTC has clearly broken below its ascending support trend line and is
Ichimoku Cloud
Litecoin (LTCUSD) Shows Signs of a Potential Bottom FormationLitecoin has reached new lows near the 40 area within a five-wave bearish impulse, where we are now seeing some stabilization, which can be a signal for the bottom formation.
The recent recovery attempt from the lows is starting to show some constructive signs, as Litecoin may be developing a leading diagonal structure to the upside. This type of formation can often appear at the beginning of a larger reversal and may provide the first indication that sellers are losing control.
However, after
LTCUSDT - Bear Flag, Will Support Hold or Collapse?📈🔍 Technical Analysis – LTC/USDT (1D)
💰 Coin: NYSE:LTC #LTC
⏳ Time Frame: 1D
📉 Pattern: 🐻 Bear Flag
🎯 Bias: 🔴 Bearish Continuation
Litecoin is currently forming a 🐻 Bear Flag pattern on the 1D timeframe, one of the most common 📉 bearish continuation patterns that typically develops after a sharp sell-off (🚩 Flagpole). Following the strong downward impulse, the price has been moving gradually higher within an ascending channel (📈 Flag), indicating that this rally is more likely a 🔄 retracemen
Flat Ichimoku Levels: What They Are and Why They MatterFlat Ichimoku levels are horizontal areas created by flat segments of the Ichimoku lines. They bring structure to the chart by revealing equilibrium zones around which a trading hypothesis can be built.
1. What Is a Flat Ichimoku Level?
A flat Ichimoku level is an equilibrium level created when the midpoint used by an Ichimoku line remains unchanged. On the chart, it appears as a horizontal segment on one of the Ichimoku lines, such as the Tenkan-sen, Kijun-sen, Senkou Span A, or Senkou Span
LTC Rejection: Is the Next Move Lower…!Yello Paradisers! Are you prepared for a potential sharp downside move on #LTC, or are you still calling this “just a healthy pullback” while smart money quietly distributes above you? At first glance, the structure may look harmless. But when we remove emotions and read the chart objectively, the story changes completely. This is not a random retracement. This is a high-risk zone where discipline matters more than opinions.
💎#LTC has clearly respected the descending resistance trend-line and f
LTC is trying to build a bullish continuation setupCRYPTOCAP:LTC is trading at $45.73 and remains technically constructive above the key EMA stack. But this is still a compression phase, not a clean trend expansion, so we want confirmation before getting aggressive.
1. THE TECHNICAL REALITY 📉
• Price is above EMA20 at $45.47, EMA50 at $45.27, and EMA200 at $44.43
• The structure is still leaning bullish, but it’s trapped inside equilibrium
• Higher-low formation and bullish CHoCH suggest the downside rhythm is starting to shift
2. THE INDI
LTCUSD: The Death of a Legacy Narrative. Multi-Year Inverted HVF📉 🪙 🥶 📉
📉 🪙 🥶 📉
📉 🪙 🥶 📉
1. The Macro Structure:
An Inverted Volatility Trap.
When an asset fails to make higher macro highs over multiple market cycles, it’s not consolidation—it’s long-term distribution.
The Geometry: Looking at the weekly chart, the price action has carved out a massive Inverted Hunt Volatility Funnel bounded by declining peaks (Low 1, Low 2, L3) and a vulnerable ascending support trendline (High 1, High 2, H3).
The Resolution: The final compression at L3/H3 has resolved
Litecoin has maintained it's HVF and can STILL do a 10X...in the coming years.
This is a massive pattern formed over 7 years and I expect over performance of target 3 ultimately.
The day to week price action really does not matter when you have beautiful setups like this.
Keep stacking at these low prices.
@TheCryptoSniper
#LTC Ready for Short Term Recovery. Don't Miss This OpportunityYello, Paradisers! Is #Litecoin quietly building momentum for a powerful rally, or is the market preparing one final shakeout? Let's view #LTC trading setup:
💎#LTCUSDT is currently showing a constructive bullish structure on the 4H timeframe after successfully defending a key ascending support trendline. Earlier, #Litecoin experienced a liquidity sweep below the local lows, removing weak hands before quickly recovering back above support. This type of price action often signals that larger mark
Repeat Of 2017 About To Happen Dont Sleep On This OneIt looks to me that the long multi year downtrend for LTC BTC is finally coming to an end. Massive bullish divergence on the RSI that is extremely similar to the 2016-2017 divergences we had INCLUDING the massive scam wick. I think Litecoins time to shine is right around the corner and holders of Litecoin who have held through thick and thin will be massively rewarded and a "notable class of millionaires within our society" - Clif High. Not financial advice.
Litecoin Sell Trading Opportunity SpottedH1 - Strong bearish move.
No opposite signs.
Expecting pullback and bearish continuation until the two Fibonacci resistance zones hold.
If you enjoy this idea, don’t forget to LIKE 👍, FOLLOW ✅, SHARE 🙌, and COMMENT ✍! Drop your thoughts and charts below to keep the discussion going. Your support helps keep this content free and reach more people! 🚀
EURUSD: EUR Reaches a “Decision Zone”On the H4 timeframe, EURUSD is entering a crucial technical zone. After a recovery from the bottom around 1.1580, the price has approached the 1.1660–1.1676 area – the convergence point of the medium-term downtrend line, the Ichimoku cloud, and the supply zone that has repeatedly pushed the market downwards before.
Notably, although buyers have tried to push the price up quite strongly in the last two sessions, the upward momentum has slowed down significantly upon reaching the resistance zone.
LTC/USD weekly chart Litecoin is one of the most ignored charts in crypto right now.
That is exactly what makes it interesting.
Most people look at LTC and see an old coin, a tired narrative, and years of underperformance. That reaction is understandable. Litecoin has not been the loudest asset of this cycle. It has not been the favorite narrative. It has not produced the kind of emotional excitement that attracts short-term attention.
But charts do not care about popularity.
They care about structure. And the s
May 26 2026 Daily Insight We are currently at a neutral market state in all the pairs specially since DXY is trying its best to clarify which way the sentiment wants to move. But I tried to depict in how market is trying to behave so that we can wait for sniping options in the making.
I will update you on which pairs we should focus for an entry on today's market once NY session have its say.
LTC/USD — Accumulation → Manipulation → Expansion | SMC SetupLTC/USD 1H chart showing a textbook Smart Money cycle playing out.
After an extended markdown from the $60 highs, price entered a clear accumulation range between $53–$54.50. Smart Money built positions within this zone before sweeping the sell-side liquidity below the range — the classic manipulation phase (spring).
With the liquidity grab complete near $52.65, expecting a bullish expansion targeting the $59–$61 zone as the distribution leg plays out.
Key levels:
🔹 Accumulation range: $53.00 –
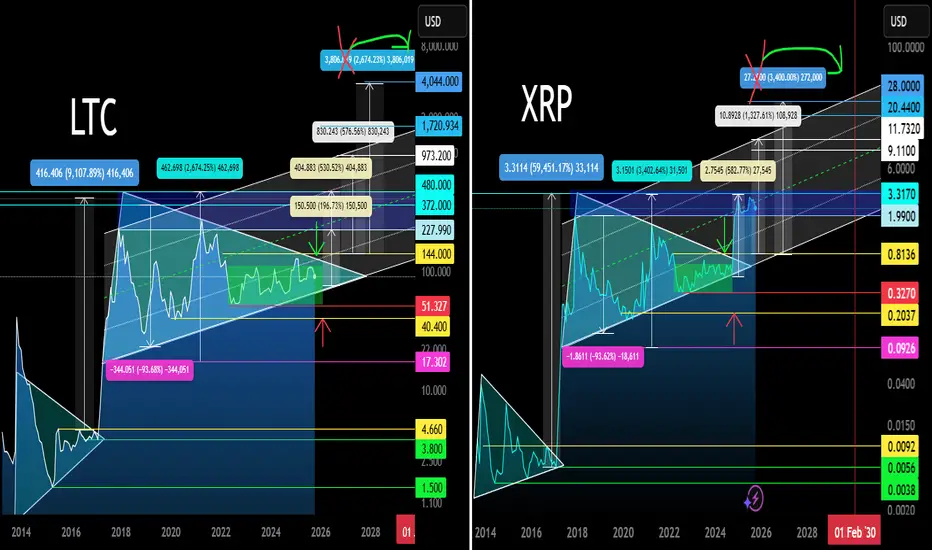
LTC and XRP Fractals. Main Trend. Triangles 10/18/2025Logarithm. 1-month time frame. Larger time frame for comparison and clarity. XRP is ahead of LTC by 1 year, where a breakout of the 7-year formation and the first wave of strong price growth (pump impulse of 500-600%) have already occurred. There will be 3 of them.
🟣⚠️ But, perhaps a retest of the formation's breakout zone, based on a super-fabulous and funny story, will happen very soon from a trend perspective. This is, more accurately, a retest of human intelligence worldwide, the clarity
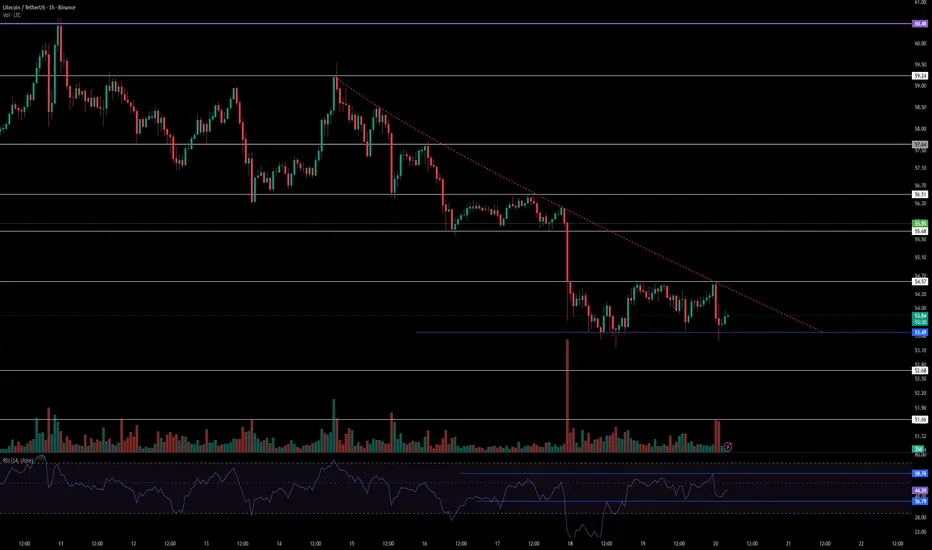
SatoshiFrame | LTC Waiting for Breakout👋🏻 Welcome to SatoshiFrame.
🤑 Litecoin is currently moving inside a compressed range on the 1-hour timeframe after a sharp bearish move. Price is trading between the $53.49 support and the $54.57 resistance zone, while the overall market structure still remains bearish under the dynamic trend resistance.
👍 The bullish scenario becomes more valid if buyers manage to break above the $54.57 resistance with strong momentum and rising buy volume. A confirmed breakout could open the path toward hig
Litecoin Short Term Sell IdeaH1 - Strong bearish move.
No opposite signs.
Expecting pullback and bearish continuation until the two Fibonacci resistance zones hold.
If you enjoy this idea, don’t forget to LIKE 👍, FOLLOW ✅, SHARE 🙌, and COMMENT ✍! Drop your thoughts and charts below to keep the discussion going. Your support helps keep this content free and reach more people! 🚀
SHORT IDEA ON LTC Quite a lot of time has passed. Since we are currently in a phase of Bitcoin decline, the coin has already pressed against the lower boundaries. This most likely means a downward breakout. We are looking at a range of $4-10, which is an extremely negative scenario in any case.
I am currently holding this coin on spot, but upon reaching $40 there will be a full liquidation and a switch to short. Accordingly, the potential of this coin is now under serious threat.
I have two positions: a spot long
#LTCUSDT analysis Give me some energy !!!#LTC
The price is moving within a descending channel on the 1-hour timeframe and has reached the lower boundary. It is now poised for a bounce and is expected to retest this boundary.
The Relative Strength Index (RSI) indicates a downward trend, which is likely to continue given the overbought conditions.
There is a key support zone in green at 53.00. The price has bounced off this zone several times, making it a strong support level.
The price is trending towards the 100-period moving avera
Scaled-up Invariance Manifest in LitecoinA rare scaled up invariance or fractal has manifested in Litecoin. It also means the chances for another scaled up fractal occurring up next is very high.
I've tried putting the two fractals on the price chart side by side with the circles emphasizing the repeat patterns. They're eerily similar.
The shortest fractal is 623 days and the longest is 3052 days or 4.89 times the smallest. The current fractal is 62 days away from being exactly 5 times the smallest. So there's 62 days at the latest t
Bullish Cup Formation with Ichimoku Breakout and ContinuationThe chart shows a transition from a previous bearish phase into a strong bullish recovery, forming a clear rounded cup structure that signals accumulation and trend reversal. Price initially declined sharply, creating a smooth curved bottom, which indicates weakening selling pressure and gradual buyer dominance.
Currently, price has broken above the Ichimoku Cloud, confirming a bullish shift in market sentiment. The cloud is starting to turn supportive, suggesting continuation rather than a sho
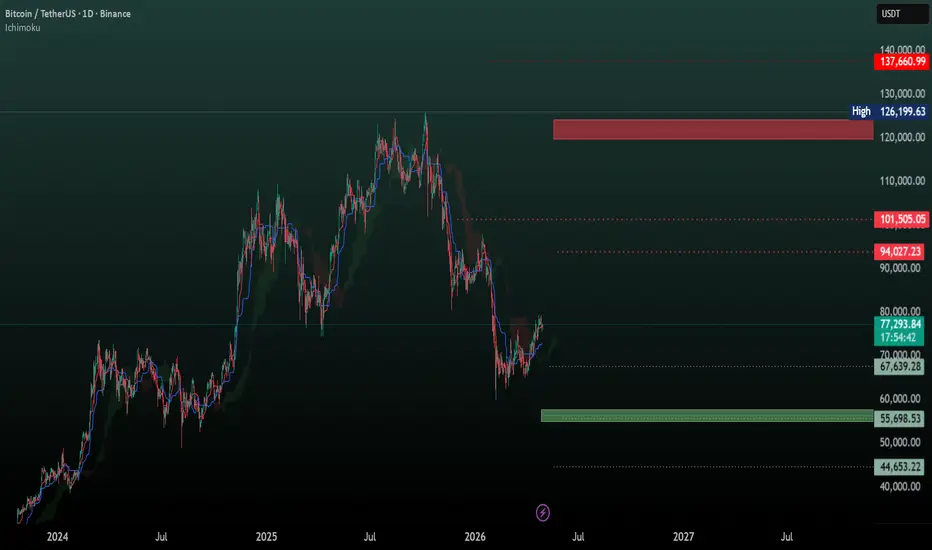
BTC DailyBased on last year's analysis Bitcoin has reached a resistance zone and has entered a correction phase
right now these two levels represent the most important support and resistance areas in the market:
Support zone: 55,600
Resistance zone: 120,000
All the mentioned levels are key zones for Bitcoin, and we trade based on them.
Based on the Ichimoku analysis, Bitcoin is trying to move toward the 94,000 resistance level.
The analysis will be updated after a breakout from any of the mentioned