Long
Long
Nifty Analysis EOD – March 5, 2026 – Thursday🟢 Nifty Analysis EOD – March 5, 2026 – Thursday 🔴
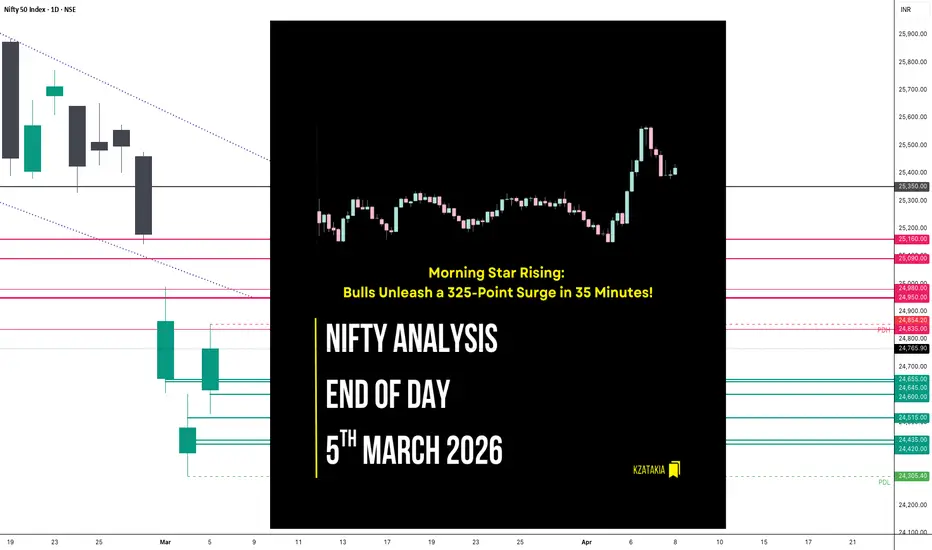
Morning Star Rising: Bulls Unleash a 325-Point Surge in 35 Minutes!
🗞 Nifty Summary
The Nifty started the day with a strong 143-point Gap Up. After an initial 35-point rise, the index dipped 122 points to complete the gap-filling process, establishing an Initial Balance (IB) range of 24,530 ~ 24,656. For most of the day, the market remained in a dull, range-bound state.
However, the true fireworks began at 2:15 PM. After testing the IBL, Nifty launched an explosive 325-point vertical rally in just 35 minutes, marking a day high of 24,854. In typical volatile fashion, the index surrendered 150 points from the peak around 3:00 PM to end the day at 24,737.45 (Adjusted close: 24,765.90), gaining +285.40 points (+1.17%).
Evaluating the last three sessions, the daily time frame is now forming a Morning Star candlestick pattern, which is a classic bullish reversal signal.
For the upcoming session, the opening price will be the most important factor. The 24,950 ~ 24,980 zone stands as a major resistance, while bulls need to sustain above 24,515 ~ 24,480 to continue building a base. This 500-point range will be the crucial battlefield tomorrow.
🛡 5 Min Intraday Chart with Levels
📉 Daily Time Frame Chart with Intraday Levels
🕯 Daily Candle Breakdown
Open: 24,615.95
High: 24,854.20
Low: 24,529.40
Close: 24,765.90
Change: +285.40 (+1.17%)
🏗️ Structure Breakdown
Type: Bullish candle with balanced wicks.
Range: ≈ 325 points — Very high volatility.
Body: ≈ 150 points — Strong bullish real body.
Upper Wick: ≈ 88 points — Profit booking seen after the 2:15 PM spike.
Lower Wick: ≈ 86 points — Successful gap-fill and defense of lower levels.
🛡 5 Min Intraday Chart
⚔️ Gladiator Strategy Update
ATR: 345.19
IB Range: 126.65 → Medium
Market Structure: Imbalanced
Trade Highlights:
13:41 Short Trade: Trailing SL Hit (Contra trade attempted at IBH rejection).
14:38 Long Trade: Target Hit (R:R 1:2.61) (Pattern + IBH Breakout).
Trade Summary:
Today required patience during the long sideways grind. I attempted a short trade at 1:41 PM which didn’t go far and hit the trailing stop. However, the system caught the massive afternoon expansion at 2:38 PM. Waiting for that confirmed IBH breakout was the right move, yielding a solid 1:2.61 reward as the market went into “beast mode.”
🧱 Support & Resistance Levels
Resistance Zones: 24,835 | 24,950 ~ 24,980
Support Zones: 24,655 ~ 24,645 | 24,600 | 24,515 | 24,435 ~ 24,420
🧠 Final Thoughts
“The Morning Star is shining, but the path ahead has hurdles.”
The reversal pattern on the daily chart is encouraging, but we cannot ignore the sharp 150-point drop at the end of the day. It shows that bears are still ready to sell at higher levels.
Tomorrow will likely be a volatile tug-of-war within the 500-point zone I mentioned. I will stay practical: let the IB form, watch the 24,835 level, and only trade when the structure is clear. Discipline over excitement.
✏️ Disclaimer
This is my personal digital diary and represents my own analysis and point of view. It is not financial advice; please consult a professional advisor before making any trading decisions. S&P500 Is at a Critical Support|The Week’s Direction Starts HereToday, I want to analyze the S&P 500 index( FX:SPX500 ) at the beginning of the new week, because it’s one of the key indices in financial markets. Several assets, especially in the crypto market like Bitcoin ( BINANCE:BTCUSDT ), show strong correlation with it—particularly when the S&P makes sharp moves. So, for analyzing crypto markets, it’s better to have an S&P 500 analysis too. Stay with me.
The S&P 500 is currently moving near a support zone($6,877-$6,837) and support lines. Last week, the monthly pivot point($6,917.5) acted as a good resistance level for this index.
From a classical technical analysis perspective, especially candlestick patterns, on the 4-hour timeframe, we can see bullish reversal patterns: Bullish Engulfing Candlestick Pattern_Morning Star Candlestick Pattern.
From an Elliott Wave theory perspective, it seems the S&P 500 has completed five main impulsive waves on higher timeframes, so we might NOT see new all-time highs. On the 4-hour chart, it looks like we’re in a short-term downward trend to complete wave C of a zigzag correction(ABC/5-3-5).
I expect the S&P 500 index, at least in the short term, to attack the monthly pivot point. If that breaks, the next target could be $6,937.
First Target: Monthly pivot point($6,917.5)
Second Target: $6,937
Third Target: Resistance lines
Stop Loss(SL): $6,832(Worst)
Points may shift as the market evolves
What’s your outlook on the S&P 500 for the week? Should we expect a bullish continuation or a drop in the U.S. stock market?
Note: In case of escalating Middle East tensions in the coming days, we might see a sudden drop in the S&P 500. Thus, managing capital is crucial, especially these days when markets fluctuate more on news and statements.
💡 Please respect each other's opinions and express agreement or disagreement politely.
📌 S&P 500 Index Analyze (SPX500USD), 4-hour time frame.
🛑 Always set a Stop Loss(SL) for every position you open.
✅ This is just my idea; I’d love to see your thoughts too!
🔥 If you find it helpful, please BOOST this post and share it with your friends.  Long
Long
Short 
 Long
Long
Mastering Trend Reversals: Morning & Evening Star PatternsSo, you're trying to nail those trend reversals? The Morning and Evening Star patterns are perfect for that. They show up right when the market’s about to shift, giving you a chance to get in before the move really takes off. Let’s break down how these setups work and why they’re such solid tools for traders like you.
🌅 Morning Star Pattern: The Bullish Reversal
The Morning Star pattern is one of the best ways to catch a trend reversal from bearish to bullish. It usually pops up after a downtrend, signaling that the market is about to make a move to the upside. It’s made up of three candles:
A long red candle that shows the market’s been selling off.
A small candle, often a Doji, that indicates indecision or a pause in the downtrend.
A big green candle that confirms the shift, showing buyers are taking control.
When you spot a Morning Star candlestick pattern, it’s a strong indication that the downtrend might be over and the bulls could be taking over. The third candle plays a crucial role here, confirming that the trend is likely reversing.
🌇 Evening Star Pattern: The Bearish Reversal
On the flip side, the Evening Star pattern is the bearish cousin of the Morning Star. It shows up after an uptrend and signals that the market is ready to start heading down. It also consists of three candles:
A long green candle that continues the uptrend.
A small candle, again often a Doji, that suggests the market’s losing momentum.
A big red candle that confirms the reversal, showing sellers are stepping in.
When you see the Evening Star candlestick pattern, it tells you that the market could be shifting from bullish to bearish. The third candle confirms that the reversal might be taking place.
💡 Trading the Star Patterns
Both the Morning Star trading pattern and Evening Star patterns are great for spotting potential trend reversals, but they shouldn't be relied on as the only signal. To increase the reliability of these patterns, consider confirming them with other indicators like RSI (Relative Strength Index) , MACD (Moving Average Convergence Divergence) , or volume analysis.
For example, if a Morning Star pattern candlestick appears and is followed by increasing volume, it adds strength to the reversal signal. Similarly, if the Evening Star shows up with an overbought RSI, it could provide further confirmation that the market is due for a pullback.
By using these additional tools, you can have more confidence in your analysis and make better-informed decisions.
📈 Why These Patterns Matter
The Morning Star and Evening Star patterns are powerful tools for identifying potential trend reversals. They give traders a visual cue that a market shift could be on the horizon, helping to spot potential turning points.
However, it’s crucial to make your trading decisions based on a combination of factors and not rely solely on these patterns. Always make sure to consider the broader market context and other technical indicators before acting on any pattern.  Education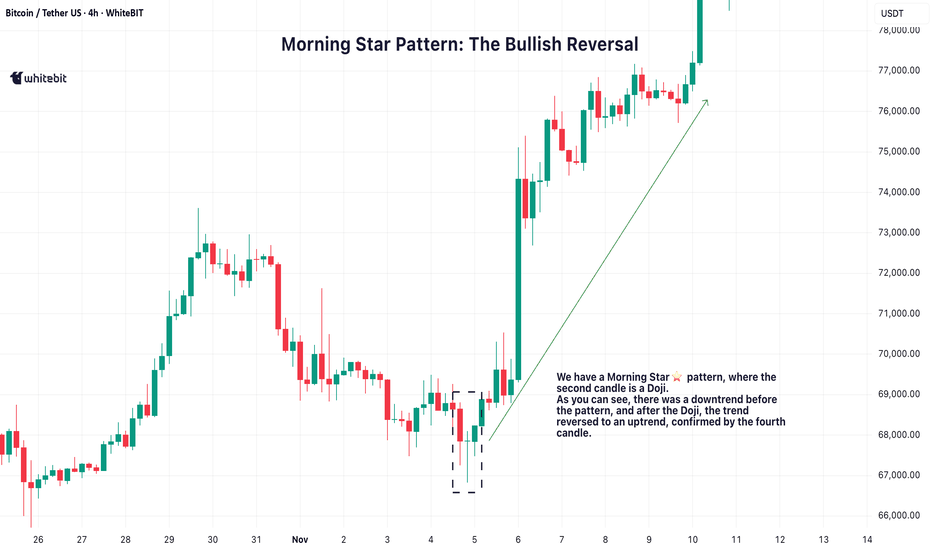
 Long
Long
Morningstar's moat threatened by LLMsMorningstar has been a quiet compounder for decades. Built on data, research and ratings, it carved a niche as the go-to source for fund analysis and financial information. The problem now is that most of its earnings still come from information services, licensing contracts and analytics.
AI can scrape, organise and summarise financial information at near zero cost, which puts real pressure on Morningstar’s ability to charge premium prices for data and insight.
The business is also overwhelmingly B2B. Its customers are asset managers, advisers and institutions. That looks sticky on the surface, but it also means the buyer is highly cost-sensitive.
If a large asset manager can replace Morningstar data with an internal AI solution or a cheaper competitor, they will. Once a few make the switch, pressure on pricing and renewals will cascade through the client base.
Then comes the talent question. Morningstar is built on domain expertise—analysts, ratings committees, sector specialists. But the new economy runs on AI engineers, data scientists and model builders. Big Tech and hedge funds pay top dollar for those skills. It isn’t clear Morningstar can compete.
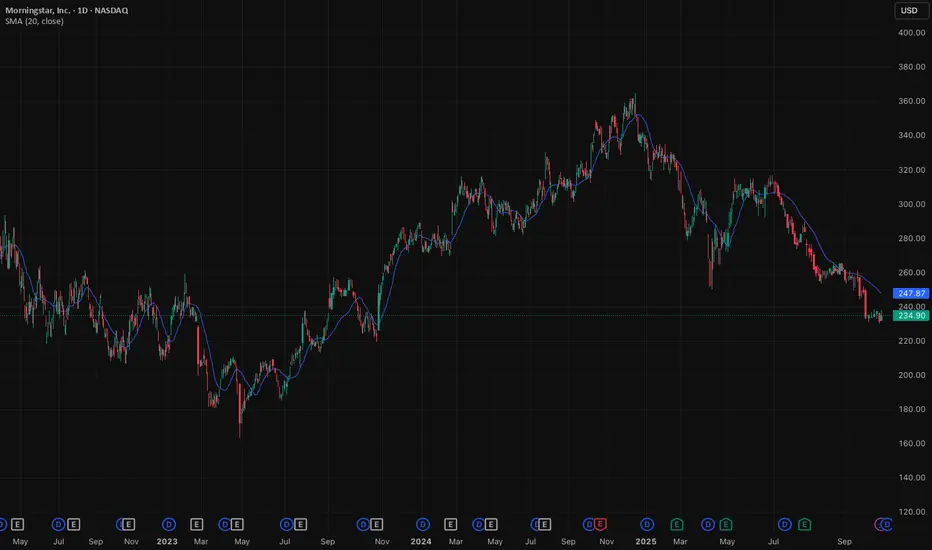
If it can’t, it risks slipping into irrelevance just as the market is pricing it like a durable franchise. That gap is the bearish case, especially having recently breached its 200-day moving average and with a PE ratio that is still around 24-25x.
The forecasts provided herein are intended for informational purposes only and should not be construed as guarantees of future performance. This is an example only to enhance a consumer's understanding of the strategy being described above and is not to be taken as Blueberry Markets providing personal advice. Short 
 Education
Mastering bullish candlestick patterns - How to use it!In this guide, we will explore some of the most important bullish candlestick patterns used in technical analysis. These patterns are essential tools for traders and investors who want to better understand market sentiment and identify potential reversal points where prices may start moving upward.
What will be explained:
- What are bullish candlestick patterns?
- What is the hammer?
- What is the inverted hammer?
- What is the dragonfly doji?
- What is the bullish engulfing?
- What is the morning star?
- What is the three white soldiers?
- How to use bullish candlestick patterns in trading?
What are bullish candlestick patterns?
Bullish candlestick patterns are specific formations on a candlestick chart that signal a potential reversal from a downtrend to an uptrend. These patterns are used by traders and investors to identify moments when the market sentiment may be shifting from bearish to bullish. Recognizing these patterns can help traders time their entries and make more informed decisions based on price action and market psychology. While no single pattern guarantees success, they can provide valuable clues when combined with other forms of analysis such as support and resistance, trendlines, and volume.
What is the Hammer?
The Hammer is a single-candle bullish reversal pattern that typically appears at the bottom of a downtrend. It has a small real body located at the upper end of the trading range, with a long lower shadow and little to no upper shadow. The long lower wick indicates that sellers drove the price lower during the session, but buyers stepped in strongly and pushed the price back up near the opening level by the close. This shift in momentum suggests that the downtrend could be coming to an end, and a bullish move might follow.
What is the Inverted Hammer?
The Inverted Hammer is another single-candle bullish pattern that also appears after a downtrend. It has a small body near the lower end of the candle, a long upper shadow, and little to no lower shadow. This pattern shows that buyers attempted to push the price higher, but sellers managed to bring it back down before the close. Despite the failure to hold higher levels, the buying pressure indicates a possible reversal in momentum. Traders usually look for confirmation in the next candle, such as a strong bullish candle, before acting on the signal.
What is the Dragonfly Doji?
The Dragonfly Doji is a special type of candlestick that often indicates a potential bullish reversal when it appears at the bottom of a downtrend. It forms when the open, high, and close prices are all roughly the same, and there is a long lower shadow. This pattern shows that sellers dominated early in the session, pushing prices significantly lower, but buyers regained control and drove the price back up by the end of the session. The strong recovery within a single period suggests that the selling pressure may be exhausted and a bullish reversal could be imminent.
What is the Bullish Engulfing?
The Bullish Engulfing pattern consists of two candles and is a strong indication of a reversal. The first candle is bearish, and the second is a larger bullish candle that completely engulfs the body of the first one. This pattern appears after a downtrend and reflects a shift in control from sellers to buyers. The bullish candle’s large body shows strong buying interest that overpowers the previous session’s selling. A Bullish Engulfing pattern is even more significant if it occurs near a key support level, and it often signals the beginning of a potential upward move.
What is the Morning Star?
The Morning Star is a three-candle bullish reversal pattern that occurs after a downtrend. The first candle is a long bearish one, followed by a small-bodied candle (which can be bullish, bearish, or a doji), indicating indecision in the market. The third candle is a strong bullish candle that closes well into the body of the first candle. This formation shows a transition from selling pressure to buying interest. The Morning Star is a reliable signal of a shift in momentum, especially when confirmed by high volume or a breakout from a resistance level.
What is the Three White Soldiers?
The Three White Soldiers pattern is a powerful bullish reversal signal made up of three consecutive long-bodied bullish candles. Each candle opens within the previous candle’s real body and closes near or at its high, showing consistent buying pressure. This pattern often appears after a prolonged downtrend or a period of consolidation and reflects strong and sustained buying interest. The Three White Soldiers suggest that buyers are firmly in control, and the market may continue moving upward in the near term.
How to use bullish candlestick patterns in trading?
To effectively use bullish candlestick patterns in trading, it’s important not to rely on them in isolation. While these patterns can signal potential reversals, they work best when combined with other technical tools such as support and resistance levels, moving averages, trendlines, and volume analysis. Traders should also wait for confirmation after the pattern forms, such as a strong follow-through candle or a break above a resistance level, before entering a trade. Risk management is crucial—always use stop-loss orders to protect against false signals, and consider the broader market trend to increase the probability of success. By integrating candlestick analysis into a comprehensive trading strategy, traders can improve their timing and increase their chances of making profitable decisions.
Thanks for your support. If you enjoyed this analysis, make sure to follow me so you don't miss the next one. And if you found it helpful, feel free to drop a like 👍 and leave a comment 💬, I’d love to hear your thoughts! Education 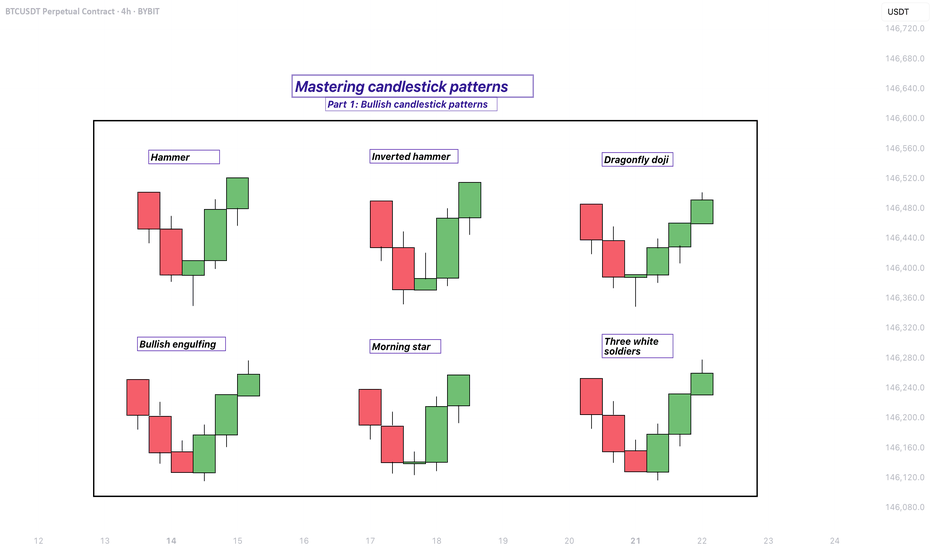
What Is a Morning Star Pattern & How Can You Use It in Trading?What Is a Morning Star Pattern, and How Can You Use It in Trading?
The morning star candlestick is a popular price action pattern that technical analysts and traders use to identify potential trading opportunities. It indicates a reversal from a bearish to a bullish trend and is a valuable addition to any trader's toolkit. In this article, we will cover all the technical aspects of the morning star candlestick pattern.
What Is the Morning Star Candlestick Pattern?
The morning star in technical analysis is a reversal formation that appears at the end of a downtrend and signals a trend reversal. It consists of three candles.
To identify it on the chart, you should look for the following:
1. Downtrend: The market should be in a downtrend, and the first candle should be long and bearish.
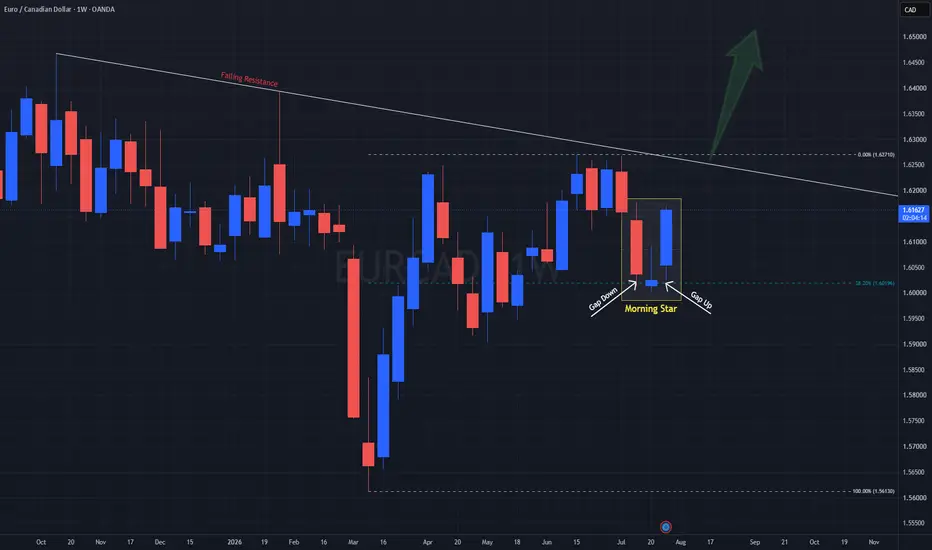
2. Indecision: The second candle is usually expected to have a gap down, but gaps are uncommon in forex. Therefore, a small-bodied candle is considered sufficient. It's worth noting it can be either bullish or bearish, but if it’s bullish, the signal is stronger.
3. Significant increase: The third candle should be strong and bullish and close above the midpoint of the first bearish one. If it forms with a gap up, the buy signal is considered stronger.
When Morning Star Candlestick Patterns Occur
Traders can identify the morning star candlestick pattern in stocks, forex pairs, commodities, and cryptocurrencies*. It may also be observed across various timeframes, from minutes to weeks.
Generally speaking, a morning star pattern can be considered more reliable when it appears on a higher timeframe. For instance, a morning star candlestick pattern has more significance when it occurs over three days vs three minutes, given the increased amount of price action and market participation reflected over longer periods.
Psychology Behind the Pattern
The morning star reversal pattern reflects a shift in market sentiment from bearish to bullish. Initially, a strong bearish candle indicates prevailing selling pressure. The second candle, with its small body, suggests indecision as the market stabilises and neither bulls nor bears dominate. This pause indicates that sellers are losing momentum. The third morning star candle, a strong bullish one, confirms the shift as buyers take control, driving prices higher. This pattern signals that the downtrend is likely exhausted, and a potential reversal is underway due to increasing buyer confidence.
Trading with the Morning Star
Traders can use the following steps to trade this setup:
1. Identify the setup: Look for a setup on the chart formed after a solid downtrend.
2. Confirmation: After identifying the formation, traders should confirm it before entering a long position.
3. Enter a long position: Consider entering a long position once the formation is confirmed.
4. Determine a take-profit target: Although candlesticks don’t provide specific entry and exit points, traders may consider the closest resistance level to take potential profit.
5. Monitor the trade: Continuously monitor the trade and adjust the stop-loss and take-profit levels as needed based on market conditions.
What Is the Morning Star Candlestick Strategy?
The morning star trading strategy leverages the formation's ability to signal a bullish reversal after a downtrend. The formation's reliability increases when it occurs at a support level and is confirmed by a momentum indicator like the RSI or MACD.
Entry:
- Traders look for the full morning star to form at a support level.
- They then look for a confirmatory bullish signal from a momentum indicator, such as RSI showing oversold conditions, a bullish MACD crossover, or a bullish divergence in either.
- Traders may wait for additional confirmation, like RSI moving back above 30, or enter on the close of the third candle in the pattern.
Stop Loss:
- A stop loss might be set below the swing low of the setup.
- Alternatively, traders may place the stop loss beyond the lower boundary of the established support level.
Take Profit:
- Profits might be taken at a predetermined risk-reward ratio, like 2:1 or 3:1.
- Traders also often aim for an opposing resistance level where a further reversal might occur.
Morning Star and Other Formations
Traders should not confuse the morning star candle formation with other formations, such as the evening star, which is the complete opposite.
Doji Morning Star
In a traditional morning star reversal pattern, the candle that appears in the middle of the formation has a small real body, meaning there is a clear difference between the opening and closing prices.
In a morning doji star formation, the second candlestick has characteristics of a doji, where the opening and closing prices are very close to each other, resulting in a very small real body. This reflects the indecision as neither bulls nor bears can take control of the market.
The doji setup is less common than the traditional formation, but it still signals a potential upward movement after a prolonged downtrend.
Evening Star
In contrast to a morning setup, an evening star is a bearish setup occurring after an uptrend. It also consists of three candles – a long bullish one, a small-body one (it can also be a doji), and a long bearish one that closes below the midpoint of the first bullish candle. This suggests that the market is about to turn down.
Benefits and Limitations of the Morning Star Candle
The morning star is a useful tool for traders seeking to identify potential market reversals, but it does come with some benefits and limitations.
Benefits
- Strong Reversal Signal: Indicates a bullish reversal after a downtrend, helping traders anticipate upward moves.
- Broad Applicability: Effective across various financial instruments such as forex, stocks, commodities, and cryptocurrencies*.
- Timeframe Flexibility: It can be observed on different timeframes, from intraday to weekly charts.
Limitations
- False Signals: Like all patterns, it can produce false signals, especially in volatile markets.
- Confirmation Needed: A morning star pattern entry requires confirmation from additional indicators or formations to improve accuracy.
- Experience Required: Identifying the formation correctly and interpreting its signals requires experience and a good understanding of price action.
Final Thoughts
While candlestick formations such as the morning star can be useful for traders to identify potential trading opportunities, it is crucial to remember that they are not foolproof and should not be the sole choice of market participants when making their trading decisions. Traders should also incorporate technical indicators and develop risk management techniques to potentially minimise losses.
FAQ
What Is a Morning Star in Trading?
The meaning of a morning star in trading refers to a bullish reversal formation consisting of three candles. It appears at the end of a downtrend, indicating a potential shift to an uptrend. The setup includes a long bearish candle, a small-bodied candle, and a long bullish candle.
Is the Morning Star Bullish or Bearish?
It is a bullish candlestick pattern that indicates a potential reversal from a downtrend to an uptrend in the market. It suggests that the selling pressure is subsiding, and buying pressure is beginning to take over.
What Does the Morning Star Pattern Indicate?
It is a three-candle price action, often indicating a bullish reversal in the market. It suggests that selling pressure has been exhausted, and buyers are starting to gain control of the market.
How Do You Read the Morning Star Pattern?
To read the morning star formation, traders should look for the following characteristics: a long bearish candle formed in a solid downtrend and followed by a bullish or bearish candle with a small real body, which in turn is followed by a long bullish candle closing above the midpoint of the first one.
What Is the Opposite of Morning Star?
The opposite of a morning star is the evening star, a bearish reversal pattern. It appears at the end of an uptrend, signalling a potential shift to a downtrend. The morning and evening stars are similar, except the latter mirrors the former, consisting of a long bullish candle, a small-bodied candle, and a long bearish candle.
*Important: At FXOpen UK, Cryptocurrency trading via CFDs is only available to our Professional clients. They are not available for trading by Retail clients. To find out more information about how this may affect you, please get in touch with our team.
This article represents the opinion of the Companies operating under the FXOpen brand only. It is not to be construed as an offer, solicitation, or recommendation with respect to products and services provided by the Companies operating under the FXOpen brand, nor is it to be considered financial advice.

 Long
Long

 Long
Long