Rectangle
MarketBreakdown | EURUSD, USDJPY, EURAUD, EURCHF
Here are the updates & outlook for multiple instruments in my watch list.
1️⃣ #EURUSD daily time frame 🇪🇺🇺🇸
The market is trading within a wide horizontal parallel channel.
The price is currently approaching its upper boundary.
I expect a pullback from it.
Alternatively, its breakout and a daily candle close above will provide a strong bullish signal.
2️⃣ #USDJPY daily time frame 🇺🇸🇯🇵
The market is consolidating within a horizontal range.
I expect a continuation of sideways price a
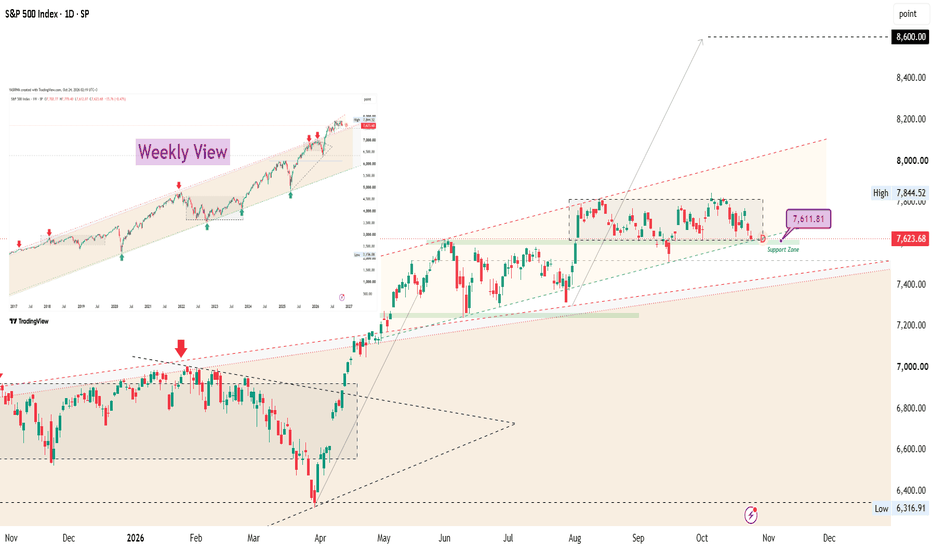
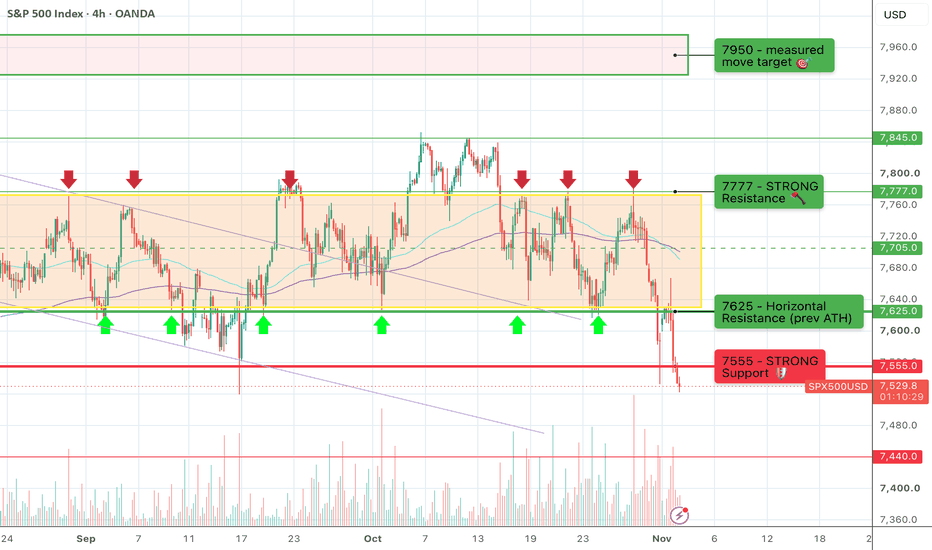
SPX500: 7555 — The Final Battleground Before Elections!Hello everyone!☀️🌴
For the second consecutive post, I find myself starting with the words “unfortunately for the bulls…”
Unfortunately for the bulls, the 7625 level eventually failed to hold ⚰️⚰️⚰️, despite a very confident bounce and a quick move toward the upper boundary of the 7625–7777 trading range, with a local high at 7791.
Ultimately, price followed the bearish scenario: “If the bears manage to push price below 7625, we could see a drop toward 7555.”
The first reaction at 7555 cam
XAUUSD Breakdown Momentum: Will the 3,905 Zone Reject RecoveryGold has experienced an aggressive decline, with sellers pushing price below the previously marked R1 resistance area.
The latest candles show price attempting to stabilize around 3,875 after the sharp downward move. A temporary recovery could bring price back toward 3,905–3,917, where previous price structure may create selling pressure.
The bearish continuation scenario remains relevant if the recovery fails to establish acceptance above R1. In that case, the recent low near 3,869 becomes an
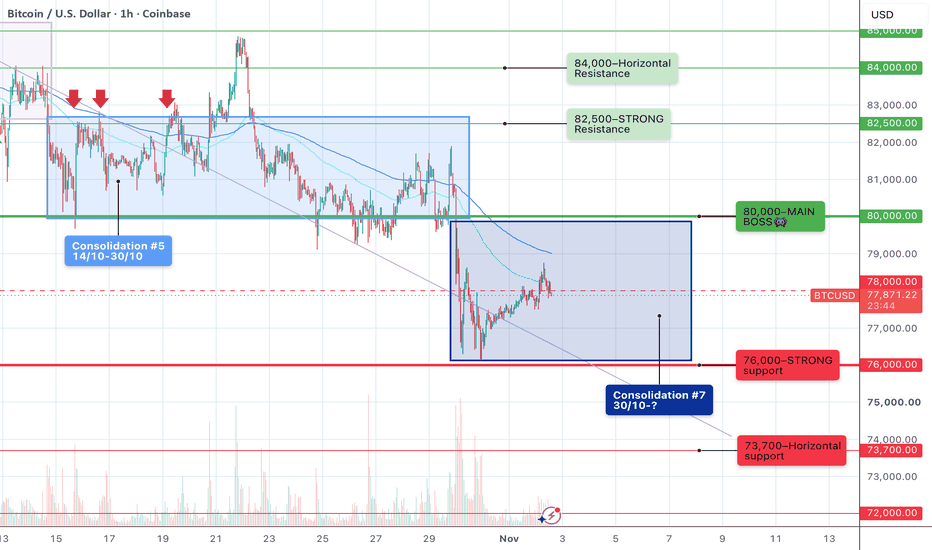
BTC: Binance Shock, $80K Breakdown and a New Trading RangeHello everyone!
Since my last post on Thursday, October 29, we have seen several very interesting developments that deserve attention.
❗️First, Bitcoin failed to hold the critically important $80K support and printing a local low at $76,141.
As I pointed out in my previous posts: “If BTC breaks below $80K and establishes acceptance underneath, I would consider this a return to the $76K–$80K trading range, with the next potential downside target at $76K.”
❗️❗️Second, we witnessed a sharp dro
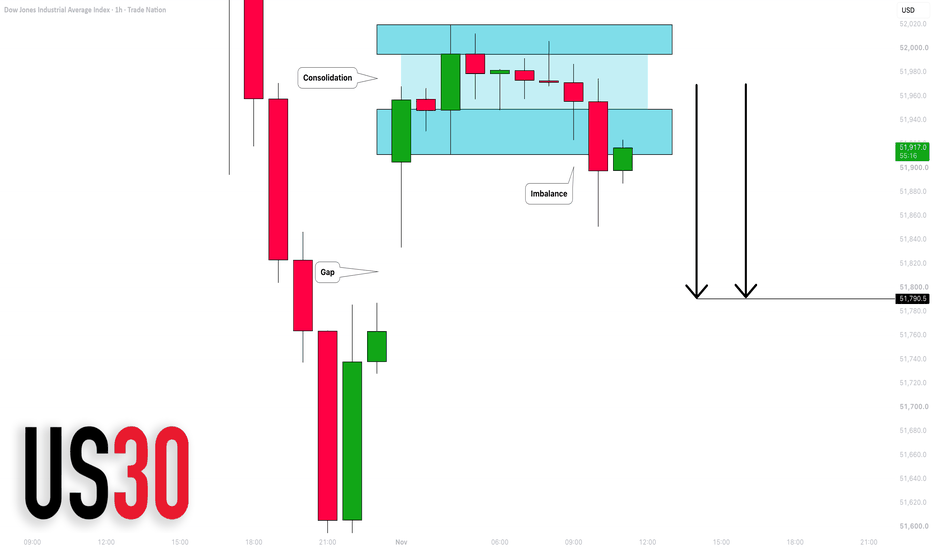
DOW JONES INDEX (US30): Gap Setup
Dow Jones Index will likely fill a gap-up opening.
I see a confirmed breakout of a consolidation range on an hourly time frame as confirmation.
Goal - 51790
❤️Please, support my work with like, thank you!❤️
I am part of Trade Nation's Influencer program and receive a monthly fee for using their TradingView charts in my analysis.
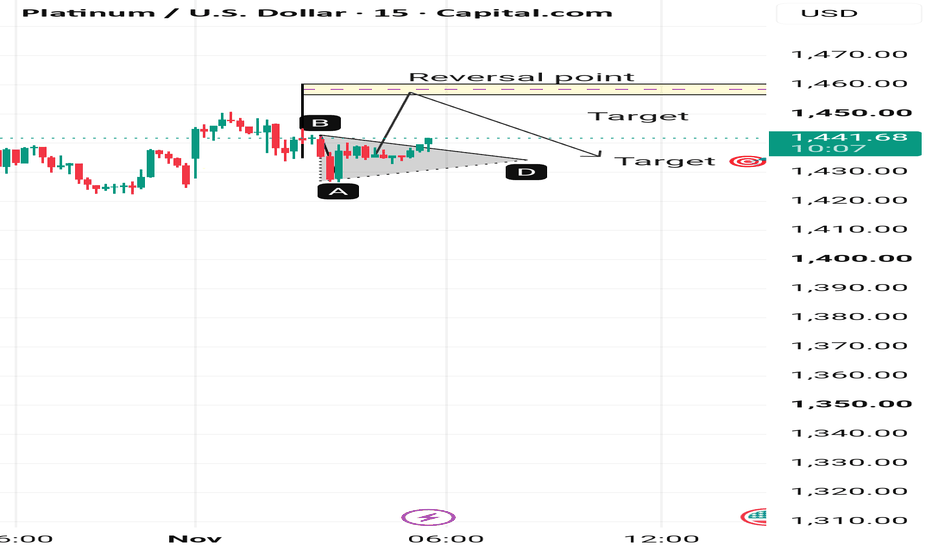
Platinum (XPTUSD) – Bullish Reversal from Triangle, Targets 1450Walk us through what you're seeing, why it matters, and what you expect next:
Price formed a clear descending triangle after the drop into point A.
Strong rejection from the low at A and recovery through B shows buyers stepping in.
The triangle is now breaking to the upside. The marked Reversal point (horizontal resistance zone around 1455–1460) is the key level.
Targets:
First target near the previous swing high / measured move
Second target around the 1455–1460 resistance zone
As long as price
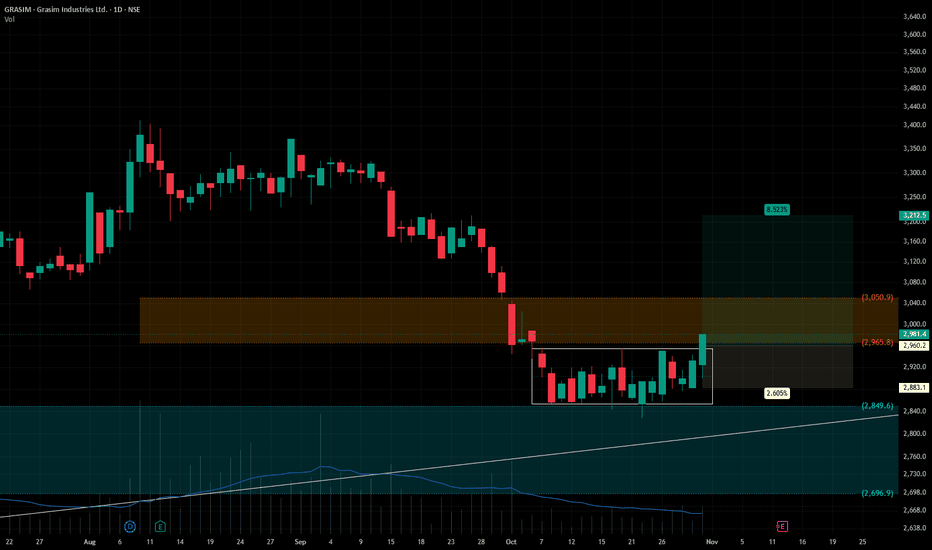
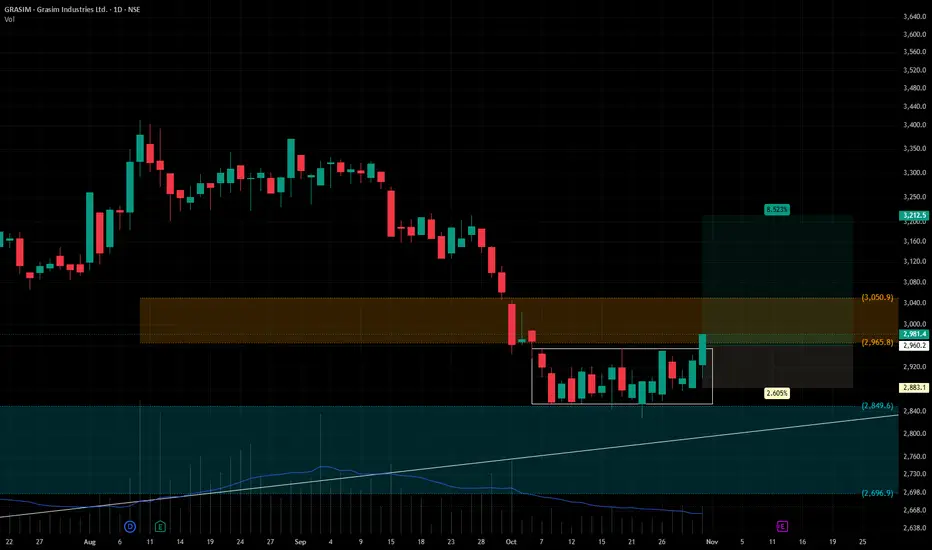
GRASIMGrasim Industries Ltd. (CMP ₹2,982.00, NSE: GRASIM)
The SmartWay Research Desk | 30 October 2026
A Mumbai‑based diversified manufacturing company, incorporated in 1947. Grasim Industries Ltd., the flagship company of the Aditya Birla Group, operates across cement, chemicals, viscose staple fibre (VSF), paints, financial services, and textiles. Through its holdings in UltraTech Cement and Aditya Birla Capital, Grasim has established itself as one of India's most diversified industrial conglo
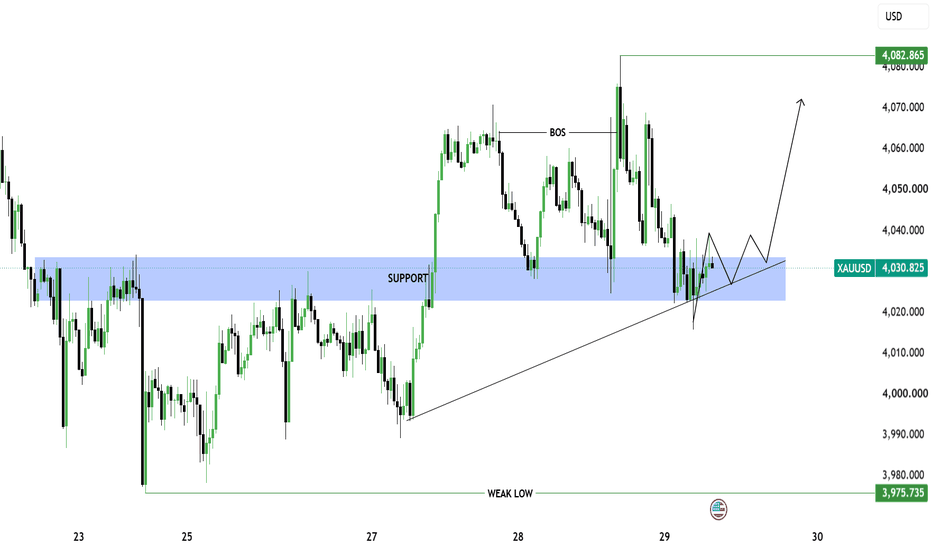
XAUUSD GOLD ANALYSIS / SUPPORT ZONE RETEST AND BULLISH SETUPGold is currently testing a key support zone around 4023–4034, where buyers may step in to push the price higher. The market is also respecting the ascending trendline, which supports the bullish scenario.
If price holds above this support zone and shows strong bullish confirmation, we could see a move toward 4050 and potentially 4070+. However, a clear break below support may invalidate the bullish setup.
Let's wait for confirmation and manage risk carefully. 🎯
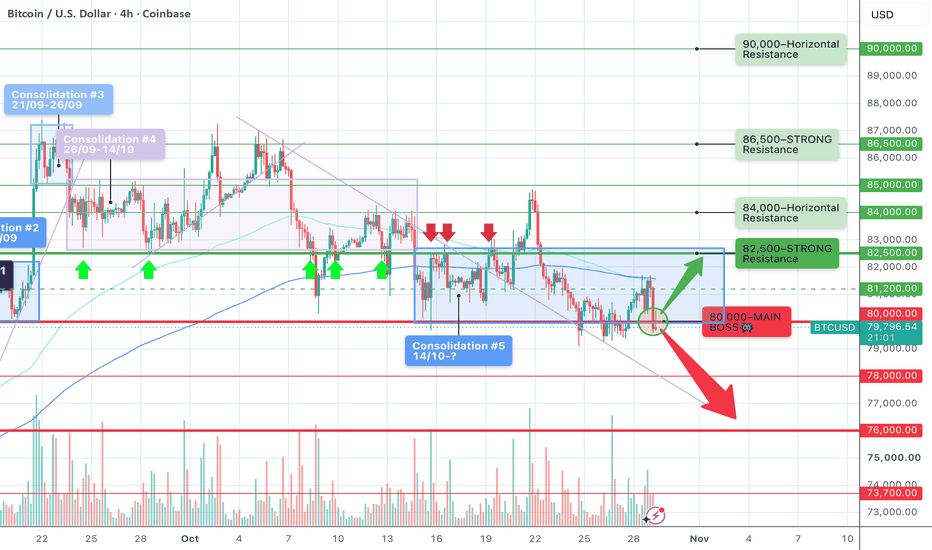
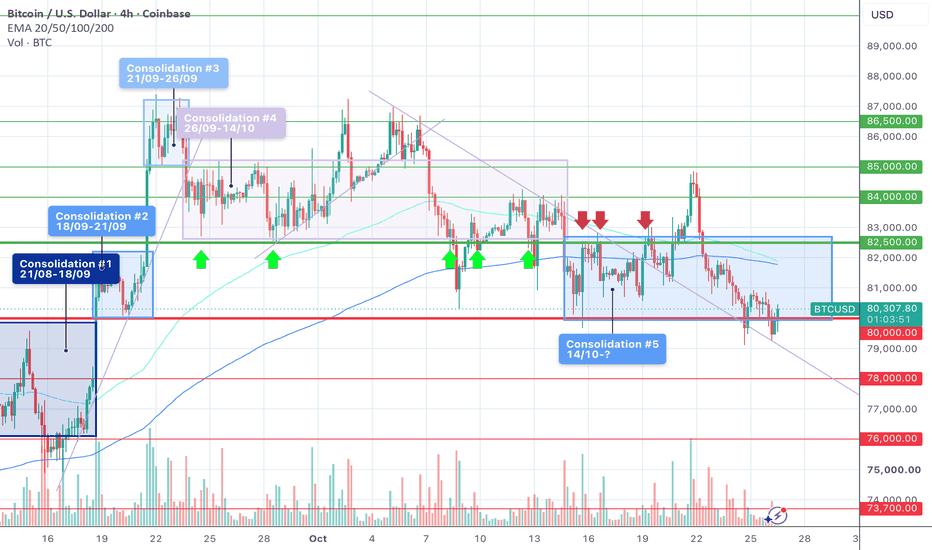
BTC: The Battle for $80K Continues — The Patient Is Still Alive)Hello, friends!☀️
Yesterday, we finally saw a move toward $82.5K, briefly breaking above the $81.2K midpoint of the trading range and reaching a local high of $81.7K 📈
This was the first sign that the patient is still alive, so to speak. After spending so much time around $80K without any meaningful bounce, the risk of a breakdown below this key level and an acceleration of the bearish scenario was increasing 🧨🧨🪓
🔴🐻🪓 The bearish scenario remains unchanged:
«If BTC breaks below $80K and estab
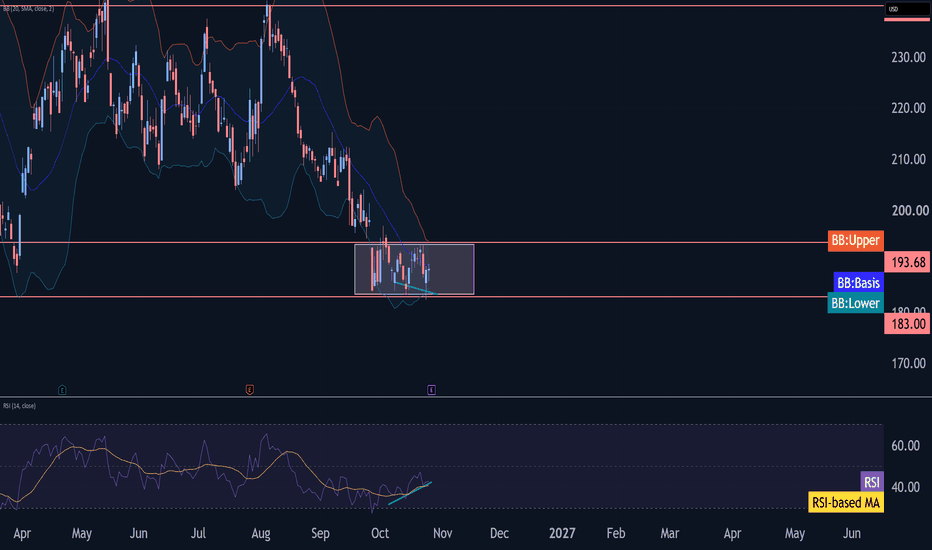
Boeing Wave Analysis – 26 October 2026– Boeing reversed from support level 183.00
– Likely to rise to resistance level 192.50
Boeing recently reversed up from the support zone between the support level 183.00 (lower border of the sideways price range from the end of September, which also stopped wave (1) at the end of March) and the lower daily Bollinger Band.
The upward reversal from this support zone completed the short-term impulse wave (iii) and started the active correction (iv).
Given the strength of the support level 183.0
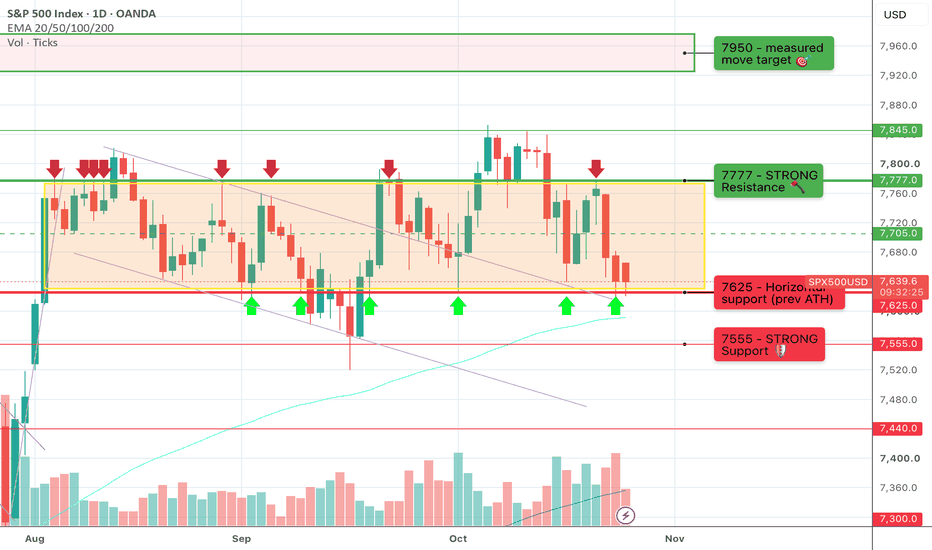
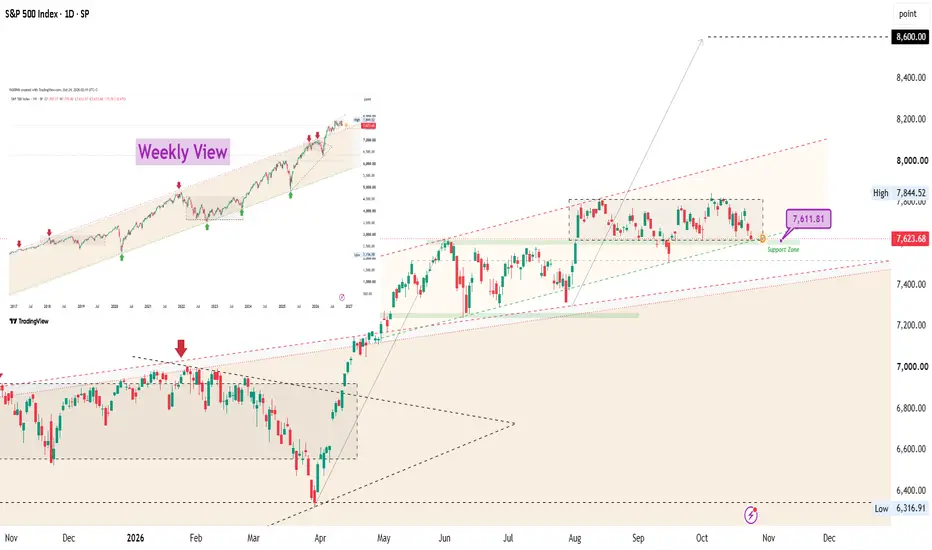
SPX500: Bulls Must Defend 7625!Hello traders!☀️
Unfortunately for the bulls, last Wednesday’s attempt to break through 7777 was unsuccessful, and the level held firm. As I noted: “If the bears manage to push price below 7777, we could see a move toward 7625 — the lower boundary of the trading range that has remained my primary area of focus since August 5, 2026.”
What’s happening on the chart right now?👁️
The 7625–7777 trading range remains our primary area of focus, with the main scenarios still revolving around these t
BTC: One Level Stands Between Bitcoin and $76K!Hello friends! 🌴
As of Monday morning, bears have made some progress, pushing Bitcoin down toward the critical $80K level. We have also seen several false breaks below the lower boundary, including a new local low at $79,107 on Saturday.
Why is $80K so important? 🛡️
Between August 21 and September 18, 2026, $80K acted as a solid resistance wall for the bulls. Every attempt to break above it and hold the level ended in a sharp sell-off 🪓🪓🪓
Once Bitcoin finally broke above $80K on September 18
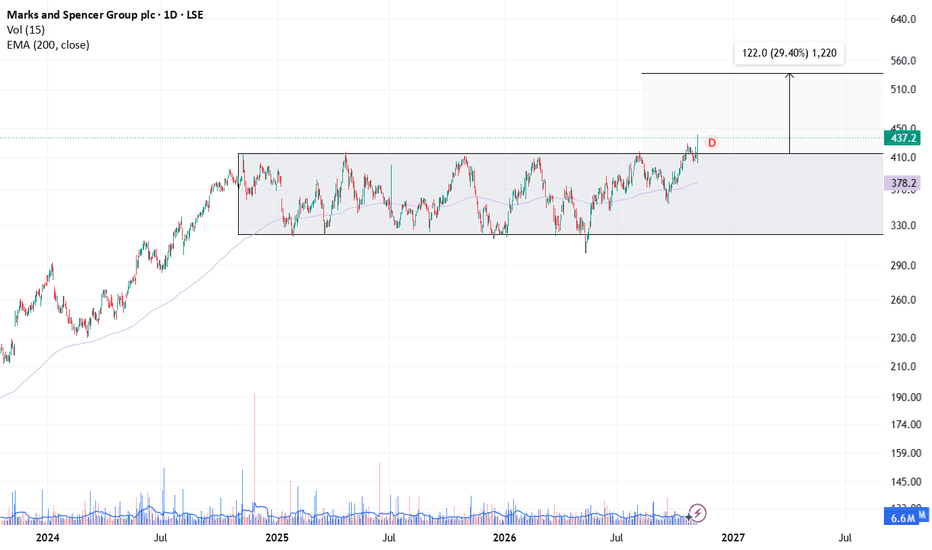
2 year rectangle for M&Scan Marks and Spencer's breakthrough 414 and break out of this rectangle. The rectangle is in a bullish uptrend and has lasted two years. Of course the theory is that this would be a big consolidation and very likely to move to the upside. Trade using your own research And this is not a solicitation to take any action whatsoever.
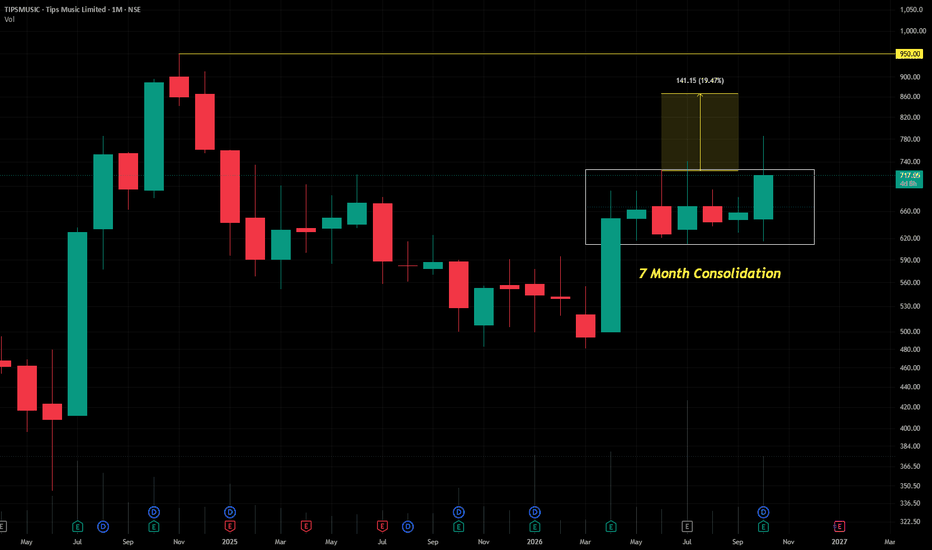
TIPS MUSICTips Music Ltd. (CMP ₹718.00, NSE: TIPSMUSIC)
The SmartWay Research Desk | 26 October 2026
A Mumbai‑based media and entertainment company, incorporated in 1996. Tips Music Ltd. is one of India's leading music rights owners and entertainment content companies, with a vast catalogue of Bollywood and regional songs. The company generates revenue through music streaming, digital platforms, broadcasting rights, licensing, social media monetization, and content distribution across global platform
QNT (Quant) Price Analysis — Weekly Timeframe (1W): Key Support 📊 **QNT/USDT — Weekly Analysis (1W)**
💰 Current Price: $190.43
🔹 Resistance: $228.92 → $270.08 → $327.45
🔹 Main Support: $60–$67 (historical range on the chart)
🟢 **Bullish:** Holding above $228.92 could open the way toward $270 and $327.45.
🔴 **Bearish:** Continued selling pressure may lead to a deeper correction.
📌 Watch the weekly close and trading volume for confirmation.
#QNT #Crypto #TechnicalAnalysis
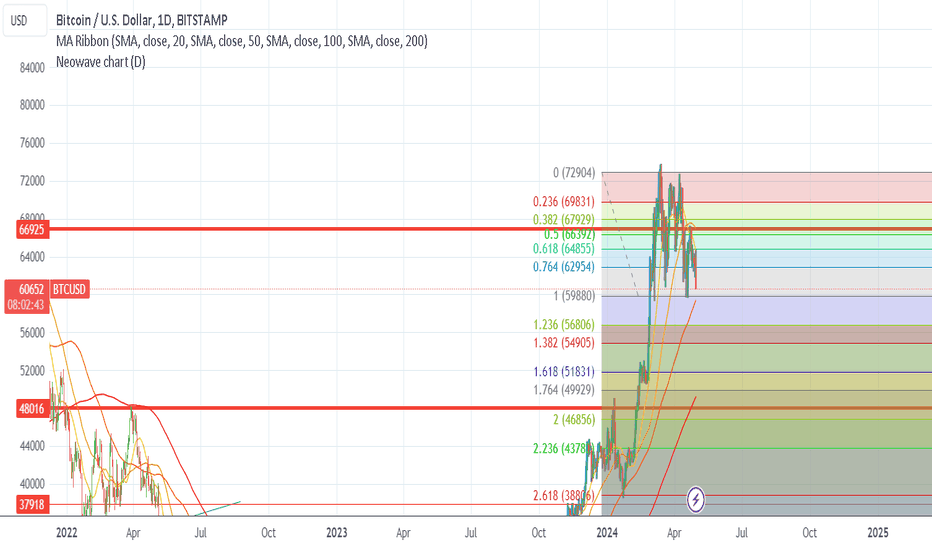
Bitcoin (BTC/USDT) Weekly Analysis — Key Support & Resistance Le📊 **Bitcoin (BTC/USDT) Analysis — Weekly Timeframe (1W)**
Bitcoin is currently trading near **$80,843**, within a key price range following a sharp decline from previous highs. Price is testing a critical zone that could determine the next move.
🔹 **Support Zone:** $75,000–$80,000
🔹 **First Resistance:** $90,000
🔹 **Major Resistance:** $105,600
🔹 **Next Support if Breakdown Occurs:** $60,000–$67,000
🟢 **Bullish Scenario:**
Holding above $75,000 and reclaiming $90,000 could support a m
MarketBreakdown | EURUSD, USDJPY, EURCAD, US100
Here are the updates & outlook for multiple instruments in my watch list.
1️⃣ #EURUSD daily time frame 🇪🇺🇺🇸
The market is currently consolidating within the horizontal range based on the major resistance cluster and the minor daily support.
A breakout of one of the boundaries of the range will provide a strong signal to buy/sell EURUSD.
Alternatively, consider consolidation trading within the range.
2️⃣ #USDJPY daily time frame 🇺🇸🇯🇵
The market reached the major demand area.
The price