トヨタ自動車 環境認識 1H 7203【環境認識】
価格構造の分解とマクロ・ファンダメンタル環境から見る現在地
チャートの表面的な形状だけでなく、内部の取引データ(出来高とモメンタム)、およびリアルタイムのマクロ環境を統合し、現在の相場環境を俯瞰します。
結論:本稿は新規の買いを推奨するものではなく、相場が内包する下落リスクの解析と、客観的な環境認識を目的としています。
■ 確定データ・環境要因
① 高値圏での取引密集
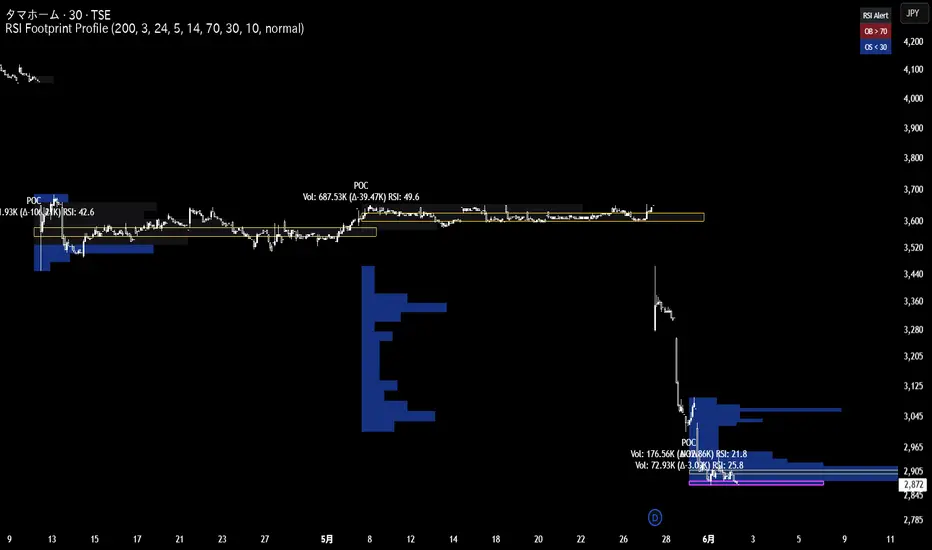
チャート上部(2,860円〜2,880円)に連続する赤色ボックスは、RSIが80〜90という極端な過熱水準に達していたことを示しています。同時に、この限られた価格帯で数百万株規模(例: 2766.2K)の突出した出来高が成立している事実がデータとして残っています。
② VWAP基準線からの下方推移
現在値(2,776.5円)は、出来高加重平均価格のセンターラインを明確に割り込み、下限バンドの領域内で推移しています。相対的な売り圧力が市場を支配している状態です。
③ マクロ・ファンダメンタルズの深掘り
現在の市場は、単なるセンチメントの悪化ではなく、実体経済と金融政策の両面から自動車・製造業セクターへの資金流入を制限する構造的な重しが存在します。
日米実質金利差とターミナルレートの織り込み
日銀の政策正常化・利上げプロセスと、FRBの金利見通しが交錯する中、実質金利差の縮小懸念が台頭しています。
これにより「円安の恩恵を無条件で享受できるフェーズ」は後退し、為替感応度の高い当銘柄にとって、トップライン(売上高)の押し上げ効果の剥落がアルゴリズム等の売り圧力を誘発しやすい環境となっています。
北米需要のピークアウト懸念(Days Supplyと信用不安)
収益の柱である北米市場において、新車ディーラー在庫日数(Days Supply)の増加傾向や、高金利の長期化に伴うオートローン(特にサブプライム層)の延滞率上昇などのマクロデータが警戒されています。
実需の減速サインが、上値を買い上がる投資家のモメンタムを削いでいます。
セクターローテーションの劣後
機関投資家の資金循環において、景気敏感バリュー株から資金が流出し、他セクターへのリバランスが観測される局面です。市場全体に対する「相対的なパフォーマンスの低下」が明確化しており、逆張りで資金を投じる優位性が低下しています。
■ 考察シナリオ
上記の「テクニカル上の上値の重さ(巨大な出来高ブロック)」と「ファンダメンタルズの逆風」を掛け合わせた場合、現在地からの新規買いは極めて優位性が低いと評価します。
【ルートA:真空地帯への落下】
現在値より下方の価格帯は、過去の取引履歴が薄い「出来高の空白地帯」です。ファンダメンタルズの後押しがない中、トップで形成された「逃げ遅れた買いポジション」が耐えきれずに投げ売りを始めた場合、ストッパーが存在しないまま2,664円付近の主要サポートへ向けて下落が進行するルートが最も合理的です。
【ルートB:ショートスクイーズ】
仮に2,664円付近で下げ止まり、VWAPセンターラインを上抜ける突発的な反発があったとしても、それはファンダメンタルズに裏打ちされたトレンド転換ではなく、上部ポジションの損切り(買い戻し)を巻き込んだ一時的なショートスクイーズ(真空地帯の穴埋め)である可能性が高いと解釈します。
免責事項
本分析は現在の市場環境を論理的に把握するためのものであり、特定の売買を推奨するものではありません。「ポジションを持たないこともまた一つのポジション(休むも相場)」という原則に基づき、下値リスクと上値のしこりを確認する環境認識として活用してください。実際の投資判断はご自身で行ってください。
Breakdown of Price Structure & Current Position Evaluation via Macro-Fundamental Environment
By integrating not only the superficial shape of the chart but also internal trading data (volume and momentum) and the real-time macro environment, we take a comprehensive view of the current market context. In conclusion, this post does not recommend initiating new long positions; rather, it aims to analyze the downside risks inherent in the market and provide an objective environmental assessment.
■ Confirmed Data & Environmental Factors (Objective Facts)
1. Heavy Trading Density at the Top (Anomalies in Internal Data) The continuous red boxes at the top of the chart (2,860 - 2,880 JPY) indicate an extreme overbought level where the RSI reached 80-90. Simultaneously, data shows a massive volume of millions of shares (e.g., 2766.2K) being traded within this narrow price range.
2. Downward Shift from VWAP Baseline (Price Action) The current price (2,776.5 JPY) has clearly broken below the Volume Weighted Average Price (VWAP) center line and is moving within the lower band area. Relative selling pressure currently dominates the market.
3. Deep Dive into Macro-Fundamentals (Structural Headwinds for the Sector) The current market is facing not just a deterioration in sentiment, but structural weights that restrict capital inflows into the automotive/manufacturing sector from both the real economy and monetary policy perspectives.
Pricing in of US-Japan Real Interest Rate Differentials & Terminal Rates: As the BOJ's policy normalization/rate hike process intersects with the FRB's interest rate outlook, concerns over a narrowing real interest rate differential are emerging. Consequently, the "phase of unconditionally enjoying a weak yen" is receding. For this highly forex-sensitive stock, the stripping away of top-line (revenue) boost effects creates an environment that easily triggers algorithmic selling pressure.
Concerns of Peak North American Demand (Days Supply & Credit Risks): In the core North American market, macro data such as the upward trend in new vehicle dealer inventory (Days Supply) and rising delinquency rates in auto loans (particularly subprime) due to prolonged high interest rates are being closely monitored. Signs of a slowdown in real demand are dampening the momentum of investors looking to buy at higher prices.
Lagging in Sector Rotation: In institutional capital flows, we are observing a phase where funds are rotating out of economically sensitive value stocks and rebalancing into other sectors. The "relative underperformance" against the broader market is becoming clear, reducing the edge of contrarian buying.
■ Forecast Scenarios (*Includes independent predictions and interpretations)
Combining the aforementioned "technical overhead supply (massive volume blocks)" with "fundamental headwinds," we evaluate that initiating new long positions from the current level has an extremely low probability of success.
The price range below the current level is a "volume vacuum zone" with sparse historical trading data. With no fundamental tailwinds, if the "trapped long positions" formed at the top capitulate and begin panic selling, the most logical route is a continuous drop towards the major support near 2,664 JPY without any significant stoppers.
Even if the price finds a floor near 2,664 JPY and experiences a sudden bounce above the VWAP center line, it is highly likely not a trend reversal backed by fundamentals. Instead, we interpret this as a temporary short squeeze (filling the vacuum zone) triggered by the stop-losses (short covering) of the overhead positions.
This analysis is intended to logically grasp the current market environment and does not recommend any specific buying or selling. Based on the principle that "having no position is also a position" (resting is also trading), please use this as a contextual awareness check for downside risks and overhead supply. Please make your actual investment decisions at your own discretion.