XAUUSD — 4,290 Retest Before the Next Push?
Gold is trading around 4,317 after a strong post-Fed recovery.
M30 structure is improving, but price is still sitting inside a near-term decision area.
A bounce is not enough.
The pullback will tell us more.
The simple read
The key zone today is 4,285–4,298.
If buyers defend this pullback area, Gold may recover toward 4,335 first, then challenge the major resistance around 4,357–4,367.
A clean breakout above that zone could open the way toward 4,396–4,399.
If 4,285 fails, the 4,277 OB b
Shooting Star
XAUUSD — Bullish Recovery Toward 4,410Gold is showing a bullish recovery after reacting strongly from the lower liquidity area. From Kelly’s view, the chart suggests that XAUUSD may be forming a new upside Elliott Wave structure after breaking out from the lower side of the previous bearish channel.
The key idea is simple: if gold continues to hold above the Buy zone liquidity, the recovery structure can continue toward the next resistance levels.
⟡ Market structure
Gold is currently trading around 4,310–4,318, after bouncing fro
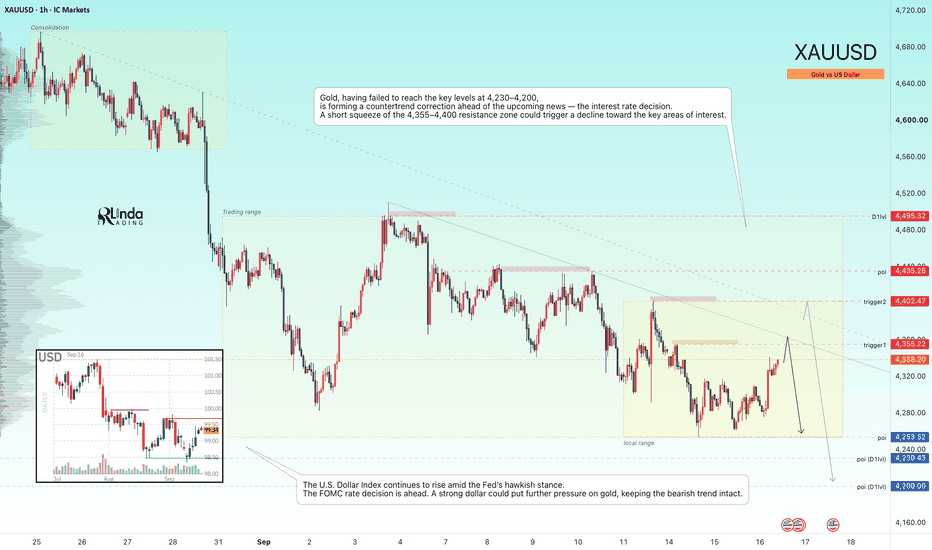
GOLD - A countertrend correction ahead of the news ICMARKETS:XAUUSD is bouncing from support ahead of the news and forming a countertrend correction amid the dollar’s stagnation following a five-day rally. The FOMC meeting and comments from the regulator are ahead...
Technically, most of the hawkish risks have already been priced in, but gold will remain vulnerable if the Fed signals that it intends to keep rates elevated for an extended period. Geopolitical risks and high energy prices are providing support. Gold is caught between expecta
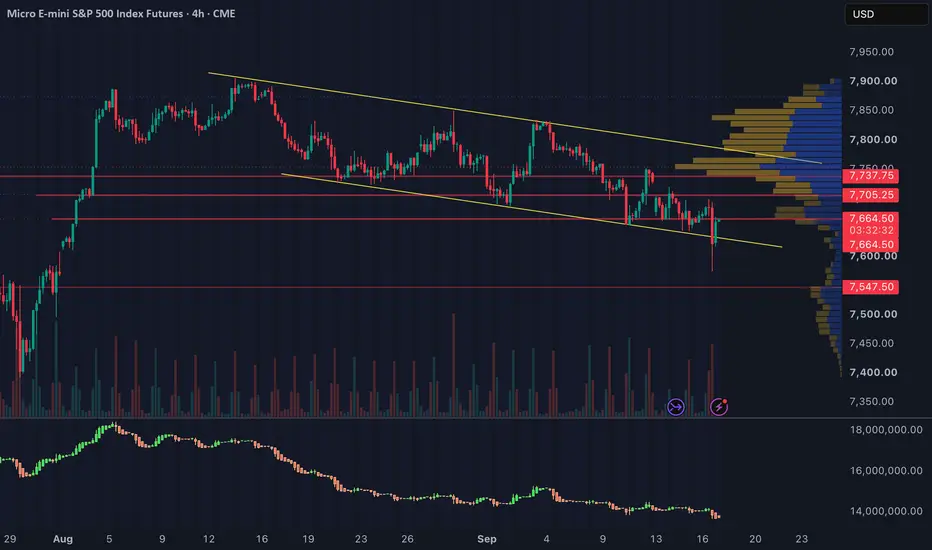
Post-FOMC Repricing Keeps MES in Tactical Risk-Off Post-FOMC Repricing Keeps MES in Tactical Risk-Off — Repair Rally Reaches Its First Test
Market Regime: Tactical Risk-Off / Hawkish Post-FOMC Price Discovery
Systemic Stress: Not confirmed
Confidence: High
Wednesday’s FOMC meeting produced a unanimous 25-basis-point rate increase, lifting the target range to 3.75%–4.00%. Policymakers’ projections also left another increase possible before year-end.
The market’s initial response was a sharp downside repricing followed by a meaningful after-hou
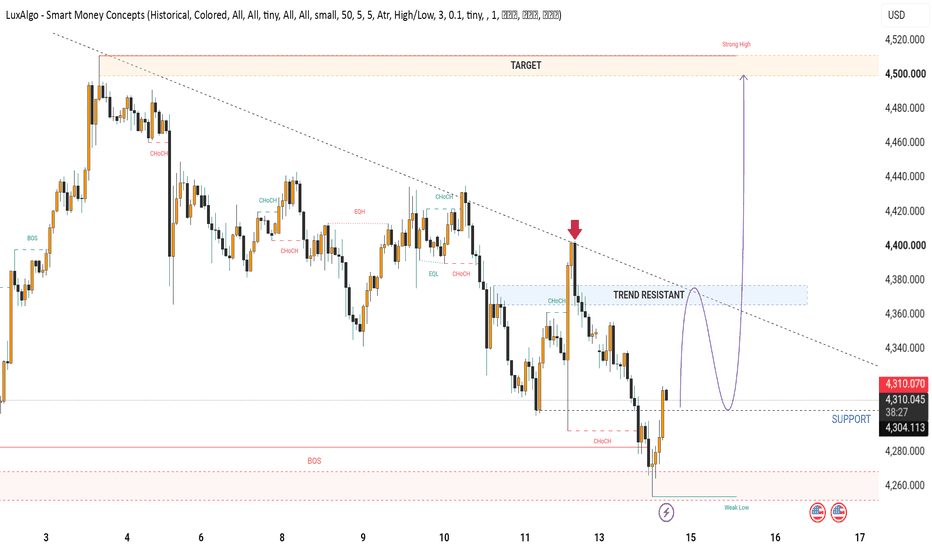
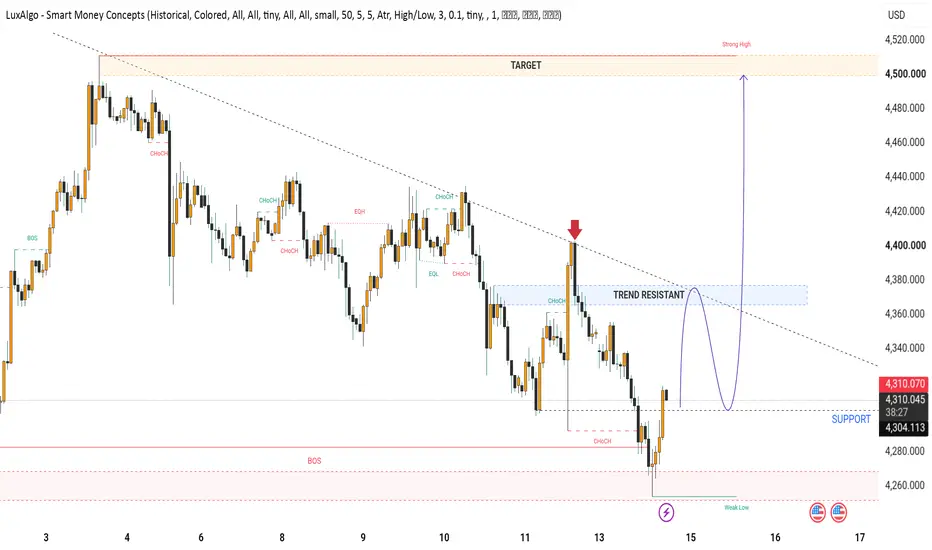
XAUUSD Market Structure Support, Resistance & Breakout Scenario
Gold is currently showing a recovery from the 4250–4275 support area after a strong bearish move. Price has bounced back toward the 4310 region, but the overall structure remains cautious because price is still trading below the descending trendline and the major 4365–4380 resistance zone.
Market Structure
The recent price action shows lower highs and lower lows, indicating that sellers still have control of the broader structure. The latest bounce from the 4250–4275 area suggests that buyers a
Market Concepts · Lesson 18 — Channels, Wedges & TrendlinesLesson 18 - Channels, Wedges and Trendlines: Trading Structured Price Patterns
Difficulty: Intermediate
Not every move happens in random chop. Sometimes price organizes itself into clean geometric patterns — channels, wedges, trendlines — that tell you exactly where reactions are likely. Learning to read these patterns adds a whole layer of structure to your chart.
🔵 TRENDLINES: THE FOUNDATION
A trendline is a diagonal line connecting two or more swing points that move in the same
GBPJPY — Potential 1H Reversal SetupAfter the sharp bearish move, GBPJPY has reached an important area of interest.
Price created a new LL, followed by a reaction and another test of the lows. I’m watching this as a potential double-bottom / bullish reversal structure around the 206.7–207.0 area.
The key level for me is the 209.1 neckline.
Trade idea:
🟢 Long around the neckline / on confirmation
🛑 SL below the recent LL / jaw area
🎯 TP around 211.224
📊 Targeting approximately 1:3 RR
The main confirmation I want to see on the
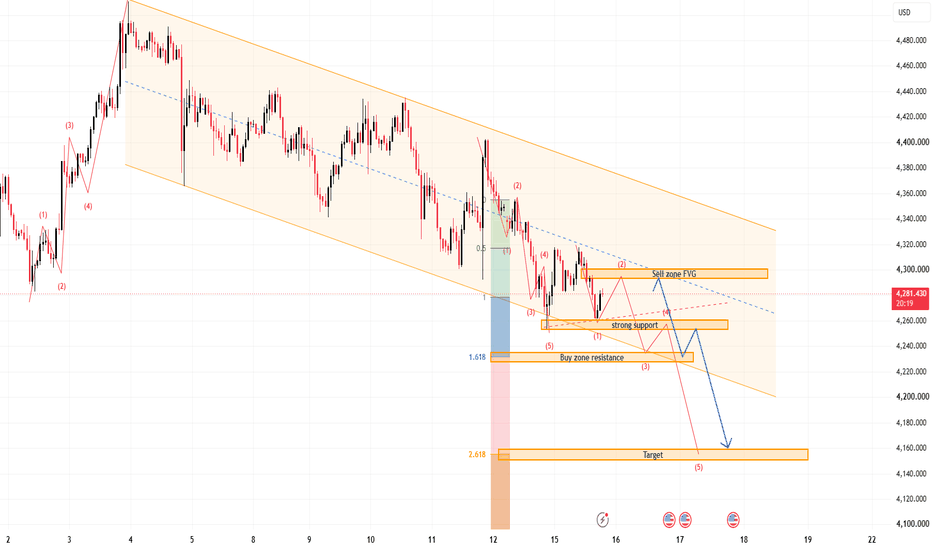
XAUUSD — Bearish Wave Toward 4,160
Gold is still moving inside a clear bearish channel after failing to break above the descending trendline. From Kelly’s view, the current chart suggests that XAUUSD remains under downside pressure, and the latest recovery may only be a short correction before another bearish Elliott Wave leg continues.
The key idea is simple: gold is trading below the FVG sell zone, and if buyers cannot reclaim this resistance, sellers may continue pushing price toward the lower support and final target area.
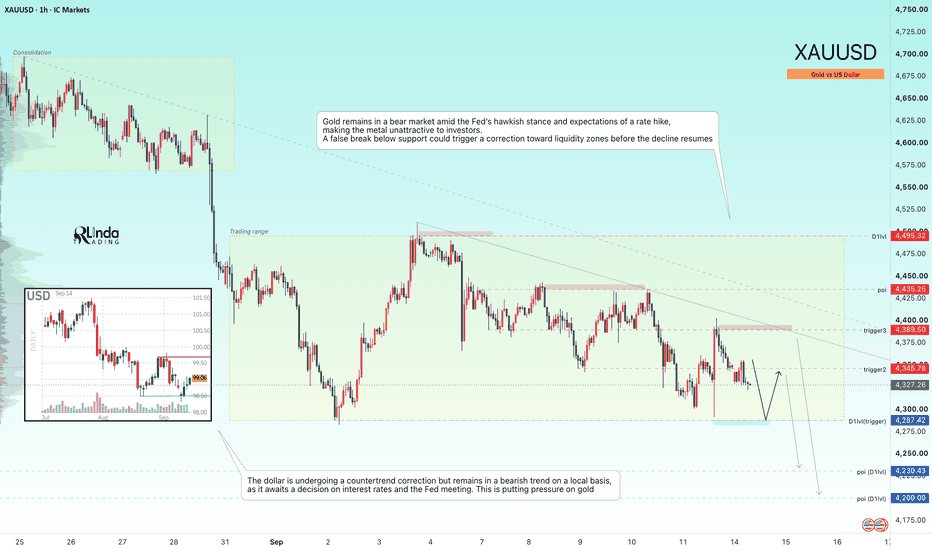
GOLD - A bounce off support before falling to 4,200 ICMARKETS:XAUUSD remains under pressure from the Fed’s hawkish stance and a strengthening dollar. In the medium term, the market may maintain its bearish trend; however, this week, all attention is focused on the Fed’s rate decision and the regulator’s comments
The dollar is forming a countertrend correction but remains locally bearish. The dollar’s rise is putting additional pressure on the metals market. Gold is maintaining its bearish market structure amid the Fed’s hawkish stance, whil
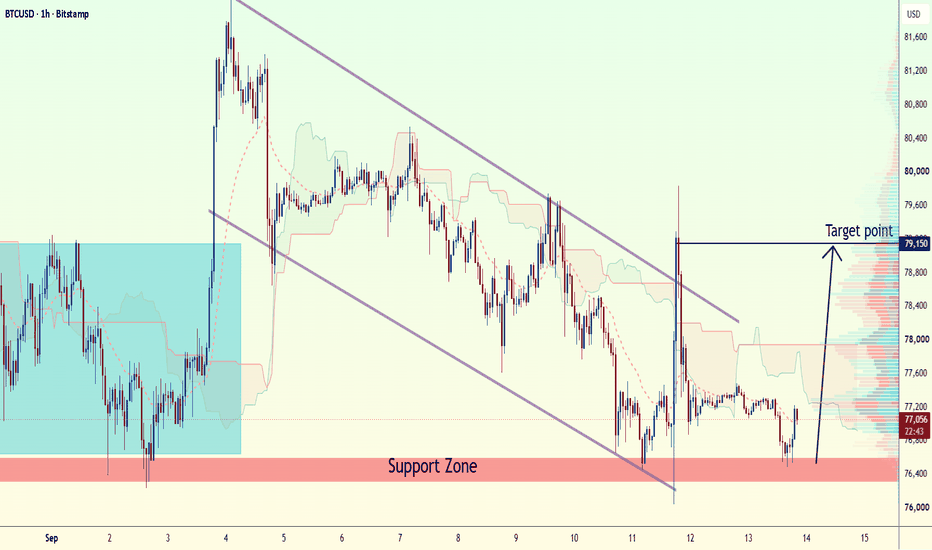
BTCUSD 1H — Bullish Rebound From SupportBTCUSD is showing a potential bullish reversal from the strong **$76,400–$76,700 support zone**. Price has reacted positively from this area, suggesting buyers are stepping in. A sustained move above the nearby **$77,200–$77,600 resistance** could strengthen the bullish setup and open the way toward higher levels.
**🎯 Target:** **$79,150**
**📍 Support:** $76,400–$76,700
**📈 Confirmation:** Break and hold above $77,600
**⚠️ Invalidation:** Strong breakdown below $76,400
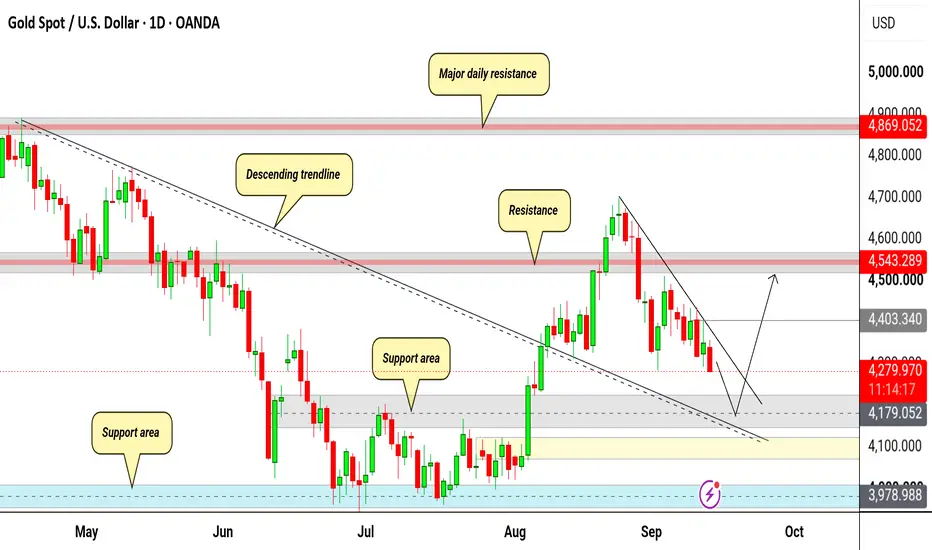
XAUUSD: Major Support Confluence & Descending Liquidity RetestTechnical Analysis
Market Structure & Trendline Retest: Gold (XAUUSD Daily) completed a major structural breakout above its long-term Descending Resistance Trendline in August, accelerating toward the $4,600 supply zone. The subsequent pull-back represents a textbook descending liquidity sweep and retest of the broken trendline acting as new dynamic support.
Support Confluence Zone ($4,179 – $4,287): Price is compressing directly into a high-confluence demand cluster formed by:The top boundary
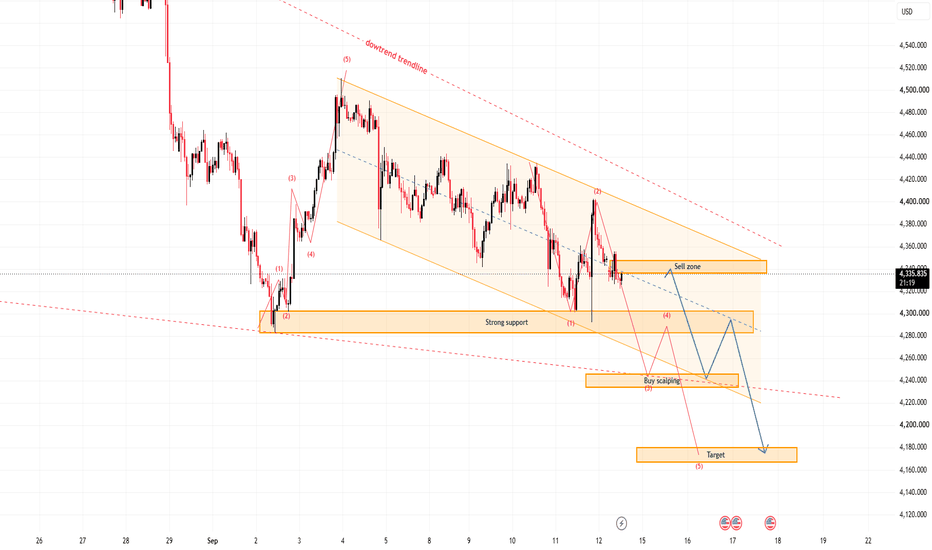
XAUUSD — Bearish Channel Toward 4,175
Gold is still moving inside a clear bearish channel after failing to reclaim the upper resistance trendline. From Kelly’s view, the chart suggests that XAUUSD remains under downside pressure, and the current recovery may only be a short correction before the next bearish wave continues.
The key idea is simple: gold is trading near the sell zone, and if buyers fail to break above this area, sellers may push price back toward lower support and the final target zone.
⟡ Market structure
Gold is
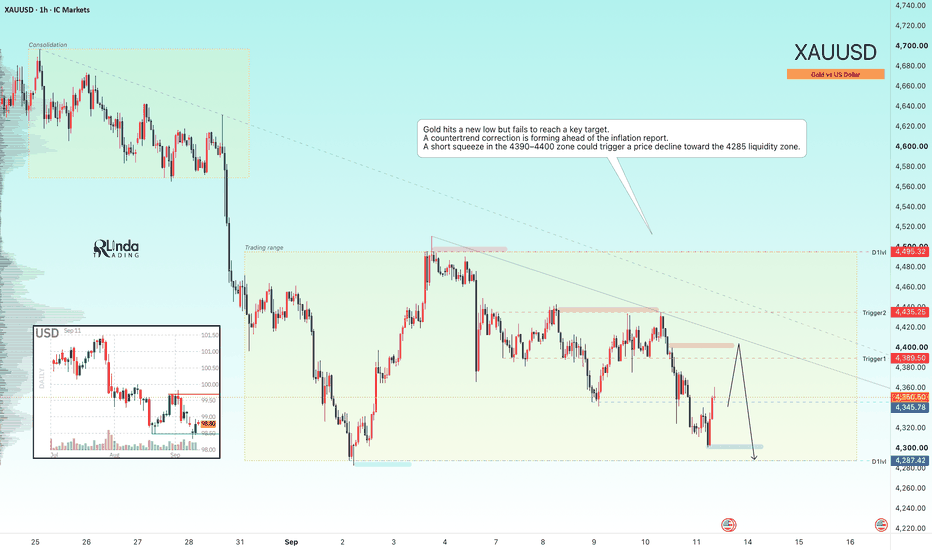
GOLD - A countertrend correction to 4,400 ahead of the newsICMARKETS:XAUUSD remains under pressure from a strengthening dollar and a weak fundamental backdrop. The market is making new intermediate lows within the 4,290–4,500 trading range. Key news is ahead…
The dollar is bouncing from support and returning to its bullish momentum, putting further pressure on the market. Gold is trading near its weekly lows, around $4,310, on Friday following a sharp decline triggered by hotter-than-expected PPI data and rising oil prices.
According to TD Securit
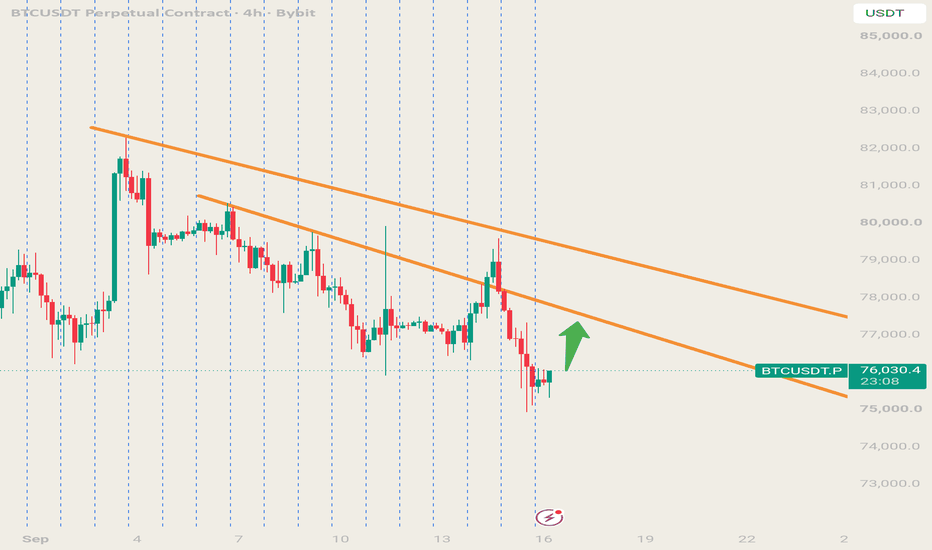
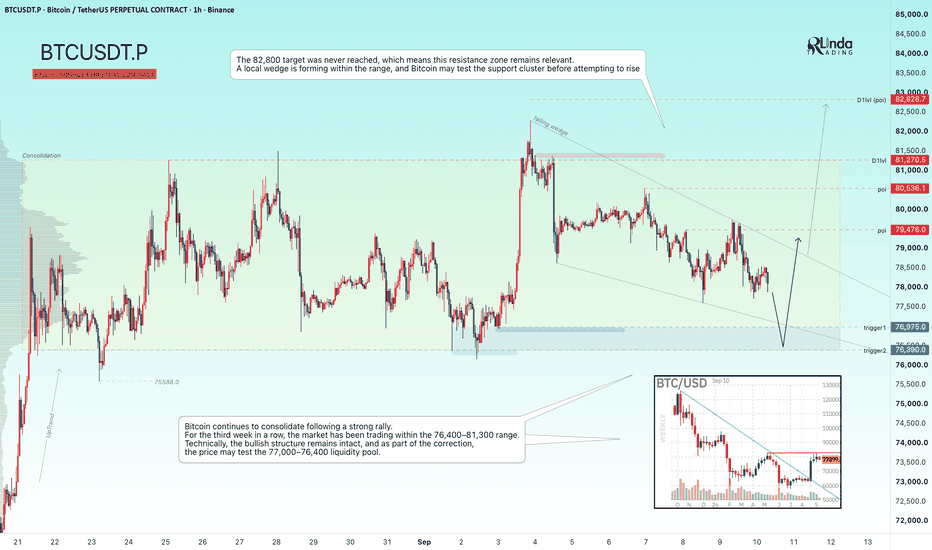
BITCOIN - A correction within a consolidation phaseBINANCE:BTCUSDT.P reached a new cycle high at 82,300, but still failed to reach the key target. The market remains in consolidation, within which a countertrend correction is developing
The fundamental backdrop remains unstable, but relatively favorable for the market. Against this backdrop, Bitcoin continues to consolidate within the current range. On September 15, the Senate is scheduled to hold another vote on the CLARITY Act.
The market has been range-bound between 76,400 and 81,300 fo
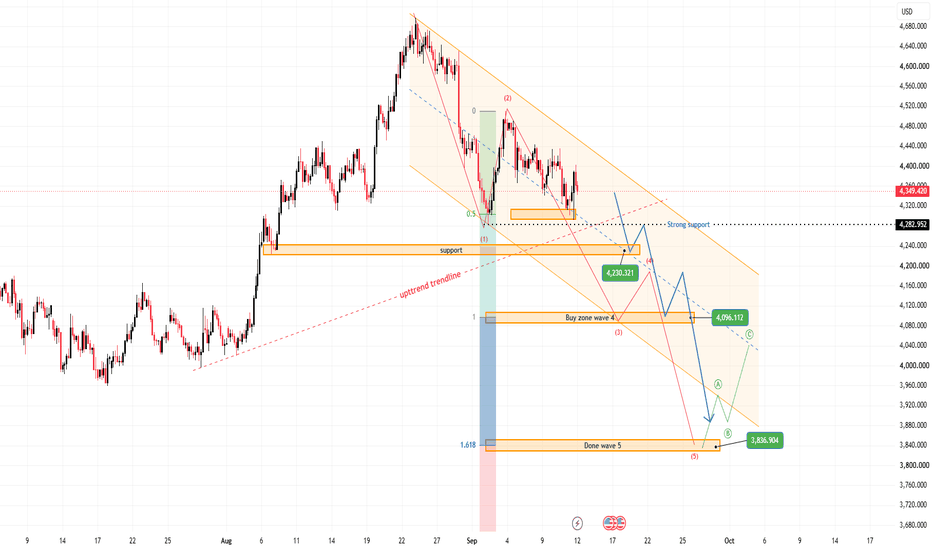
XAUUSD — Medium-Term Bearish Wave Toward 3,836
Gold is showing a medium-term bearish Elliott Wave structure after failing to recover above the descending channel resistance. From Kelly’s view, the chart suggests that XAUUSD is still moving inside a broader downside trend, and the current rebound may only be a correction before the next bearish wave continues.
The key idea is simple: gold may retest support first, then create a short recovery, but as long as price stays below the descending trendline and resistance structure, the priority
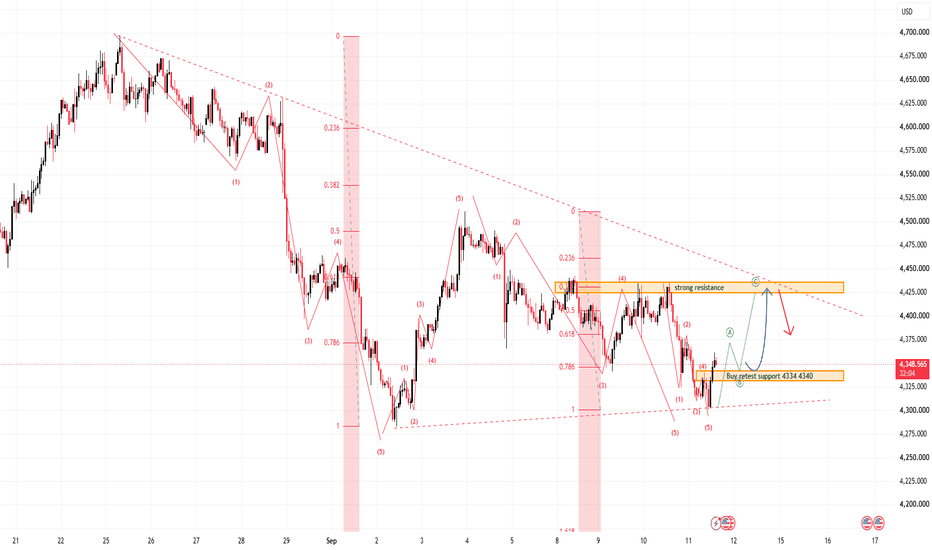
XAUUSD — Bullish Retest Toward 4,425
Gold is showing a short-term bullish recovery after completing the previous downside wave near the lower support area. From Kelly’s view, the current chart suggests that XAUUSD may be forming a corrective bullish structure, with price now reacting from the 4,334–4,340 buy retest support zone.
The key idea is simple: if gold holds above this support, the next recovery leg may continue toward the 4,420–4,435 strong resistance area.
⟡ Market structure
Gold recently completed a bearish 5-wave se
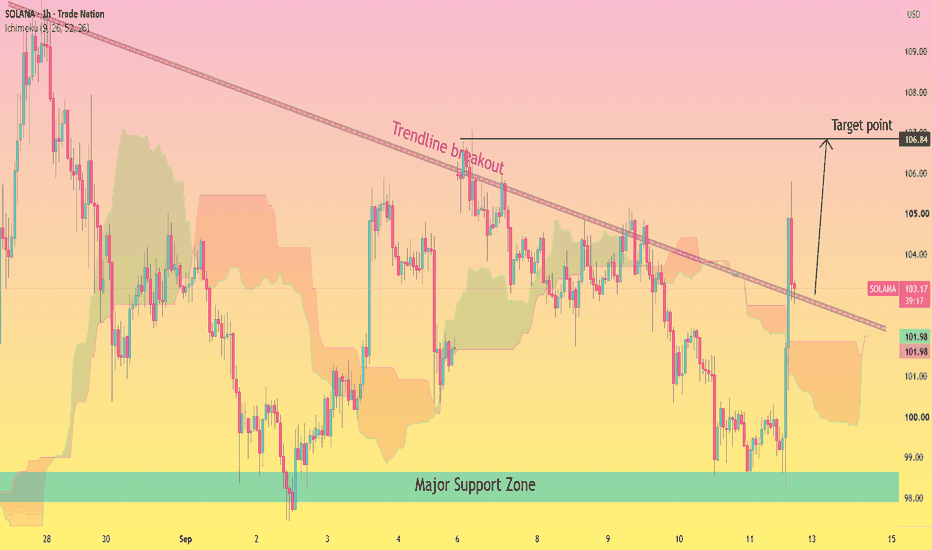
SOLANA Bullish Trendline Breakout — Target 106.84SOLANA (SOLUSD) is showing a bullish reversal setup after breaking above the long-term descending trendline. Price has also reacted strongly from the **major support zone around 98.00–98.50**, showing strong buying interest. The breakout suggests a potential continuation toward the marked resistance area.
🎯 **Target:** 106.84
🛡️ **Key Support:** 98.00–98.50
📌 **Bias:** Bullish above the breakout area
The setup remains constructive as long as price holds above the broken trendline and support z
BTC ENTERING INTO NEW UPTREND DAILY BASIC TREND..Depending on last data BTC is just entering the first 1/3 trend of uptrend, we will follow the other confirmations in the coming hours. BTC had a breakdown trend of more than 22h+
For now BTC seems to return into positive trend, and the start of new Long follow
GOLD - A Hunt for Liquidity Ahead of Further DeclinesICMARKETS:XAUUSD has been forming a countertrend correction since the session opened. The fundamental backdrop remains unstable, and this correction could end with another move lower
Gold remains exposed to two-sided risks ahead of the release of U.S. CPI data. The sell-the-bounce strategy remains in place, especially against the backdrop of higher-than-expected inflation in China. TD Securities expects core inflation to remain under control in August but warns of upside risks
Drivers:
Ups
XAU/USD (Gold) Daily Outlook: Bearish Fractal Symmetry TargetingGold is presenting a compelling daily market structure setup on the 1-Day timeframe. Price action is forming a clear structural reflection of its previous drop, signaling potential downside continuation toward lower key support.
Technical Breakdown
Shooting Star Rejection at Trendline Resistance: The recent move higher tested a descending trendline resistance, forming a strong Shooting Star candlestick on the Daily timeframe around the 4,700.00 region. This highlights aggressive selling pressur