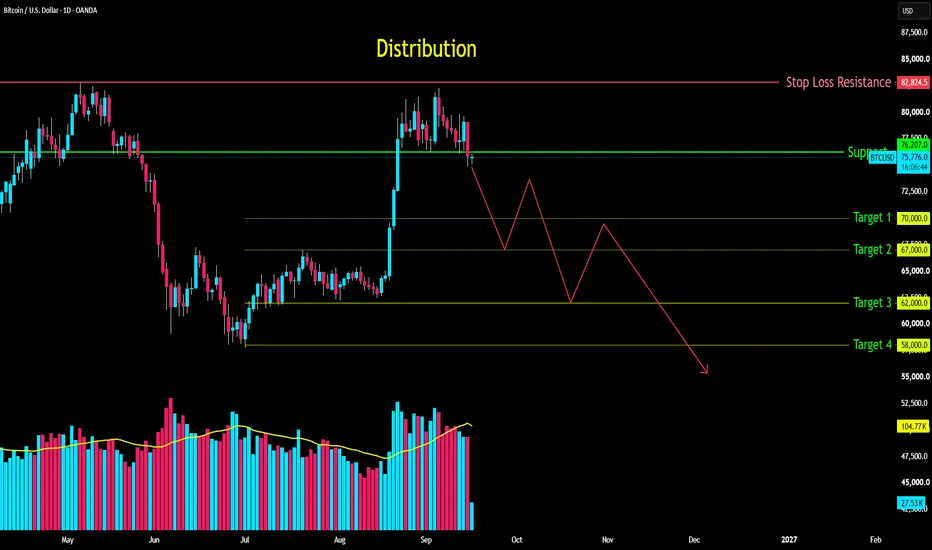
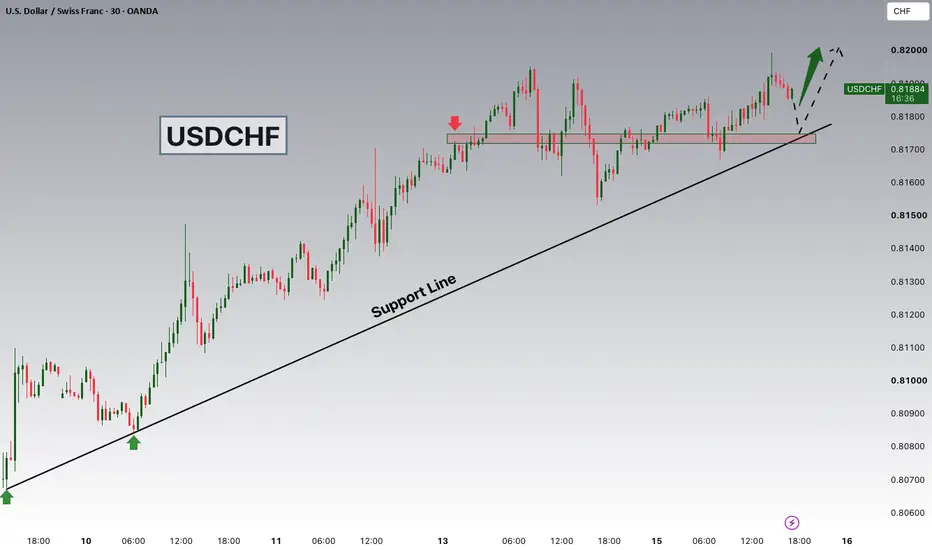
Long
Long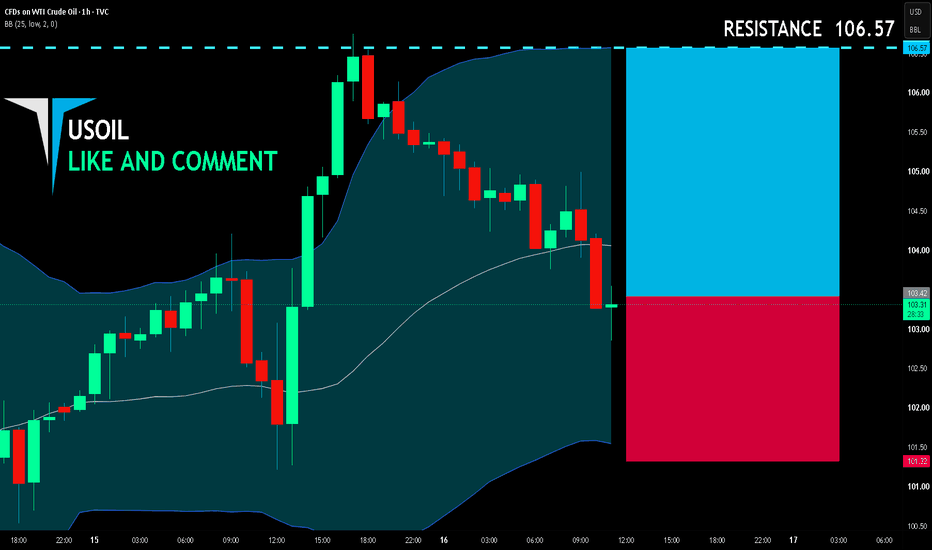
XAUUSD — Sell the H1 Fibonacci RetestFundamental Analysis
Gold remains under pressure ahead of the September 15–16 Fed meeting. Markets are pricing roughly a 92% probability of a 25 bp rate hike, while a firmer U.S. dollar and rising Treasury yields continue to raise the opportunity cost of holding gold.
The macro backdrop is also being complicated by oil prices above $100 and renewed Middle East supply concerns. U.S. Treasury yields have pushed to fresh multi-year highs, with the 10-year recently moving above 5%, reinforcing the higher-for-longer pressure on precious metals.
Technical Analysis
On the H1 chart, XAUUSD is trading near 4,277 after rebounding from the 4,253.64 low but failing to establish a sustained bullish structure.
Price remains below the broader bearish structure, while the latest Fibonacci retracement identifies 4,293–4,305 as the most attractive short-term sell area. This zone combines the 0.618–0.786 retracement, previous structure, and nearby H1 imbalance.
A deeper recovery could test 4,318, but acceptance above that level would weaken the immediate bearish setup.
If sellers defend the Fibonacci zone, price may rotate back toward 4,278, followed by 4,268–4,270 and eventually the 4,253–4,255 liquidity low.
Important Key Levels
4,378–4,390 — Major H1 FVG
4,305–4,318 — Upper resistance
4,293–4,305 — Main sell zone
4,278 — First downside pivot
4,268–4,270 — Lower demand
4,253–4,255 — Main liquidity target
Trading Scenario
Main Sell Setup
Entry: 4,293–4,305
Stop Loss: 4,322
Take Profit 1: 4,278
Take Profit 2: 4,268–4,270
Take Profit 3: 4,253–4,255
Sell Condition
Wait for price to retrace into 4,293–4,305 and show bearish confirmation. A rejection wick, bearish engulfing candle, failed reclaim above 4,305, or H1 close back below 4,293 may confirm renewed seller pressure.
A sustained break above 4,318–4,322 would invalidate the immediate sell idea.
Overall View
The H1 bias remains bearish while XAUUSD trades below 4,318. With price already near lower support, chasing shorts around 4,277 offers poor positioning. The preferred plan is to wait for a corrective rebound into 4,293–4,305, then look for confirmation toward 4,278, 4,268, and potentially a retest of the 4,253 liquidity low.
The Fed decision is now the main volatility risk, and the tone of the policy statement may be as important as the expected rate hike itself.
Do you expect gold to retest 4,293–4,305 before sellers attack 4,253 again?  Short
Short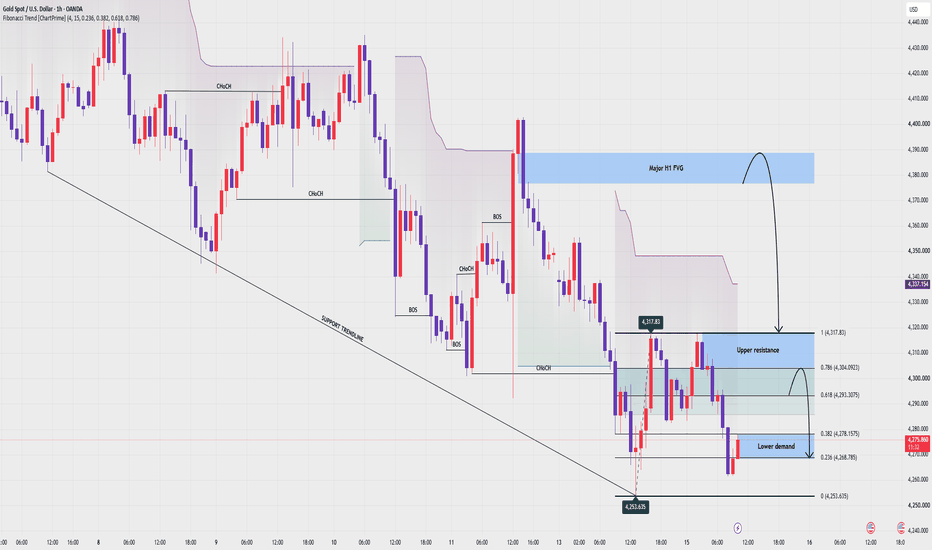
XAUUSD | TRADING PLAN H1 16/09/2026✅ XAUUSD/H1
Gold is currently recovering after bouncing from the 427x Support area. However, price is approaching and reacting around the Supply Zone (4339 - 4345), while also facing the descending trendline. Therefore, we need to wait for a clear reaction around this price area before setting up a trade.
1. BUY SCENARIO
- Price is currently consolidating in a sideways range after the strong bullish move. If buying momentum continues and price breaks out of the Supply Zone (4339 - 4345) while also breaking the descending trendline, a continuation buy setup could target 437x - 440x.
- If price fails to break out of the Supply Zone (4339 - 4345) and pulls back to the Support Zone (4300 - 4310) + FIBO, but fails to break below it and buying pressure returns, a continuation buy setup could target 432x → Supply Zone (4339 - 4345) → 440x.
- If the Support Zone (4300 - 4310) breaks down, the next area to watch is the Demand Zone (4276 - 4284).
2. SELL SCENARIO
- If price approaches the Supply Zone (4339 - 4345) and shows rejection, a short-term sell setup could be considered toward the current sideways range. However, caution is needed because of the strong bullish move; it is safer to wait for clearer confirmation before entering.
- If price breaks out and closes a candle below the Support (4322 - 4325), a short-term sell setup could target the Support Zone (4300 - 4310).
🔴 KEY LEVELS
Supply Zone (4339 - 4345)
Resistance 437x
Resistance Zone (4400 - 4410)
Support 432x
Support Zone (4300 - 4310) + FIBO + EMA
Demand Zone (4276 - 4284) Long 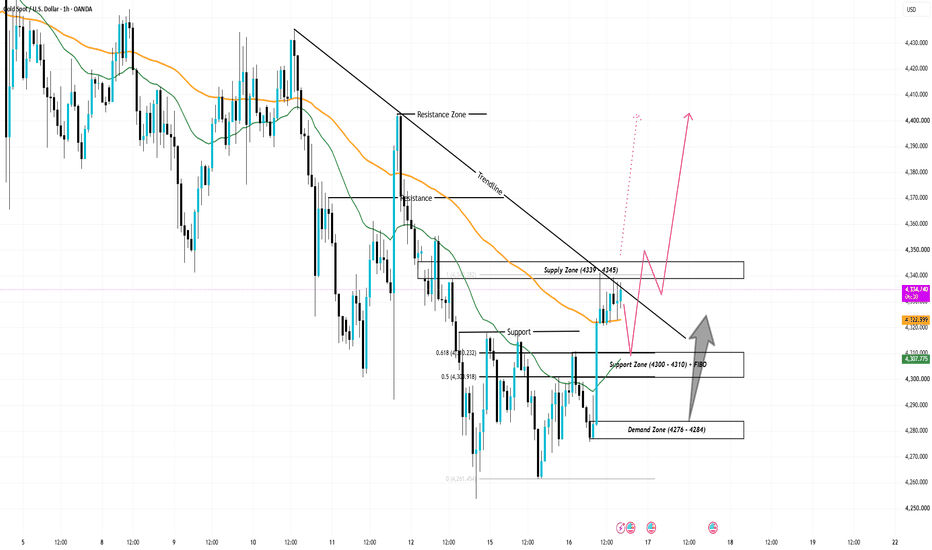
 Long
Long
XAU/USD × kurutologic: Triangle Confluence & 3 ScenariosThis is kurutologic.
Today, I am sharing an updated structural analysis and scenario map for Gold (XAU/USD) on the 4H timeframe to gauge the near-term trading direction.
■ Market Overview
The market is currently forming a symmetrical triangle consolidation. Price is strongly supported by the "4H Support Zone" and the ascending trendline, while being capped by a descending trendline. Volatility is compressing, indicating an energy accumulation phase before the next major impulse.
■ Key Technical Confluence
1. POC & Trendline Intersection
Just above current price lies a critical resistance zone where the highest volume node, the "POC Line & Zone," intersects with the descending trendline.
2. 4H Order Blocks (Purple Boxes)
Above this intersection, unmitigated 4H Order Blocks are stacked in two levels, representing heavy institutional supply.
■ 3 Trade Scenarios & Action Plan
Since we are inside a consolidation pattern, we anticipate a test of the overhead resistance. I have mapped out 3 potential pathways (①-③):
① Rejection at POC Confluence: Price tests the heavy resistance where the POC intersects with the descending trendline and fails, leading to a drop.
② Liquidity Sweep at 4H OB: Even if price breaks the POC, it pushes into the first "4H Order Block" to trap retail breakout buyers. This liquidity sweep results in a sharp fake-out and drop. This is the primary hazard to watch out for.
③ OB Breakout & Support Inversion: A decisive body-candle breakout above the 4H OBs. If price can flip these supply zones into support (pullback) with clear price action, it confirms a high-probability long setup for continuation.
Maintain a neutral bias while inside the triangle. Wait for clear confirmation—either a strong rejection at the upper confluence zones or a decisive breakout—before executing.
This analysis is for educational purposes only and does not constitute financial advice. Always practice strict risk management.
kurutologic S&P 500 – Is a Short-Term Rebound Around the Corner?Market Structure
The S&P 500 remains in a short-term bearish structure on the 4-hour chart. Since the recent peak, the index has continued to print lower highs and lower lows, indicating that sellers remain in control. Price is now approaching an important support zone where buying interest could begin to emerge.
Market Sentiment - Bearish
Although price is attempting to stabilize near support, the overall trend remains under pressure. Buyers have yet to reclaim any major resistance level, suggesting that sentiment continues to favor the downside until a confirmed reversal develops.
Bullish Scenario
If price holds above the 7,580 support area and breaks above 7,660, buying momentum could strengthen and open the door for a recovery toward the 7,740 resistance zone. A sustained move above that level would improve the short-term outlook.
Bearish Scenario
If price breaks below 7,580, selling pressure could accelerate and drive the index toward the 7,500 support area. Losing that level would reinforce the current bearish trend and increase the probability of a deeper pullback.
────────────────────
Market Outlook
The S&P 500 is trading near an important support zone after an extended decline. While downside momentum has slowed, buyers still need to reclaim key resistance before confirming that a meaningful recovery is underway.
────────────────────
Key Levels
First Resistance: 7,660
Second Resistance: 7,740
First Support: 7,580
Second Support: 7,500
────────────────────
Future Scenarios
A break above the first resistance would indicate improving buying momentum and increase the probability of a move toward the second resistance.
Conversely, a break below the first support would reinforce the current bearish structure and expose the second support as the next downside objective.
────────────────────
Event Risk
The S&P 500 may remain sensitive to upcoming U.S. economic data, Federal Reserve policy expectations, Treasury yields, and overall market risk sentiment.
Price action remains the key indicator. If positive news cannot push the index above the first resistance, upside momentum is likely to remain limited. Conversely, a break below the first support would suggest that sellers continue to dominate the market.
────────────────────
Please share your view below:
Do you think the S&P 500 will rebound from this support area, or is another leg lower more likely?
More market structure and key level updates will be shared regularly. DAX Tests a Major Support Zone – Can Buyers Turn the Tide?Market Structure
The German DAX remains in a short-term bearish structure on the 4-hour chart. Price continues to form lower highs and lower lows following the recent rejection from the 26,600 area. Although selling pressure has eased near the current support, buyers have yet to establish a convincing reversal.
Market Sentiment - Bearish
Despite signs of stabilization near support, the broader trend remains under pressure. Until price reclaims key resistance levels, the short-term outlook continues to favor sellers.
Bullish Scenario
If price holds above the 25,350 support area and breaks above 25,700, buying momentum could strengthen and push the index toward the 26,000 resistance zone. A sustained move above that level would indicate that buyers are regaining control.
Bearish Scenario
If price falls below 25,350, selling pressure could increase and expose the next support around 25,000. A decisive break below that level would reinforce the current bearish trend.
────────────────────
Market Outlook
DAX is trading near an important support area after an extended decline. While downside momentum has slowed, buyers still need to reclaim key resistance before a stronger recovery can be confirmed.
────────────────────
Key Levels
First Resistance: 25,700
Second Resistance: 26,000
First Support: 25,350
Second Support: 25,000
────────────────────
Future Scenarios
A break above the first resistance would suggest improving buying momentum and increase the probability of a move toward the second resistance.
On the other hand, a break below the first support would reinforce the bearish structure and could trigger another leg lower toward the second support.
────────────────────
Event Risk
DAX may remain sensitive to Eurozone economic data, ECB policy expectations, U.S. market performance, and overall global risk sentiment.
Price action remains the most important indicator. If positive news cannot push the index above the first resistance, upside momentum may remain limited. Conversely, a break below the first support would confirm that sellers continue to dominate the market.
────────────────────
Please share your view below:
Do you think DAX will rebound from this support zone, or is another downside move more likely?
More market structure and key level updates will be shared regularly. Japan 225 Holds Key Support – Can Buyers Regain Momentum?Market Structure
Japan 225 remains in a short-term bearish structure on the 4-hour chart. Although selling pressure has eased near the recent lows, the index continues to trade below previous swing highs, suggesting that the broader trend has yet to turn higher. Price is currently consolidating around a key support area, waiting for fresh directional momentum.
Market Sentiment - Bearish
Although selling pressure has slowed near support, the overall structure continues to show lower highs and lower lows. Buyers have not yet reclaimed the key resistance levels, so the short-term sentiment remains bearish until a confirmed breakout occurs.
Bullish Scenario
If price continues to hold above the 63,500 support area and breaks above 64,300, bullish momentum could strengthen and open the way toward the 64,900 resistance zone. A sustained move above that level would suggest buyers are regaining control.
Bearish Scenario
If price breaks below 63,500, selling pressure could increase and drive the index toward the 63,000 support area. Losing that level may trigger another wave of downside momentum.
────────────────────
Market Outlook
Japan 225 is currently trading near an important support zone after an extended decline. While downside momentum has slowed, buyers still need to reclaim key resistance levels before confirming a stronger recovery.
────────────────────
Key Levels
First Resistance: 64,300
Second Resistance: 64,900
First Support: 63,500
Second Support: 63,000
────────────────────
Future Scenarios
A break above the first resistance would indicate improving buying momentum and could lead to another attempt toward the second resistance.
On the other hand, a break below the first support would reinforce the current bearish structure and increase the probability of a move toward the second support.
────────────────────
Event Risk
Japan 225 may remain sensitive to Bank of Japan policy expectations, U.S. market performance, global risk sentiment, and movements in the Japanese yen.
Price action remains the key signal. If positive news fails to lift the index above the first resistance, upside momentum may remain limited. Conversely, a break below the first support would indicate that sellers are still in control.
────────────────────
Please share your view below:
Do you think Japan 225 will rebound from this support area, or is another move lower more likely?
More market structure and key level updates will be shared regularly. NASDAQ 100 at a Critical Support Zone – Will Buyers Step In?Market Structure
NASDAQ 100 remains in a short-term bearish consolidation on the 4-hour chart. The recent sequence of lower highs suggests sellers still have the upper hand, with price pulling back toward the key 28,900 support area. This zone has previously attracted buying interest, making it an important level to watch.
Market Sentiment - Slightly Bearish
Bullish Scenario
If price holds above the 28,900 support area and breaks back above 29,400, buying momentum could strengthen and open the door for a move toward the 29,700 resistance zone. A sustained break above that level would improve the short-term outlook.
Bearish Scenario
If price falls below 28,900, the next downside target could be around 28,600. Losing that support may accelerate selling pressure and expose a deeper correction.
────────────────────
Market Outlook
NASDAQ 100 has returned to a key support zone where the next directional move is likely to develop. Whether buyers defend this area or sellers force a breakdown will determine the next short-term trend.
────────────────────
Key Levels
First Resistance: 29,400
Second Resistance: 29,700
First Support: 28,900
Second Support: 28,600
────────────────────
Future Scenarios
A break above the first resistance would indicate improving bullish momentum and could lead to another test of the second resistance.
On the other hand, a break below the first support would strengthen the bearish outlook and increase the probability of a move toward the second support.
────────────────────
Event Risk
NASDAQ 100 may remain sensitive to upcoming U.S. economic data, Federal Reserve expectations, major technology earnings, and overall market risk sentiment.
Price action remains the key signal. If positive news fails to push the index above the first resistance, upside momentum may remain limited. Likewise, if the first support breaks despite improving sentiment, sellers are likely to stay in control.
────────────────────
Please share your view below:
Do you think NASDAQ 100 will rebound from this support area, or is another leg lower more likely?
More market structure and key level updates will be shared regularly.  Short
Short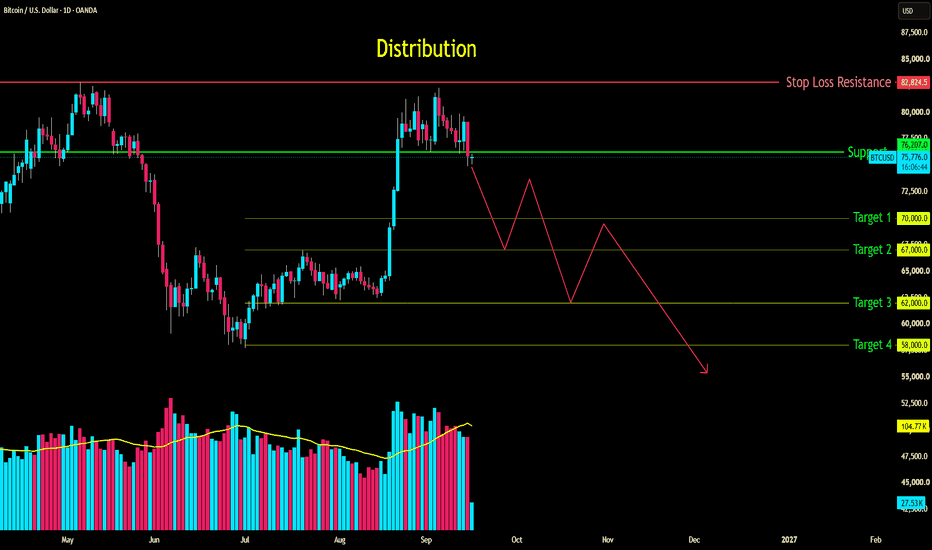
ETH Drops into Key Support — Will Buyers Defend This Zone?Market Structure
Ethereum remains in a bearish market structure on the 4-hour chart after a sharp rejection from recent highs. The latest decline has pushed price back into an important support zone, where buyers are trying to slow selling pressure. However, the overall trend remains weak until ETH can reclaim key resistance.
Market Sentiment - Bearish
Market sentiment remains bearish. Lower highs and the recent impulsive decline suggest sellers are still in control, although short-term buying interest has emerged around current support.
Bullish Scenario
If ETH holds above 2,390 and breaks above 2,470, buying momentum could improve and drive price toward the next resistance around 2,520. A sustained move above that level would suggest the current correction is losing strength.
Bearish Scenario
If ETH breaks below 2,390, sellers could extend the decline toward the next support near 2,350. A decisive break below that level would reinforce the broader bearish structure.
────────────────────
Market Outlook
Ethereum is attempting to stabilize after a strong sell-off. While buyers are defending the current support zone, the broader trend remains under pressure until price reclaims nearby resistance.
────────────────────
Key Levels
First Resistance: 2,470
Second Resistance: 2,520
First Support: 2,390
Second Support: 2,350
────────────────────
Future Scenarios
A break above the First Resistance would indicate improving momentum and could open the way toward the Second Resistance.
However, if price falls below the First Support, sellers may extend the decline toward the Second Support.
────────────────────
Event Risk
Ethereum may remain sensitive to Bitcoin price movements, U.S. macroeconomic data, Federal Reserve expectations, ETF-related flows, and overall crypto market sentiment.
However, price action remains the key indicator. If positive news cannot lift ETH above the First Resistance, upside momentum may remain limited. Conversely, if ETH breaks below the First Support despite supportive headlines, it would suggest sellers remain firmly in control.
────────────────────
Please share your view below:
Do you expect Ethereum to rebound from current support, or will the downtrend continue?
More market structure and key level updates will be shared regularly. XAUUSD — 30M Market Structure AnalysisGold is currently trading around 4,326, with price approaching a descending trendline and a marked supply zone.
🔎 Technical Structure
Price has been respecting a descending trendline, keeping the broader structure under pressure.
A Market Structure Shift (MSS) followed by a BOS suggests a potential short-term change in order flow.
The 4,280–4,300 area is marked as a 30M FVG + OB, which could act as an area of interest if price retraces.
Below that, the 4H OB around 4,230–4,250 provides a deeper structural reference.
The 4,350–4,360 supply/PDH area remains an important resistance zone.
📈 Bullish Scenario
If price retraces into the 30M FVG + OB and shows bullish confirmation on a lower timeframe, the next areas to monitor would be:
4,330 → 4,350 → 4,360
A sustained break and acceptance above the descending trendline and supply zone could indicate further upside toward the higher marked levels.
📉 Bearish Scenario
If price rejects the trendline/supply area and breaks the 30M FVG + OB, attention could shift toward:
4,280 → 4,260 → 4,230–4,250
Confirmation should come from price action/market structure rather than assuming the projected path will occur.
📝 TradingView Idea Description
XAUUSD | 30M Structure & Key Levels 🔍
Gold is approaching a key confluence of the descending trendline and the 4,350–4,360 supply area. Below current price, the 4,280–4,300 region contains a 30M FVG + OB that may become relevant on a retracement.
I’ll be watching how price reacts around these areas and looking for lower-timeframe confirmation before considering the next directional move.
Key Levels:
🔹 4,280–4,300 — 30M FVG + OB
🔹 4,350–4,360 — Supply / PDH
🔹 4,230–4,250 — 4H OB
This is technical market analysis for educational purposes, not financial advice. Price can invalidate either scenario.
#XAUUSD #Gold #Forex #PriceAction #MarketStructure #SMC #ICT #TechnicalAnalysis Long 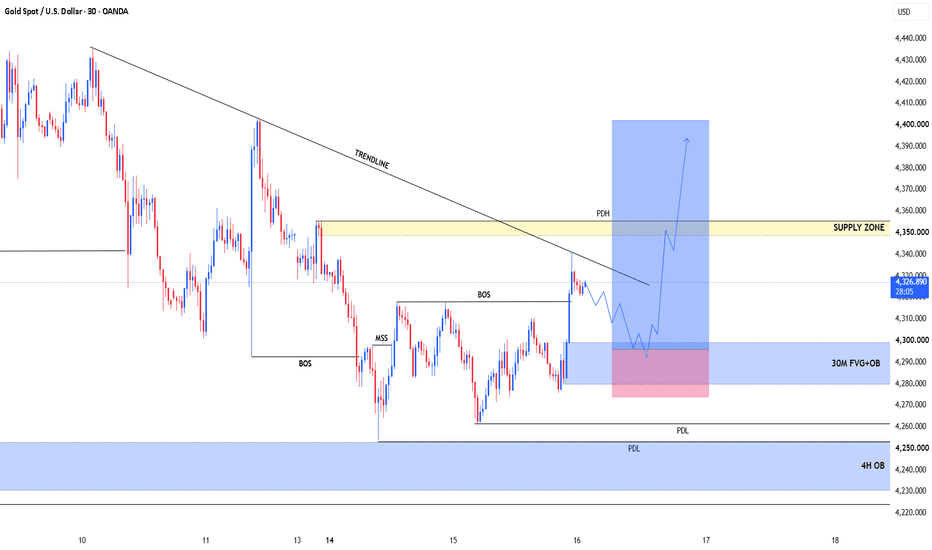
BTC Faces Heavy Selling Pressure — Can Support Hold?Market Structure
Bitcoin remains in a bearish market structure on the 4-hour chart. After failing to sustain recent rebounds, sellers regained control and pushed price back toward a key support area. Although buyers are attempting to stabilize the decline, the overall structure still favors the downside unless BTC reclaims nearby resistance.
Market Sentiment - Bearish
Market sentiment remains bearish. Consecutive lower highs and lower lows indicate that sellers continue to dominate, while buying interest is mainly defensive around current support.
Bullish Scenario
If BTC holds above support and breaks back above 76,500, short-term buying momentum may strengthen and drive price toward the next resistance near 77,500. A sustained move above that level would suggest the correction is losing momentum.
Bearish Scenario
If BTC breaks below 75,200, selling pressure could accelerate and expose the next downside target around 74,800. A decisive breakdown would reinforce the current bearish trend.
────────────────────
Market Outlook
Bitcoin is trading near an important support zone after an extended decline. Buyers are trying to defend current levels, but the overall trend remains under pressure until key resistance is reclaimed.
────────────────────
Key Levels
First Resistance: 76,500
Second Resistance: 77,500
First Support: 75,200
Second Support: 74,800
────────────────────
Future Scenarios
A break above the First Resistance would indicate improving momentum and could open the way toward the Second Resistance.
However, if price falls below the First Support, sellers may extend the decline toward the Second Support.
────────────────────
Event Risk
Bitcoin may remain sensitive to U.S. macroeconomic data, Federal Reserve expectations, ETF-related flows, and overall market risk sentiment.
However, price action remains the key indicator. If positive news cannot lift BTC above the First Resistance, upside momentum may remain limited. Conversely, if BTC breaks below the First Support despite supportive headlines, it would suggest sellers remain firmly in control.
────────────────────
Please share your view below:
Do you expect Bitcoin to rebound from current support, or will the downtrend continue?
More market structure and key level updates will be shared regularly. XAUUSD — 4,257 Hold or 4,214 Sweep?
Gold is trading around 4,273 after extending the M30 decline below yesterday’s reaction support.
Price remains under the descending trendline, while the latest recovery attempt failed to create a meaningful structure shift.
Macro pressure is also still heavy ahead of the Fed decision, with elevated yields, a firm dollar and higher oil prices keeping Gold under pressure.
But price is now moving closer to the lower reaction zones.
And this is where chasing the sell becomes less attractive.
The reaction is the signal.
The simple read
M30 structure remains bearish below the descending trendline.
The latest bounce reached the 4,31x area but failed below the major resistance zone around 4,319.
Price has now moved back below the 0.618 Fibonacci level near 4,277 and is approaching the 0.786 area around 4,267.
The first important support sits around 4,253–4,257.
This area combines the previous swing low, Fib completion and visible reaction demand.
A clean buyer response here could create a temporary recovery.
But support is not an automatic buy.
If 4,257 fails, the chart leaves room for a deeper liquidity sweep toward 4,214.
That lower zone aligns closely with the 1.618 Fibonacci extension and is the stronger downside reaction area on this M30 structure.
On the upside, 4,285 is the first small recovery test.
The bigger level is still 4,319.
This area combines resistance with the descending trendline and remains the key seller decision zone.
Key price zones
Current price area: 4,273
Immediate Fibonacci reaction: 4,267–4,277
Main support / buy reaction zone: 4,253–4,257
Deeper liquidity zone: around 4,214
First recovery resistance: around 4,285
Main resistance + trendline: around 4,319
Major upper supply: around 4,398
Trading plan
Buy reaction scenario
If Gold reaches 4,253–4,257:
I will watch for sellers to lose momentum and buyers to show a clear reaction.
A confirmed recovery can first reopen 4,277–4,285.
If price then breaks the descending trendline, 4,319 becomes the next important test.
But I will not buy simply because price touches support.
Sell reaction scenario
If Gold recovers toward 4,285 or especially 4,319 and rejects:
The bearish M30 structure can remain intact.
A failed recovery may send price back toward 4,257.
Breakout scenario
If Gold breaks the trendline and can hold above 4,319:
The short-term structure changes significantly.
That would improve the recovery case and shift attention toward the higher resistance zones.
Breakdown scenario
If 4,257 cannot hold:
I would watch for the deeper liquidity move rather than chase the breakdown.
The next major reaction zone becomes 4,214.
A sweep into that area followed by a strong reclaim could create a much cleaner recovery structure.
The trend is still bearish.
But price is getting closer to support.
4,257 is the first buyer test.
4,214 is the deeper liquidity test.
4,319 is the real recovery confirmation level. Long 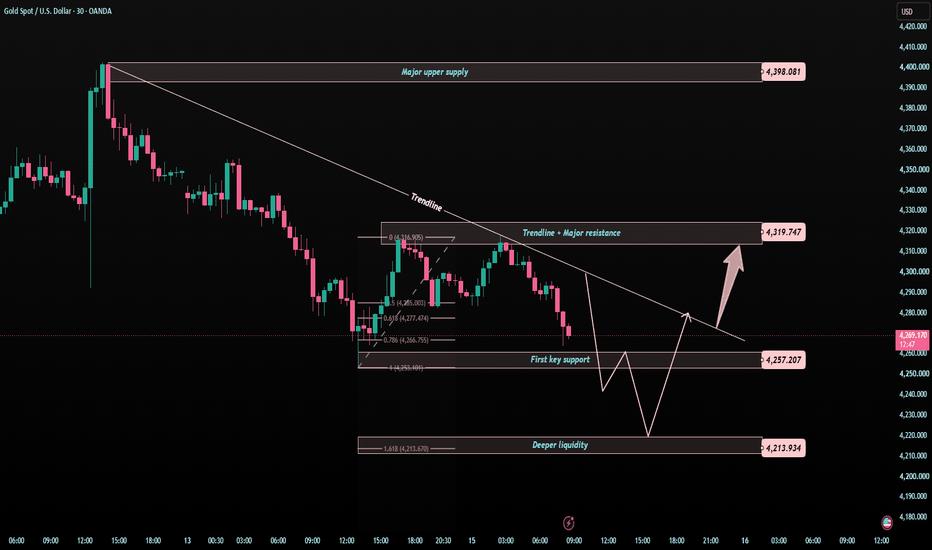
XAUUSD - Bullish Continuation Setup and Further Upside Expansion🔍 Market Overview
Gold continues to maintain a positive bullish structure on the daily timeframe after recovering strongly from the 4,120–4,198 support zone. The previous rally pushed price toward higher levels, while the current correction has not yet broken the broader bullish structure.
As long as buyers continue to defend the marked support zone and the higher-low structure remains intact, the overall trend continues to favor further upside expansion in XAUUSD.
📈 Market Structure Analysis
Market Trend: Bullish
Momentum: Corrective / Consolidating
Current Phase: Bullish Continuation
The price structure shows that Gold broke away from the lower consolidation area with strong bullish momentum. The recent decline is bringing price lower, but for now, it still appears to be a pullback within the broader uptrend rather than a confirmed bearish reversal.
Price remaining comfortably above the main support zone suggests that buyers still have the advantage. A clear bullish reaction from the current structure could trigger the next upside expansion.
🚀 Trading Scenario
✅ Bullish Scenario
Main trend conditions:
Price continues to hold above the 4,120–4,198 support zone.
The higher-low structure remains intact.
Selling pressure begins to weaken during the correction.
Price regains bullish momentum after the pullback.
Trading Plan:
Look for buying opportunities after a confirmed bullish reaction rather than chasing price while the correction is still developing. A recovery of the short-term bullish structure would provide stronger confirmation for trend continuation.
🎯 Target 1: 4,612
🎯 Target 2: 4,755
❌ Bullish Invalidation Conditions
Price decisively breaks below the main support zone.
A daily candle closes strongly below 4,120.
Market structure begins forming lower lows.
The correction develops into a strong bearish expansion.
A confirmed breakdown below the support zone would significantly weaken the current bullish setup and could open the door for a deeper correction.
🎯 Key Support Zone: 4,120–4,198
📍 Key Levels to Watch
🟢 Nearest Resistance: 4,612
🟢 Main Target: 4,755
🔴 Nearest Support: 4,198
🔴 Key Support: 4,120
⚠️ Trading View
The overall structure remains bullish while XAUUSD holds above the key demand zone. The current decline may simply represent a corrective and reaccumulation phase before buyers attempt to regain control.
If price stabilizes and bullish momentum returns, 4,612 becomes the first upside target. A convincing breakout above this area could extend the move toward 4,755.
However, losing the 4,120–4,198 support zone would materially change the structure and require a reassessment of the bullish scenario.
🧠 Expert View
The current setup is supported by:
Strong recovery from the main support zone.
The higher-timeframe bullish structure remains intact.
Price has not returned below the previous breakout area.
The current decline still has the characteristics of a pullback.
The potential for another higher low remains intact.
Clear upside targets at 4,612 and 4,755.
Preferred approach: Avoid trying to catch the exact bottom and avoid chasing price. Wait for the market to show that buyers are genuinely returning before considering positions in the direction of the broader trend.
🛡️ Risk Management
Risk only 1–2% of trading capital per position.
Define the invalidation level before entering.
Place stop losses according to the relevant support structure.
Do not increase position size simply because price continues to correct.
Wait for price-action confirmation rather than relying purely on prediction.
If the support structure fails, respect the market signal and reassess the bias.
Disclaimer: This analysis is provided for educational purposes and to share a market perspective only. It should not be considered financial or investment advice. Long 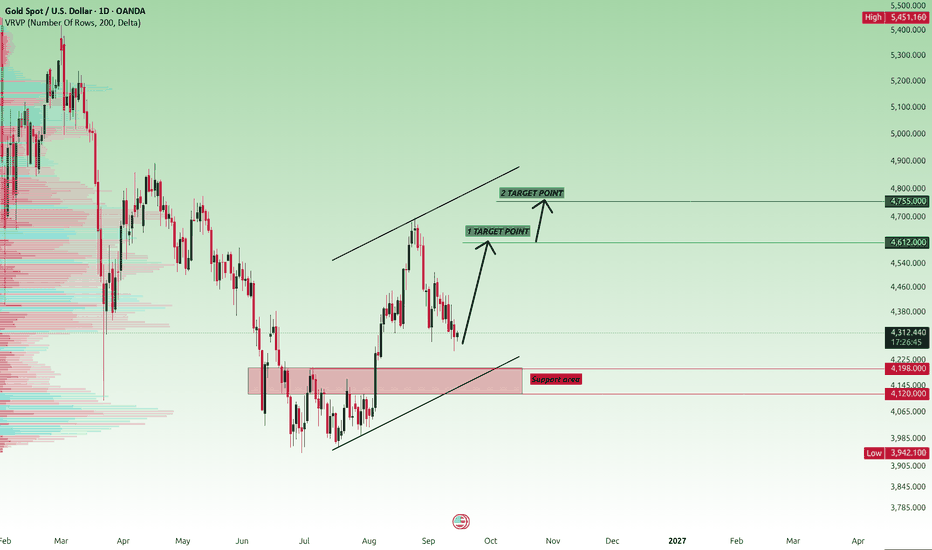
 Long
Long
BTC Holds the Line — Is $82K Next?BTC/USD currently looks more like a consolidation above support than the beginning of a deeper decline. After repeatedly testing the 76,000–77,000 area, price has been quickly pushed back up each time — a sign that buyers are still actively absorbing selling pressure at lower levels.
More importantly, the recent pullbacks have yet to break the key H4 support zone. Price is trading around the Ichimoku Cloud and continues to attract buying interest whenever it approaches the lower end of the structure. This type of price action suggests that BTC may be compressing inside a broader range rather than developing a new bearish trend. If buyers manage to reclaim the area above the Ichimoku Cloud, recovery momentum could accelerate quickly.
However, the macro backdrop remains a major obstacle. Expectations of a Fed rate hike following hotter-than-expected U.S. inflation, elevated Treasury yields, and weaker Bitcoin ETF flows have all been putting pressure on risk assets. As a result, any BTC rally ahead of the FOMC decision could still come with sharp volatility and short-term pullbacks.
If BTC continues to hold the 76,000–77,000 support zone, I expect price to have a chance to recover toward the major resistance area around 81,500–82,000. This will be the real test for buyers — only a decisive break above this zone would open the door to a larger bullish move. Long 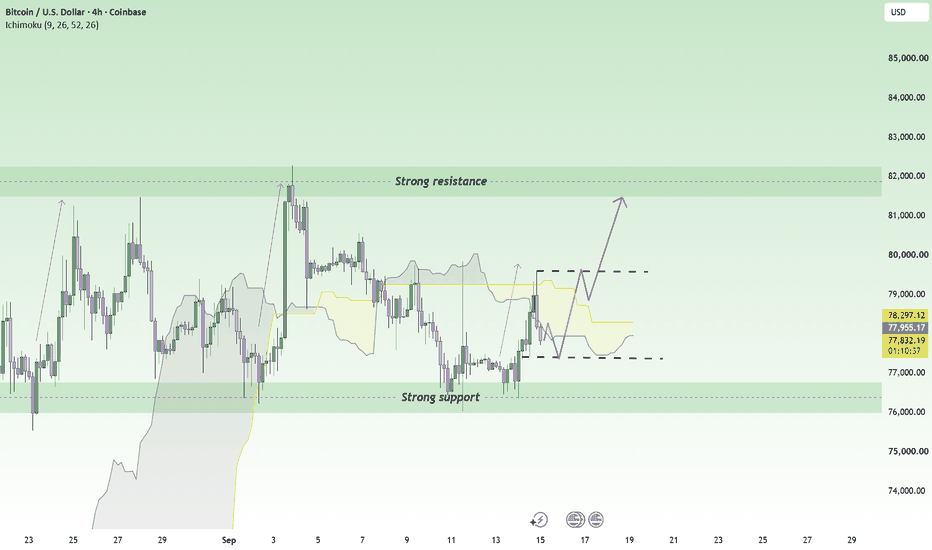
DXY 2H | The Next Structure Will Define the Larger Path⏱️ Estimated Reading Time: About 2 Minutes
Following our daily DXY analysis, we are now moving down to the 2-hour chart to examine what the current movement may be building at the lower degree.
In the bullish scenario, if the recent correction has already completed, the market should now be developing a new Wave 1. Therefore, simply seeing price move higher is not enough. Price needs to break decisively out of the marked black boxes and then develop a valid motive structure.
If that happens, the bullish higher-degree scenario gains more weight, while structures such as a Leading Diagonal or Nested 1–2 remain possible.
However, the bearish scenario is still alive.
If price moves slightly beyond the previous peak at the lower degree, but fails to develop a strong and valid bullish structure and then turns lower again, the market could instead be building another corrective structure, such as another Zigzag.
In that case, the correction could become deeper and more time-consuming, giving the higher-degree bearish scenario greater importance again.
So at this stage, price action and the quality of the structure matter more than the direction of the move itself.
If the breakout is accompanied by a valid motive structure, the bullish scenario will strengthen.
If the move beyond the previous peak proves temporary and a valid bearish structure develops afterward, the probability of further correction will increase.
For now, we let the market make the decision.
The higher timeframe gives us the map;
the 2-hour chart must show us which path the market is actually building.
Structure First. Scenario Second.
Patterns whisper. I listen.
— Mr. Nobody 🎧📊
Dollar Index Future
7 hours ago
DXY | When Structure Reveals the Dollar’s Next Path
 Long
Long